. 2024 Dec 6;25(23):13128.
doi: 10.3390/ijms252313128.

An Unbiased Approach to Identifying Cellular Reprogramming-Inducible Enhancers

Affiliations

An Unbiased Approach to Identifying Cellular Reprogramming-Inducible Enhancers

Eleftheria Klagkou et al. Int J Mol Sci. .

Abstract

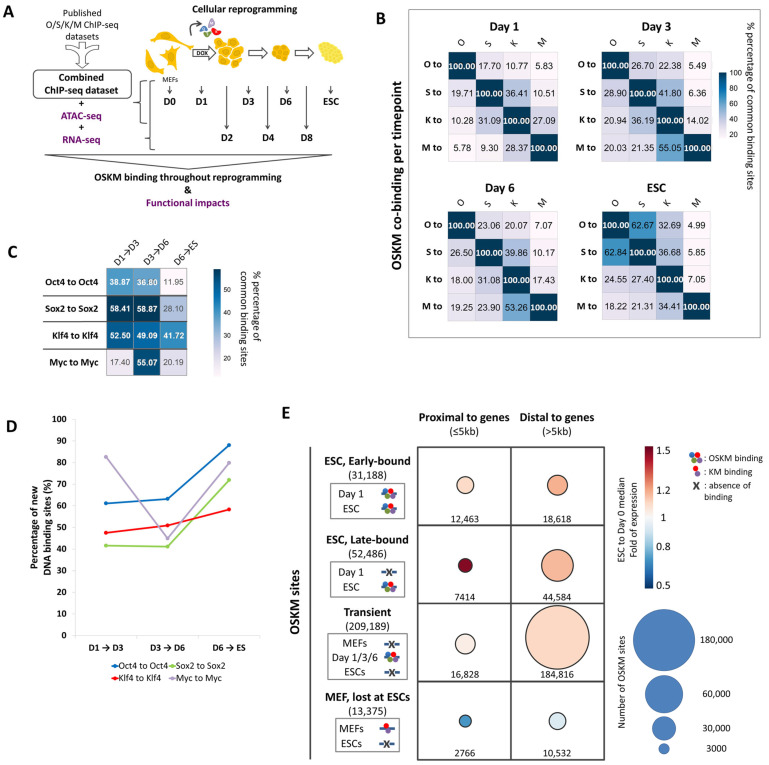
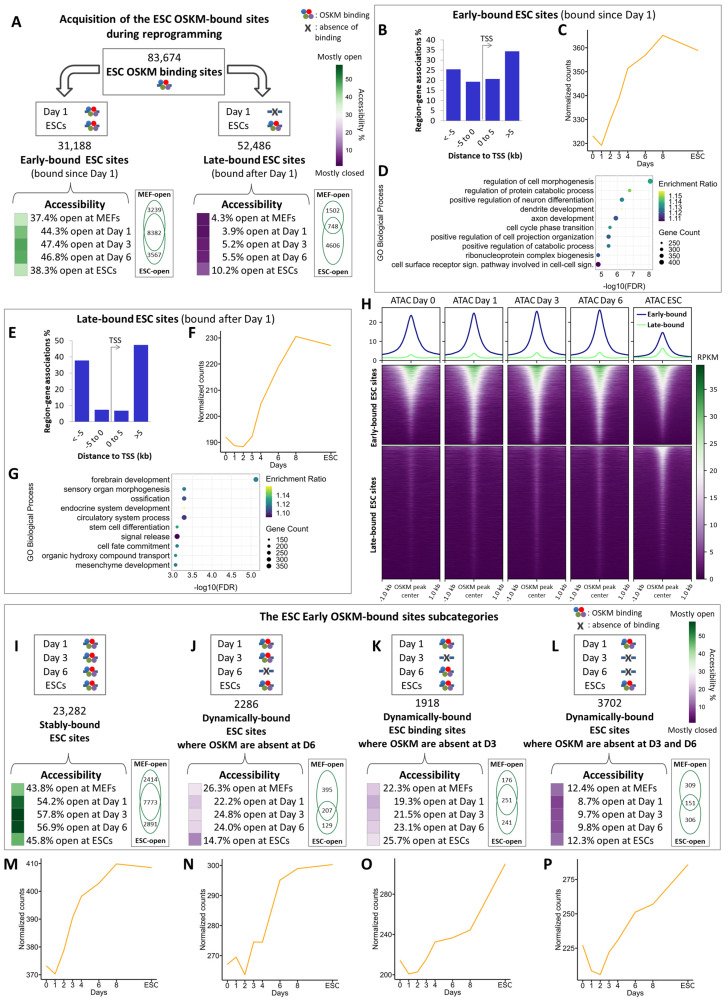
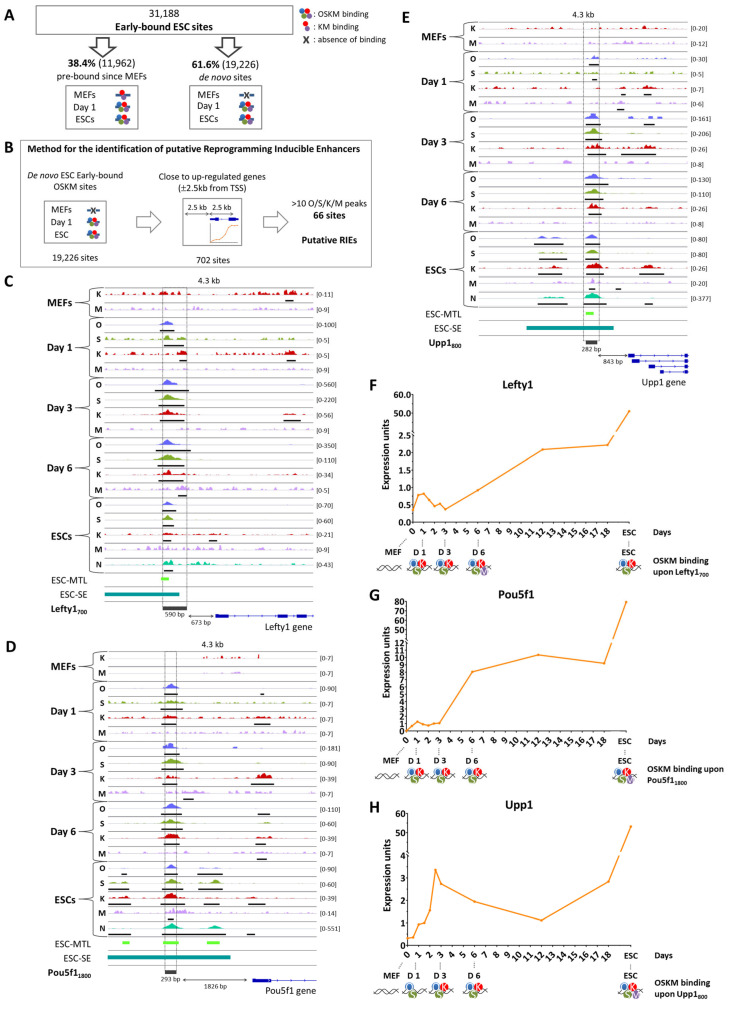
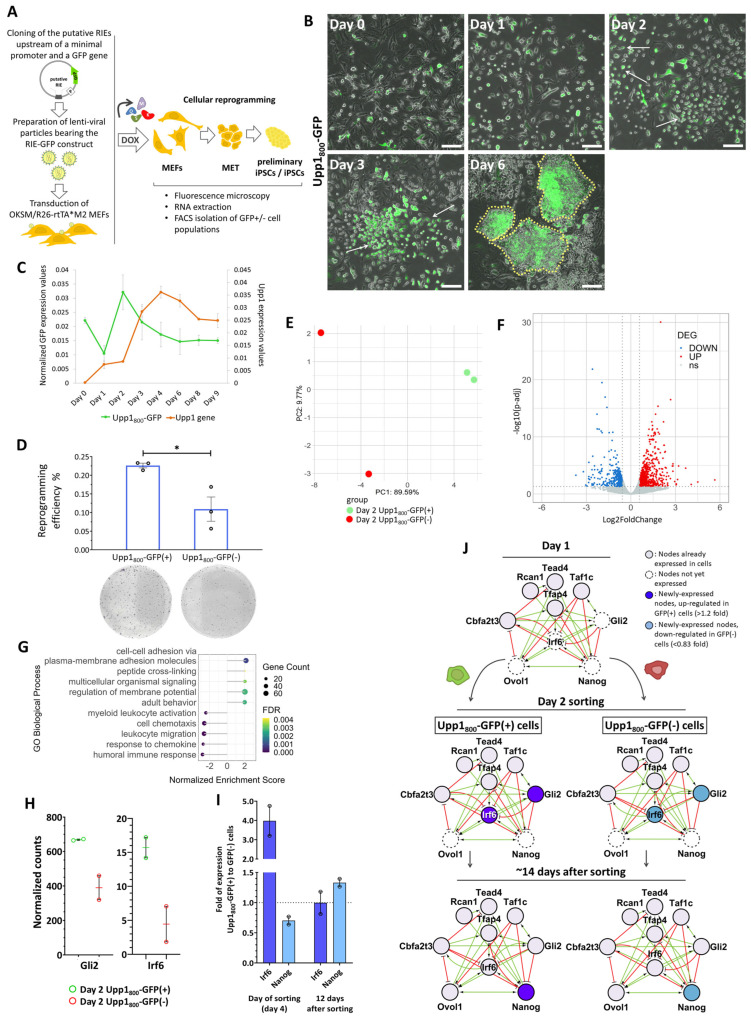
Cellular reprogramming of somatic cells towards induced pluripotency is a multistep stochastic process mediated by the transcription factors Oct4, Sox2, Klf4 and c-Myc (OSKM), which orchestrate global epigenetic and transcriptional changes. We performed a large-scale analysis of integrated ChIP-seq, ATAC-seq and RNA-seq data and revealed the spatiotemporal highly dynamic pattern of OSKM DNA binding during reprogramming. We found that OSKM show distinct temporal patterns of binding to different classes of pluripotency-related enhancers. Genes involved in reprogramming are regulated by the coordinated activity of multiple enhancers, which are sequentially bound by OSKM for strict transcriptional control. Based on these findings, we developed an unbiased approach to identify Reprogramming-Inducible Enhancers (RIEs), constructed enhancer-traps and isolated cells undergoing reprogramming in real time. We used a representative RIE taken from the Upp1 gene fused to Gfp and isolated cells at different time-points during reprogramming and found that they have unique developmental capacities as they are reprogrammed with high efficiency due to their distinct molecular signatures. In conclusion, our experiments have led to the development of an unbiased method to identify and isolate reprogrammable cells in real time by exploiting the functional dynamics of OSKM, which can be used as efficient reprogramming biomarkers.

Keywords: OSKM; cellular reprogramming; chromatin structure; enhancers; genomics; iPSCs; transcription factors; transcriptional regulation.


Conflict of interest statement

The authors declare no conflicts of interest. The funders had no role in the design of the study; in the collection, analyses, or interpretation of data; in the writing of the manuscript; or in the decision to publish the results.

Figures

Figure 1
Figure 1
Oct4, Sox2, Klf4 and c-Myc (OSKM) bind to the genome in a dynamic fashion during cellular reprogramming. (A) Graphical representation of the experimental approach used to map the OSKM binding sites during cellular reprogramming and their functional output. We integrated published O/S/K/M ChIP-seq experiments to construct a composite ChIP-seq dataset representing the day 0 (D0), day 1 (D1), day 3 (D3), day 6 (D6) time-points together with the Embryonic Stem Cells (ESC) stage. These data were further integrated with results obtained from ATAC-seq at the same time-points and with RNA-seq experiments performed at day 0 (D0), day 1 (D1), day 2 (D2), day 3 (D3), day 4 (D4), day 6 (D6), day 8 (D8) and ESCs. (B) Heatmaps depicting the extent of the combinatorial binding of O/S/K/M throughout reprogramming (Day 1, Day 3, Day 6 and ESC). Values are calculated as the percentage of binding sites occupied by the Oct4 (O), Sox2 (S), Klf4 (K) and Myc (M) transcription factors (rows) in combination with each of the other three factors (columns), per time-point. The value 100% depicts the total binding sites occupied by each factor. Compare row name to column name. (C) Heatmap depicting the percentage of DNA binding sites occupied by Oct4, Sox2, Klf4 and Myc, which have been preserved between two sequential time-points. For example, the value 38.87% (intersection of Oct4 to Oct4 row with D1 → D3 column) represents the percentage of the Oct4 binding sites at day 1 that have been preserved at day 3. (D) Linegraph depicting the mobility of O/S/K/M by plotting the relative number of new binding sites occupied by each of the O/S/K/M between two sequential time-points of reprogramming. (E) Schematic representation of the different classes of OSKM binding sites occupied during cellular reprogramming. OSKM are depicted as multi-color circles bound to DNA per time-point (left). The absence of OSKM binding to a specific set of sites at a given time-point as compared to ESCs and vice versa is marked with an “X”. Each class of OSKM sites is divided in regions either proximal (≤5 kb) or distal (>5 kb) relative to the neighboring genes’ TSS. The size of the circles in the table represents the number of OSKM binding sites of each of the corresponding class. The median expression fold between ESCs and Mouse Embryonic Fibroblasts (MEFs, Day 0) for each class of genes is depicted as a heatmap in the figure.
Figure 2
Figure 2
Identification and characterization of the ESC OSKM binding sites acquired during cellular reprogramming. (A) Graphical representation summarizing the acquisition of the ESCs OSKM binding sites during reprogramming. OSKM are depicted as multi-color circles bound to DNA. The absence of OSKM binding to a specific set of sites on Day 1 as compared to ESCs is marked with an “X”. The heatmap shown at the bottom part of the figure depicts the percentage of each class of OSKM sites lying in open chromatin regions during reprogramming (MEFs, Day 1, Day 3, Day 6, ESCs). Green and purple colors correspond to the percentage of binding sites accessible per time-point (green for >30%, purple for <30%). The Venn diagrams depict the common chromatin open sites between MEFs and ESCs for each class of sites. (B) Association of the early-bound OSKM ESC sites with the neighboring genes using the GREAT algorithm. Depicted is the distribution of the OSKM sites relative to the nearest gene Transcription Start Site (TSS) within 1000kb distance. (C) Shown is a line graph depicting normalized counts for the expression of genes associated with the early-bound OSKM ESC sites during cellular reprogramming. The median expression value is shown for each time-point; (D) Functional enrichment analysis (over-representation analysis, ORA) of the genes located near the early-bound OSKM ESC sites. Depicted are the top 10 terms as sorted using FDR (FDR < 0.01). The Gene Ontology (GO) Biological Process library (non-redundant terms) was used. (E) Same as in B, but for the late-bound OSKM sites. (F) Same as in C, but for the late-bound OSKM sites. (G) Same as in D, but for the late-bound OSKM sites. (H) Summary plots and heatmaps depicting the ATAC-seq signal at the early- and late-bound OSKM ESC sites from -1kb to +1km from the center of the OSKM peaks during cellular reprogramming (Day 0, Day 1, Day 3, Day 6, ESCs). The signal is calculated as RPKM. The OSKM sites are sorted in a descending order based on the ATAC-seq signal in ESCs. (I) Graphical representation summarizing the acquisition of the stably-bound OSKM ESC binding sites during reprogramming. OSKM are depicted as multi-color circles bound to DNA. The absence of OSKM binding to a specific set of sites on Day 3, or Day 6, as compared to ESCs is marked with an “X”. The heatmap shown at the bottom part of the figure depicts the percentage of the stably-bound OSKM ESC sites lying in open chromatin regions during reprogramming (MEFs, Day 1, Day 3, Day 6, ESCs). Green and purple colors correspond to the percentage of binding sites accessible per each time-point (green for >30%, purple for <30%). The Venn diagrams depict the common chromatin open sites between MEFs and ESCs. (J) As in I, but for the early OSKM ESC sites bound on Day 1, Day 3 and ESCs (Dynamically-bound early ESC sites, where OSKM are absent on Day 6). (K) As in I, but for the early OSKM ESC sites bound on Day 1, Day 6 and ESCs (Dynamically-bound Early ESC sites, where OSKM are absent on Day 3). (L) As in I, but for the early OSKM ESC sites bound only on Day 1 and ESCs (Dynamically-bound Early ESC sites, where OSKM are absent on Day 3 and 6). (M) As in C, but for the stably-bound OSKM ESC sites. (N) As in C, but for the early OSKM ESC sites bound on Day 1, Day 3 and ESCs (Dynamically-bound Early ESC sites, where OSKM are absent on Day 6). (O) As in C, but for the early OSKM ESC sites bound on Day 1, Day 6 and ESCs (Dynamically-bound Early ESC sites, where OSKM are absent on Day 3). (P) As in C, but for the early OSKM ESC sites bound only on Day 1 and ESCs (Dynamically-bound Early ESC sites, where OSKM are absent on Day 3 and 6).
Figure 3
Figure 3
Identification of putative Reprogramming-Inducible Enhancers (RIEs) in the mouse genome. (A) Graphical representation summarizing the acquisition of the early-bound OSKM ESC sites. The left panel shows sites that are pre-bound by KM in MEFs, whereas the right panel depicts the de novo sites occupied by OSKM after initiation of reprogramming. OSKM are depicted as multi-color circles bound to DNA. The absence of OSKM binding to a specific set of sites in MEFs as compared to ESCs is marked with an “X”. (B) Graphical representation of the unbiased method used to identify putative RIE elements along with the sequential filtering of the OSKM-bound genomic elements. (C) Shown are ChIP-seq bigwig files in the Integrated Genome Viewer (IGV) browser depicting the binding of Oct4 (O, blue), Sox2 (S, green), Klf4 (K, red), Myc (M, purple) and Nanog (N, cyan) to Lefty1700 putative RIE in MEFs undergoing reprogramming (Day 1, Day 3 and Day 6) and in control MEFs (Day 0) and ESCs. The scale for each snapshot is shown on the right. The binding signal has been calculated as RPKM after subtraction of the input signal from the respective immunoprecipitation (IP) signal. Statistically significant peaks are depicted with a black bar below the respective lane. The ESC Multiple Transcription Factor binding Loci (ESC-MTL) is depicted as a light green bar. The Lefty1 ESC-specific super-enhancer (ESC-SE) is depicted as a petrol bar. The position of the Lefty1700 element is depicted as a dark grey bar at the bottom of the panel. (D) As in C, but for the Pou5f11800 element. (E) As in C, but for the Upp1800 element. (F) Shown is a line graph depicting normalized expression units of the Lefty1 gene during reprogramming. The bottom part of the panel summarizes the binding of OSKM at each time-point (data taken from (C)). Oct4 (O) is depicted in blue, Sox2 (S) in green, Klf4 (K) in red and c-Myc (M) in purple. (G) As in F, but for the Pou5f1 gene and the Pou5f11800 element. Data taken from (D). (H) As in F, but for the Upp1 gene and the Upp1800 element. Data taken from (E).
Figure 4
Figure 4
The Upp1800 element is a Reprogramming-Inducible Enhancer (RIE) that marks cells undergoing reprogramming and the early induced Pluripotent Stem Cell (iPSC) colonies. (A) Shown is the experimental outline used to test the transcriptional capacity of the putative RIEs. (B) Representative fluorescence microscopy images taken from a time-course reprogramming experiment using MEFs transduced with the lenti-virus bearing the Upp1800-GFP reporter cassette. The brightfield (phase contrast) and fluorescence images were merged in each time-point. The white arrows point to cells abandoning the MEF phenotype (Mesenchymal to Epithelial Transition, MET). Early iPSC formations are indicated with yellow dashed lines. Scale bar: 150 μm. (C) Line graph depicting the expression of the endogenous Upp1 gene (orange line, right axis) in comparison with the expression of the Upp1800-GFP transgene (green line, left axis). Shown are the mean expression values from two biological replicates and the standard error. (D) Bar graphs showing the iPSCs generation efficiency (%) of the isolated (day 4) Upp1800-GFP(+) cells undergoing reprogramming, as compared to the Upp1800-GFP(−) cells isolated from the same experiment used as control. Three biological replicates are depicted. The mean and the standard error are also depicted. Unpaired two-tailed t-test was performed (t = 3.525, df = 4, p-value = 0.024). Representative images of the Alkaline Phosphatase (AP)-staining plates are also shown at the bottom. *: p-value < 0.05. (E) PCA analysis of the RNA-seq profile of Upp1800-GFP(+) (green) and GFP(−) cells (red) isolated on day 2 of reprogramming. (F) Volcano plot depicting the number of DEGs identified between Upp1800-GFP(+) and GFP(−) cells. Cut-offs for Volcano plot: p-adjusted < 0.05 (horizontal dotted line) and Log2FC > 0.58 or <−0.58 (vertical dotted lines). (G) Functional enrichment analysis (Gene Set Enrichment Analysis, GSEA) of the genes expressed in Upp1800-GFP(+) cells isolated on day 2 as compared to control Upp1800-GFP(−) cells. Log2FC was used for ranking. The Gene Ontology (GO) Biological Process library (non-redundant terms) was used. Depicted are the top 5 terms with both positive and negative normalized enrichment scores. (H) Dot plots depicting normalized counts for the expression of the Gli2 and Irf6 genes in the Upp1800-GFP(+) and GFP(−) cells, as calculated by RNA-seq on day 2 of reprogramming. Two biological replicates are depicted. The mean and the standard error are also depicted. (I) Bar chart depicting the fold change of Irf6 and Nanog expression between the Upp1800-GFP(+) and GFP(−) cells on day 4 (day of isolation) and 12 days after isolation of the cells. The dashed line represents the fold of expression equal to 1. Two biological replicates are depicted for each cell type. The mean and the standard error are also indicated. (J) Schematic representation of the 9TR-GRN (9 Transcriptional Regulators Gene Regulatory Network) network’s sequential assembly along with the network nodes’ expression status in cells bearing the Upp1800-GFP transgene on Day 1 (top panel, before sorting) and after sorting to Upp1800-GFP(+) and GFP(−) cells (Day 2 to Day 14 of reprogramming, middle and bottom panel, respectively). The representation is shown according to Papathanasiou et al., 2021 [10]. The green arrows represent the positive effect of one regulator to another. The red lines represent inhibitory effects of one regulator to another.

References

    1. Takahashi K., Yamanaka S. Induction of Pluripotent Stem Cells from Mouse Embryonic and Adult Fibroblast Cultures by Defined Factors. Cell. 2006;126:663–676. doi: 10.1016/j.cell.2006.07.024. - DOI - PubMed
    1. Takahashi K., Tanabe K., Ohnuki M., Narita M., Ichisaka T., Tomoda K., Yamanaka S. Induction of pluripotent stem cells from adult human fibroblasts by defined factors. Cell. 2007;131:861–872. doi: 10.1016/j.cell.2007.11.019. - DOI - PubMed
    1. Yamanaka S. Elite and stochastic models for induced pluripotent stem cell generation. Nature. 2009;460:49–52. doi: 10.1038/nature08180. - DOI - PubMed
    1. Buganim Y., Faddah D.A., Jaenisch R. Mechanisms and models of somatic cell reprogramming. Nat. Rev. Genet. 2013;14:427–439. doi: 10.1038/nrg3473. - DOI - PMC - PubMed
    1. Takahashi K., Yamanaka S. A decade of transcription factor-mediated reprogramming to pluripotency. Nat. Rev. Mol. Cell Biol. 2016;17:183–193. doi: 10.1038/nrm.2016.8. - DOI - PubMed

MeSH terms

Substances