. 2024 Dec 7;25(23):13150.
doi: 10.3390/ijms252313150.

Thymol Impacts the Progression of Endometriosis by Disrupting Estrogen Signaling Pathways and Inflammatory Responses

Affiliations

Thymol Impacts the Progression of Endometriosis by Disrupting Estrogen Signaling Pathways and Inflammatory Responses

Yu Zhang et al. Int J Mol Sci. .

Abstract

Endometriosis is a chronic inflammatory, estrogenic disorder caused by endometrial tissue growth places other than uterine lumen, resulting in infertility and severe pelvic pain. Thymol, an extract of Thymus vulgaris, processes diverse biological properties, including anti-inflammatory, local anesthetic, decongestant, and antiseptic effects. However, the efficacy of thymol in treating endometriosis has still not been explored. Herein, this research aimed to investigate the role of thymol in the treatment of endometriosis using a murine model and Ishikawa cells. Thirty C57BL/6 mice were administered 17β-E2 (100 ng/mouse) subcutaneously for three consecutive days to induce synchronous estrus. On the last day of injection, the mice underwent surgical induction of endometriosis. After that, the mice were divided into three groups, i.e., Control (CTRL), Thymol 30 mg/kg and Thymol 60 mg/kg, receiving oral administration of either saline or thymol (30 mg/kg/d or 60 mg/kg/d, as 0.1 mL/kg/d, respectively) for a three-week duration. Each group consisted of ten mice and was evenly divided into estrus and diestrus according to the vaginal cytology on the last day of treatment. Thymol significantly (p < 0.05) reduced the weight and volume of ectopic tissue, hindered cell proliferation, and stimulated apoptosis compared to the CTRL group. Additionally, in the thymol-treated group, the levels of pro-inflammatory cytokines, tumor necrosis factor-α (TNF-α), interleukin (IL)-1β, and IL-6, as well as the numbers of neutrophils and macrophages, were significantly (p < 0.05) decreased. Moreover, a novel role of thymol in rebalancing estrogen and progesterone (E2-P4) signaling was explored, and it was distributed in the ectopic endometrium. Next, the role of thymol on Ishikawa cells was determined. The results demonstrated that thymol significantly (p < 0.05) suppressed the E2-induced proliferation of Ishikawa cells. Furthermore, molecular docking analyses suggested that thymol potentially binds to ESR1-like estrogens, indicating its antagonistic activity against estrogens. The estrogen receptor 1 (ESR1) and its target gene expression exhibited significant (p < 0.05) downregulation, while progesterone receptor (PGR) and target genes were markedly (p < 0.05) upregulated following thymol treatment in the ectopic endometrium. Most importantly, our data revealed the minimal impact of thymol treatment on the eutopic endometrium and its crucial role in supporting pregnancy, thus indicating the safety of thymol in treating endometriosis. Overall, our study suggests that thymol holds promising therapeutic implications for endometriosis by virtue of its anti-inflammatory properties and ability to antagonize estrogen activity.

Keywords: endometriosis; estrogen signaling; inflammation; thymol.


Conflict of interest statement

The authors declare no conflicts of interest.

Figures

Figure 1
Figure 1
Growth inhibitory effect of thymol on endometriosis. (A) Illustration of the methodology employed in the endometriosis mice model treated with thymol. (B) The ectopic endometriosis lesion was photographed 21 days after treatment; each image was obtained from an individual mouse (n = 5). The scale bar is 1 mm. (C) The relative weight of lesions during the estrous and diestrous phases. (D) Histopathology of ectopic lesions (n = 5). Red arrowheads pointing epithelium cells. The scale bar is 100 µm. CTRL, DIE, E, E2, and EMS represent control, diestrus, estrus, estrogen, and endometriosis, respectively. The results are depicted as means ± SEM. ns represents non-significant results; * p < 0.05 and ** p < 0.01.
Figure 2
Figure 2
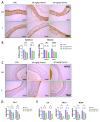
Thymol hinders cell proliferation and promotes cell apoptosis. (A) Ki67 immunostaining of ectopic lesions (n = 5); 100 µm scale bar was employed. (B) Ki67-positive cell percentage in CTRL and Thymol groups during estrus and diestrus. (C) The relative mRNA expression of Ki67 in Ishikawa cells. (D) The relative mRNA expression of Ki67, Bad, and Bcl2 in CTRL and Thymol groups during estrus and diestrus (n = 5). (E) The ratio of the relative mRNA expression of Bad/ Bcl2. (F) Ki67 immunofluorescence in Ishikawa cells. White arrowheads point to Ki67-positive cells. (G) Ki67-positive cell percentage in Ishikawa cells after thymol and/or E2 treatment. (H) Cleaved-Caspase-3 immunostaining of ectopic lesions (n = 5); 100 µm scale bar was employed. (I) Cleaved-Caspase-3-positive cell percentage in CTRL and Thymol groups during estrus and diestrus. DIE, E E2, and CTRL represent diestrus, estrus, estrogen, and control groups, respectively. The results are depicted as means ± SEM. ns represents non-significant results; * p < 0.05, ** p < 0.01, *** p < 0.001, and **** p < 0.0001.
Figure 3
Figure 3
Suppressive inflammatory effect of thymol in endometriotic tissue. (A) Relative mRNA expression of Tnfa, Ptgs2, Il1b, and Il6 in lesions of CTRL and Thymol groups (n = 5). (B) F4/80 immunofluorescence in the ectopic lesion of CTRL and Thymol groups during estrus and diestrus (n = 5); White arrowheads point to F4/80-positive cells, 25 µm scale bar was employed. (C) Ly6G immunofluorescence in the ectopic lesion of CTRL and Thymol groups during estrus and diestrus (n = 5) White arrowheads point to Ly6G-positive cells. (D) F4/80-positive cell percentage in CTRL and Thymol groups during estrus and diestrus. (E) Ly6G-positive cell percentage in CTRL and Thymol groups during estrus and diestrus; 25 µm scale bar was employed. (F) F4/80 immunofluorescence in ectopic uteri of CTRL and Thymol groups during estrus and diestrus (n = 5); White arrowheads point to F4/80-positive, 25 µm scale bar was employed. (G) Ly6G immunofluorescence in ectopic uteri of CTRL and Thymol groups during estrus and diestrus (n = 5); White arrowheads point to Ly6G-positive cells, 25 µm scale bar was employed. (H) F4/80-positive cell percentage in ectopic uteri of CTRL and Thymol groups during estrus and diestrus. (I) Ly6G-positive cell percentage in ectopic uteri of CTRL and Thymol groups during estrus and diestrus (n = 5). DIE, E, and CTRL represent diestrus, estrus, and control groups, respectively. The results are depicted as means ± SEM. ns represents non-significant results; * p < 0.05, ** p < 0.01, *** p < 0.001, and **** p < 0.0001.
Figure 4
Figure 4
Thymol interferes with estrogen signaling pathways. (A) ESR1 immunostaining of ectopic lesions (n = 5); 100 µm scale bar was employed. (B) ESR1 H-Score expression both in stromal and epithelial cells. (C) MUC1 immunostaining of ectopic lesions (n = 5); 100 µm scale bar was employed. (D) The mRNA levels of Esr1 in ectopic lesions of CTRL and thymol-treated mice (n = 5). (E) Relative expression of Muc1, Muc4, and Ltf in endometriosis lesions (n = 5). DIE, E, and CTRL represent diestrus, estrus, and control groups, respectively. The results are depicted as means ± SEM. ns represents non-significant results; * p < 0.05, ** p < 0.01, *** p < 0.001, and **** p < 0.0001.
Figure 5
Figure 5
Thymol interferes with progesterone signaling pathways. (A) PGR immunostaining of ectopic lesions (n = 5); 100 µm scale bar was employed. (B) PGR H-Score expression is present in both stromal and epithelial cells of ectopic tissue. (C) The mRNA levels of Pgr in ectopic lesions of CTRL and thymol-treated mice (n = 5). (D) Relative expression of Hand2, Hoxa10, Ihh, and Areg in endometriosis lesions (n = 5). DIE, E, and CTRL represent diestrus, estrus, and control groups, respectively. The results are depicted as means ± SEM. ns represents non-significant results; * p < 0.05, ** p < 0.01, and *** p < 0.001.
Figure 6
Figure 6
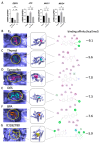
Thymol competitively bound ESR1 against estrogen. (A) The mRNA expression of ESR1 and estrogen target genes (LTF, MUC1, and MUC4) in E2-treated Ishikawa cells (n = 5). (B) Prediction of binding modes of E2 with ESR1 protein using molecular modeling. (C) Prediction of binding modes of thymol with ESR1 protein using molecular modeling. (D) Prediction of binding modes of tamoxifen with ESR1 protein using molecular modeling. (E) Prediction of binding modes of BPA with ESR1 protein using molecular modeling. (F) Prediction of binding modes of DES with ESR1 protein using molecular modeling. (G) Prediction of binding modes of ICI182780 with ESR1 protein using molecular modeling. The results are depicted as means ± SEM. ns represents non-significant results; * p < 0.05 and ** p < 0.01.
Figure 7
Figure 7
The influence of thymol on eutopic uteri in mice. (A) ESR1 immunostaining of eutopic uteri (n = 5); 100 µm scale bar was employed. (B) The mRNA levels of Esr1 in eutopic uteri of CTRL and thymol-treated mice (n = 5). (C) Relative expression of Muc1, Muc4, and Ltf in endometriosis lesions (n = 5). (D) PGR immunostaining of eutopic uteri (n = 5); 100 µm scale bar was employed. (E) The mRNA levels of Pgr in eutopic uteri of CTRL and thymol-treated mice (n = 5). (F) Relative expression of Hand2, Hoxa10, Ihh, and Areg in endometriosis lesions (n = 5). DIE, E, and CTRL represent diestrus, estrus, and control groups, respectively. The results are depicted as means ± SEM. ns represents non-significant results; * p < 0.05 and ** p < 0.01.
Figure 8
Figure 8
Thymol does not affect the fertility of mice. (A) Flow diagram of pregnancy induction and thymol treatment in mice. (B) Implantation sites of CTRL and Thymol group at 7.5 dpc; 1 cm scale bar was employed. (C) The number and the weight of implantation sites at 7.5 dpc in CTRL- and Thymol-group mice. (D) Histopathology of implantation sites at 7.5 dpc (n = 3); 100 µm scale bar was employed. (E) Relative expression of Bmp2, Wnt4, Hoxa10, Prl8a2, and Prl3c1 in implantation sites (n = 3). CTRL and Thymol represent the implantation site of control group and Thymol-treated group, respectively. The results are depicted as means ± SEM. ns represents non-significant results.

References

    1. Shafrir A.L., Farland L.V., Shah D.K., Harris H.R., Kvaskoff M., Zondervan K., Missmer S.A. Risk for and consequences of endometriosis: A critical epidemiologic review. Best Pract. Res. Clin. Obstet. Gynaecol. 2018;51:1–15. doi: 10.1016/j.bpobgyn.2018.06.001. - DOI - PubMed
    1. Stern R.C., Dash R., Bentley R.C., Snyder M.J., Haney A.F., Robboy S.J. Malignancy in endometriosis: Frequency and comparison of ovarian and extraovarian types. Int. J. Gynecol. Pathol. 2001;20:133–139. doi: 10.1097/00004347-200104000-00004. - DOI - PubMed
    1. Schindler A.E. Dienogest in long-term treatment of endometriosis. Int. J. Women’s Health. 2011;3:175–184. doi: 10.2147/IJWH.S5633. - DOI - PMC - PubMed
    1. Holoch K.J., Lessey B.A. Endometriosis and infertility. Clin. Obstet. Gynecol. 2010;53:429–438. doi: 10.1097/GRF.0b013e3181db7d71. - DOI - PubMed
    1. Sepulcri Rde P., do Amaral V.F. Depressive symptoms, anxiety, and quality of life in women with pelvic endometriosis. Eur. J. Obstet. Gynecol. Reprod. Biol. 2009;142:53–56. doi: 10.1016/j.ejogrb.2008.09.003. - DOI - PubMed