. 2024 Dec 7;25(23):13173.
doi: 10.3390/ijms252313173.

Development of an rpS6-Based Ex Vivo Assay for the Analysis of Neuronal Activity in Mouse and Human Olfactory Systems

Affiliations

Development of an rpS6-Based Ex Vivo Assay for the Analysis of Neuronal Activity in Mouse and Human Olfactory Systems

Emma Broillet-Olivier et al. Int J Mol Sci. .

Abstract

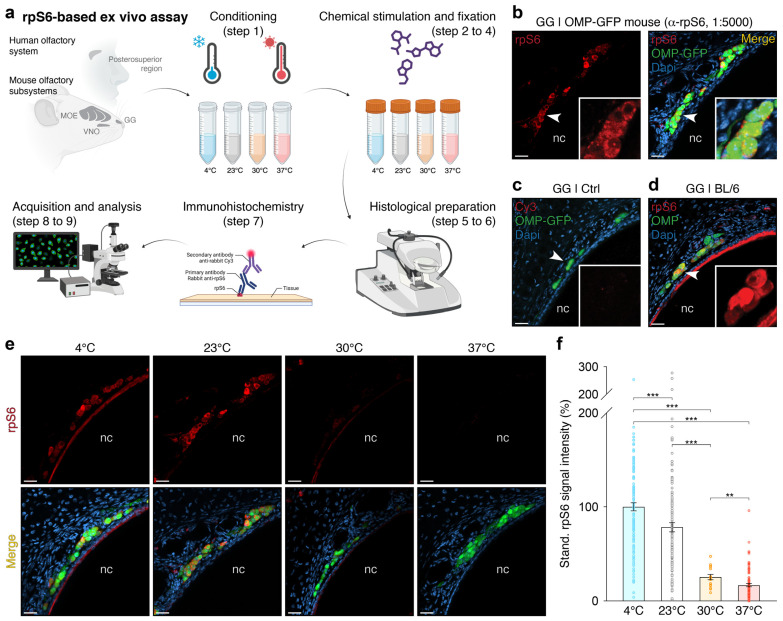
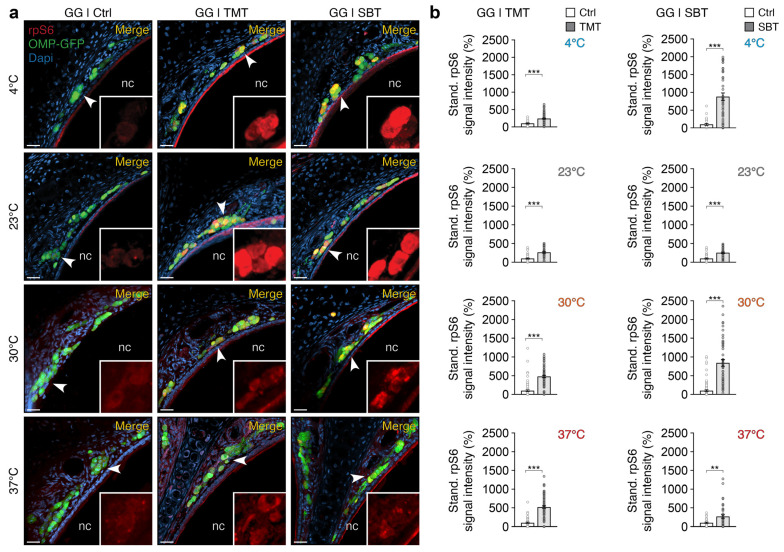
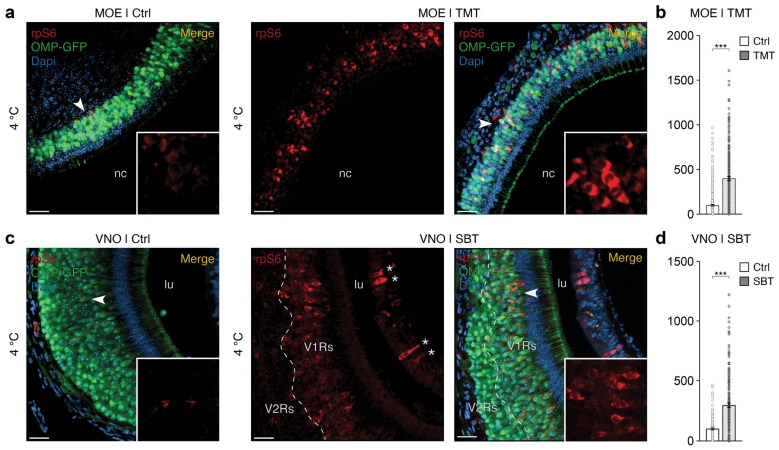
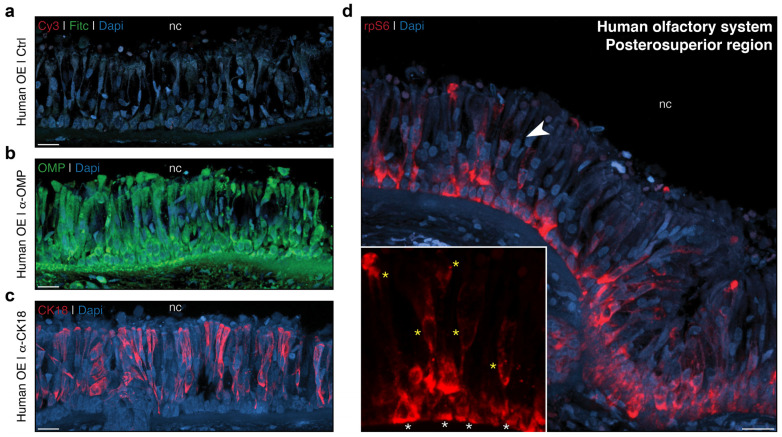
Olfactory sensitivity to odorant molecules is a complex biological function influenced by both endogenous factors, such as genetic background and physiological state, and exogenous factors, such as environmental conditions. In animals, this vital ability is mediated by olfactory sensory neurons (OSNs), which are distributed across several specialized olfactory subsystems depending on the species. Using the phosphorylation of the ribosomal protein S6 (rpS6) in OSNs following sensory stimulation, we developed an ex vivo assay allowing the simultaneous conditioning and odorant stimulation of different mouse olfactory subsystems, including the main olfactory epithelium, the vomeronasal organ, and the Grueneberg ganglion. This approach enabled us to observe odorant-induced neuronal activity within the different olfactory subsystems and to demonstrate the impact of environmental conditioning, such as temperature variations, on olfactory sensitivity, specifically in the Grueneberg ganglion. We further applied our rpS6-based assay to the human olfactory system and demonstrated its feasibility. Our findings show that analyzing rpS6 signal intensity is a robust and highly reproducible indicator of neuronal activity across various olfactory systems, while avoiding stress and some experimental limitations associated with in vivo exposure. The potential extension of this assay to other conditioning paradigms and olfactory systems, as well as its application to other animal species, including human olfactory diagnostics, is also discussed.

Keywords: 3Rs; Grueneberg ganglion; environmental factors; human; mouse; neuronal activity; olfaction; olfactory subsystems; rpS6.


Conflict of interest statement

The authors declare no conflicts of interest.

Figures

Figure 1
Figure 1
Development of an ex vivo assay based on the rpS6 signal for the assessment of neuronal activity in olfactory systems. (a) Schematic representation of the various steps involved in the ex vivo assay. Illustrations were created using BioRender.com (accessed first on 30 November 2022). (b) Left panel: representative immunostaining showing the rpS6 signal obtained with the anti-rpS6 antibody (α-rpS6, 1:5000, in red) from the Grueneberg ganglion (GG) of an OMP-GFP mouse, where GG neurons (in green) are visualized based on their endogenous GFP expression. Right panel: the merged view with a nuclear Dapi counterstain (in blue) is shown. (c) Negative control performed without the α-rpS6 (Cy3 signal in red). (d) Merged view of a double immunohistochemical analysis for rpS6 (α-rpS6, in red) and the OMP protein (α-OMP, in green) in a BL/6 mouse. (e,f) Assessment of the temperature effect on the rpS6 signal in the GG. Representative immunohistochemical investigations, performed on OMP-GFP mice, are illustrated in (e) at different temperatures (4 °C, 23 °C, 30 °C, and 37 °C), and the statistical analysis is shown in (f) for both OMP-GFP and BL/6 mice. Nasal cavities are indicated (nc; be). White arrowheads indicate the zoom-in regions (b) or the rpS6-related signal zoom-in regions (c,d). Scale bars: 20 µm (be). Data are expressed as a standardized percentage of the rpS6 signal intensity and represented as the mean ± SEM with aligned dot plots for a minimum of three GG sections per animal, from at least two mice per condition. Comparisons between conditions were performed using two-tailed Welch’s t-tests or Mann–Whitney U-tests, ** p < 0.01, *** p < 0.001.
Figure 2
Figure 2
Odorant-induced increases of the rpS6 signal in the GG at different conditioning temperatures. (a) Representative immunostaining for the rpS6 signal (in red) in the GG of OMP-GFP mice (OMP-GFP signal, in green) following conditioning at different temperatures (4 °C, 23 °C, 30 °C, and 37 °C) and odorant stimulations, with ACSF serving as the reference control (Ctrl), TMT, or SBT. The merged images include nuclear Dapi staining (in blue). (b) The statistical analysis comparing the effects of odorant stimulations calibrated at different conditioning temperatures is displayed. Stimulations with the Ctrl and odorants (TMT in left panels and SBT in right panels) are represented by white and gray bars, respectively. Nasal cavities (nc) are indicated in (a). White arrowheads highlight zoomed-in regions of the rpS6 signal (a). Scale bars: 20 μm (a). Data are presented as a standardized percentage of the rpS6 signal intensity, with the means ± SEM displayed using aligned dot plots. A minimum of three GG sections per animal from at least two mice per condition were analyzed. Comparisons between conditions were performed using two-tailed Mann–Whitney U-tests, ** p < 0.01, *** p < 0.001.
Figure 3
Figure 3
Investigation of rpS6-based odorant signals in the MOE and VNO of mice. (a) Here, representative immunostaining for the rpS6 signal (in red) in the MOE of OMP-GFP mice (OMP-GFP signal, in green) under non-stimulated control conditions (Ctrl, left panel) and after TMT stimulation (TMT, right panels) are shown here for a conditioning temperature of 4 °C. (b) Statistical analysis comparing the effects of TMT stimulations on GFP-positive OSNs in the MOE. Data were combined across the conditioning temperatures of 4 °C and 23 °C. (c) Here, representative immunostaining for the rpS6 signal (in red) in the VNO of OMP-GFP mice under non-stimulated conditions (Ctrl, left panel) and after SBT stimulation (SBT, right panels), are shown for the same conditioning temperature of 4 °C. The approximate boundaries between the vomeronasal type-1 receptor (V1R) and vomeronasal type-2 receptor (V2R) layers are marked with a white dashed line. Non-sensory GFP-negative cells expressing the rpS6 signal are indicated by white asterisks. (d) Statistical analysis comparing the effects of SBT stimulations on GFP-positive OSNs in the VNO. Data were combined across the conditioning temperatures of 4 °C and 23 °C. Nasal cavities (nc) in the MOE (a) and lumen (lu) in the VNO (c) are annotated. White arrowheads highlight regions where the rpS6 signal is zoomed in (a,c). Scale bars: 20 μm (a,c). Merged images include nuclear Dapi staining (in blue, (a,c)). Stimulations with the Ctrl and odorants are represented by white and gray bars, respectively (in (b,d)). A minimum of four tissue sections per animal from at least three mice per condition were analyzed. Comparisons between conditions were performed using two-tailed Mann–Whitney U-tests, *** p < 0.001.
Figure 4
Figure 4
Investigation of rpS6-based signals in the posterosuperior region of the human olfactory system. (a) Negative control performed on the posterosuperior region of the human olfactory epithelium (OE) without primary antibodies, illustrating the endogenous signals related to Cy3 (in red) and FITC (in green). (b) Representative immunostaining showing the α-OMP antibody signal (in green) in the human OE and its apparent lack of neuronal specificity. (c) Representative immunostaining for the α-CK18 antibody signal (in red) performed in the same region, highlighting its specificity for the sustentacular supporting cells of the olfactory epithelium. (d) Labeling for the rpS6 signals (in red) in the posterosuperior region of the human OE. Nasal cavities (nc, (ad)) are indicated. The white arrowhead highlights a zoomed-in region of the rpS6 signals, within which white and yellow asterisks indicate basal cells and sporadic cells of the sensory epithelium, respectively (d). Scale bars: 10 μm (ad). Dapi staining is used as a nuclear marker (in blue, (ad)).

Similar articles

Cited by

References

    1. Firestein S. How the olfactory system makes sense of scents. Nature. 2001;413:211–218. doi: 10.1038/35093026. - DOI - PubMed
    1. Munger S.D., Leinders-Zufall T., Zufall F. Subsystem organization of the mammalian sense of smell. Annu. Rev. Physiol. 2009;71:115–140. doi: 10.1146/annurev.physiol.70.113006.100608. - DOI - PubMed
    1. Brechbühl J., de Valliere A., Wood D., Nenniger Tosato M., Broillet M.C. The Grueneberg ganglion controls odor-driven food choices in mice under threat. Commun. Biol. 2020;3:533. doi: 10.1038/s42003-020-01257-w. - DOI - PMC - PubMed
    1. Ma M. Odor and pheromone sensing via chemoreceptors. Adv. Exp. Med. Biol. 2012;739:93–106. doi: 10.1007/978-1-4614-1704-0_6. - DOI - PubMed
    1. Touhara K., Vosshall L.B. Sensing odorants and pheromones with chemosensory receptors. Annu. Rev. Physiol. 2009;71:307–332. doi: 10.1146/annurev.physiol.010908.163209. - DOI - PubMed

Substances

LinkOut - more resources