

Relationship Between Metabolic Profile, Pain, and Functionality in Patients with Frozen Shoulder: A Cross-Sectional Study
- PMID: 39685066
- PMCID: PMC11641732
- DOI: 10.3390/healthcare12232444
Relationship Between Metabolic Profile, Pain, and Functionality in Patients with Frozen Shoulder: A Cross-Sectional Study
Abstract
Background: Frozen shoulder (FS), or adhesive capsulitis, is a disabling condition characterized by pain and restricted shoulder mobility.
Aims: This study investigates the relationship between metabolic biomarkers-liver enzymes and thyroid function-and pain and shoulder functionality in patients with FS.
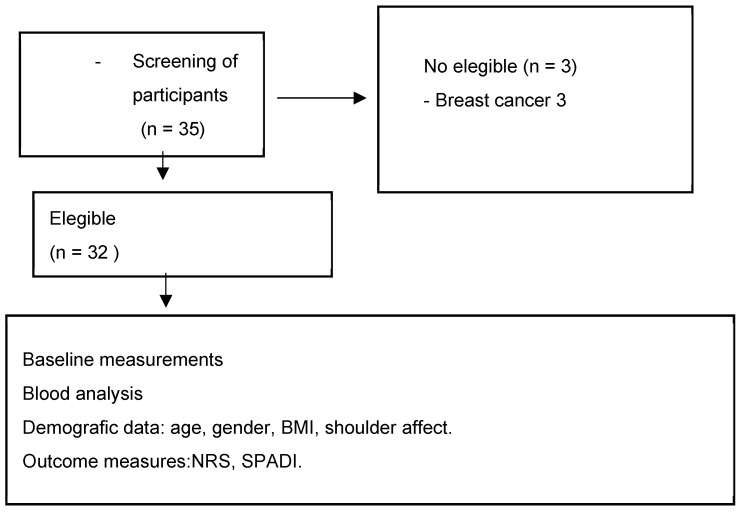
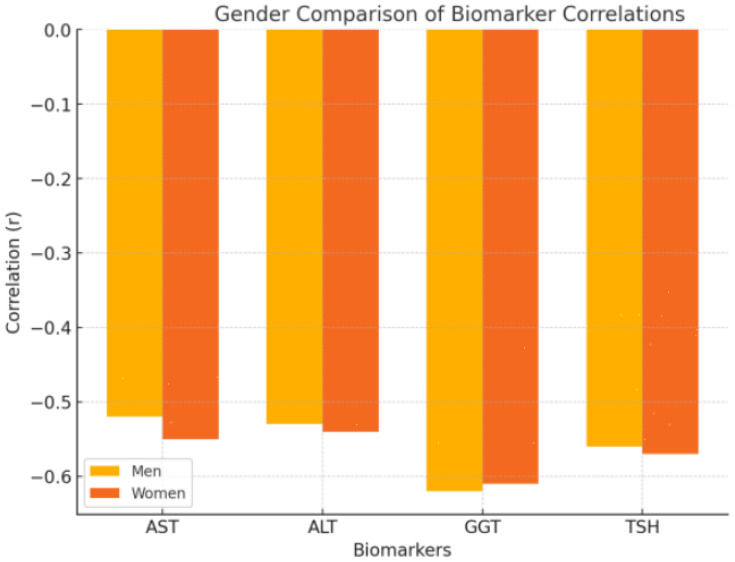
Methods: A total of 32 patients (22 women and 10 men) were included in this cross-sectional study. Participants underwent clinical evaluations and blood tests to assess metabolic biomarkers, including aspartate aminotransferase (AST), alanine aminotransferase (ALT), gamma-glutamyl transferase (GGT), and thyroid-stimulating hormone (TSH). Pain and functionality were measured using the Shoulder Pain and Disability Index (SPADI). Correlation and multiple regression analyses were performed to assess the associations between biomarkers, pain, and functionality.
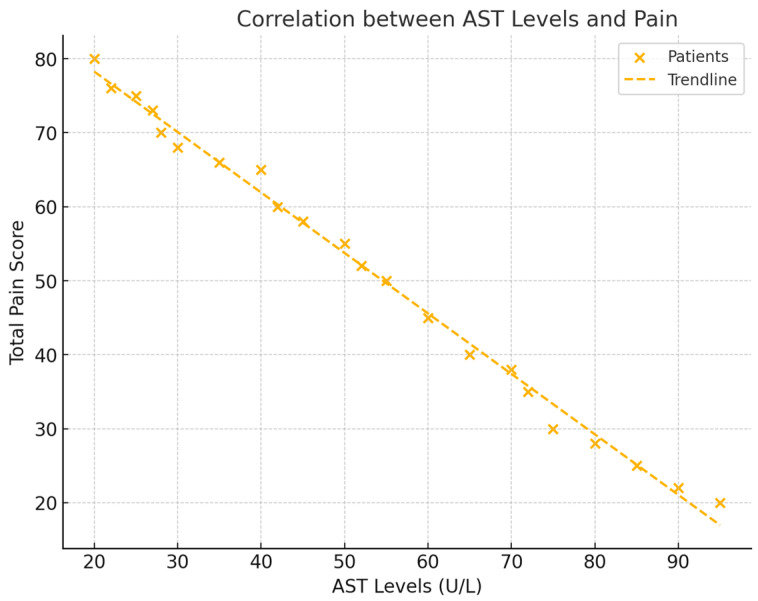
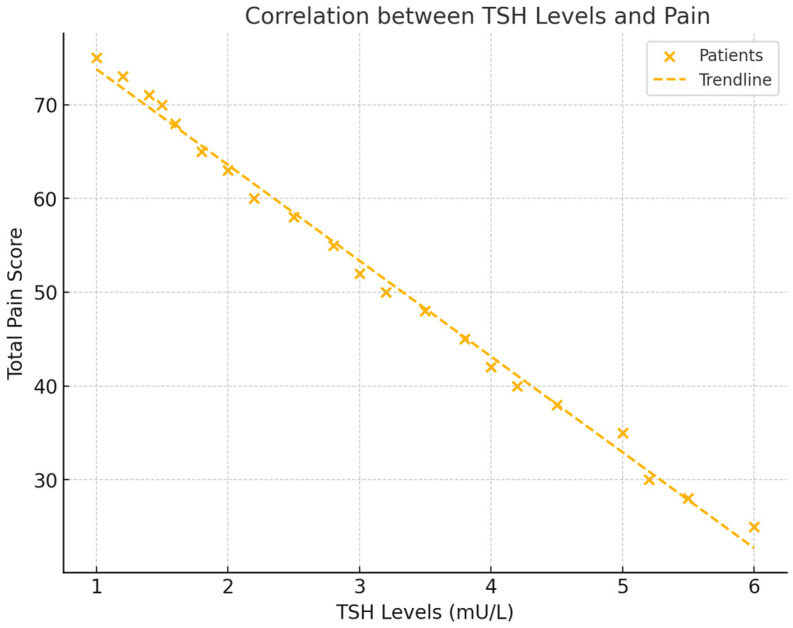
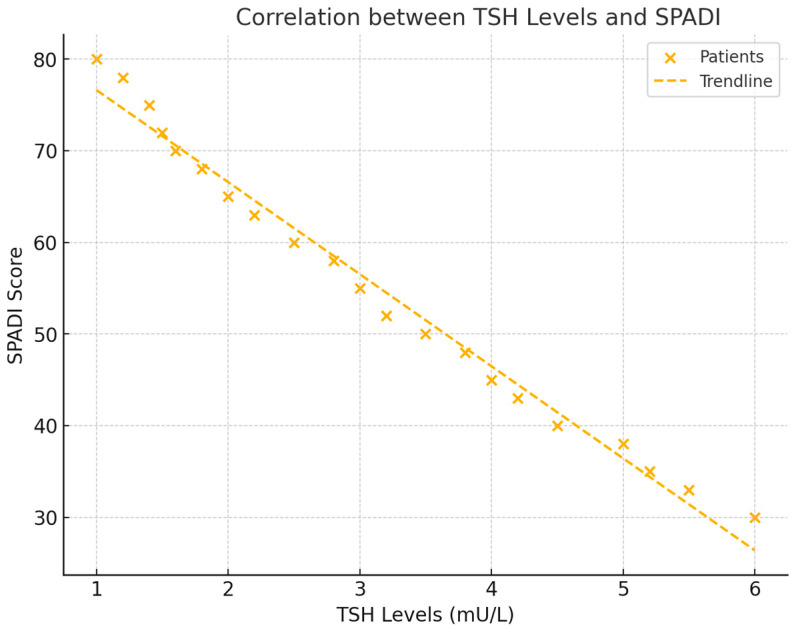
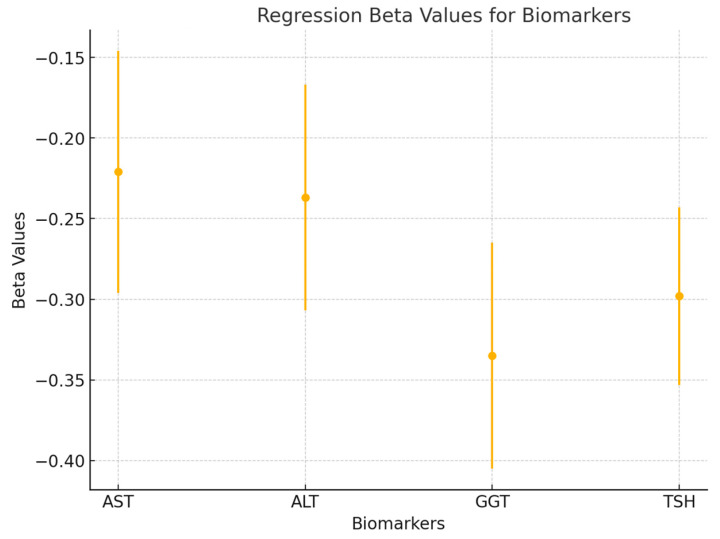
Results: Significant negative correlations were found between AST (r = -0.528, p = 0.029), ALT (r = -0.533, p = 0.027), GGT (r = -0.602, p = 0.011), and TSH (r = -0.556, p = 0.017) with total pain scores. A significant negative correlation was also observed between TSH and SPADI scores (r = -0.511, p = 0.039). Multiple regression analysis showed that GGT (β = -0.335, p = 0.008) and TSH (β = -0.298, p = 0.014) were the strongest predictors of pain. These findings suggest that metabolic biomarkers, particularly liver enzymes and thyroid function, play a significant role in the pathophysiology of frozen shoulder. The results highlight the importance of assessing these biomarkers for better understanding and managing pain and functionality in patients with FS.
Conclusions: Further research is needed to explore the underlying mechanisms and potential therapeutic targets.
Keywords: biomarkers; frozen shoulder; functionality; metabolism; pain.
Conflict of interest statement
The authors declare no conflicts of interest.
Figures
Similar articles
-
Does Leptin and Insulin Levels Influence Pain and Disability in Subjects With Frozen Shoulder? A Cross-Sectional Study.Eur J Pain. 2025 Apr;29(4):e70007. doi: 10.1002/ejp.70007. Eur J Pain. 2025. PMID: 40067138
-
Circulating alanine transaminase (ALT) and γ-glutamyl transferase (GGT), but not fetuin-A, are associated with metabolic risk factors, at baseline and at two-year follow-up: the prospective Cyprus Metabolism Study.Metabolism. 2014 Jun;63(6):773-82. doi: 10.1016/j.metabol.2014.03.008. Epub 2014 Mar 15. Metabolism. 2014. PMID: 24726813 Free PMC article.
-
Comparing the Efficacy of Intra-articular Platelet-Rich Plasma and Corticosteroid Injections in the Management of Frozen Shoulder: A Randomized Controlled Trial.Cureus. 2023 May 30;15(5):e39728. doi: 10.7759/cureus.39728. eCollection 2023 May. Cureus. 2023. PMID: 37398735 Free PMC article.
-
The Effect of Intra-articular Injection of Hyaluronic Acid in Frozen Shoulder: a Systematic Review and Meta-analysis of Randomized Controlled Trials.J Orthop Surg Res. 2022 Mar 3;17(1):128. doi: 10.1186/s13018-022-03017-4. J Orthop Surg Res. 2022. PMID: 35241100 Free PMC article.
-
Research trends and emerging treatment in frozen shoulder research: A bibliometric analysis and meta-analysis.Asian J Surg. 2024 Nov 11:S1015-9584(24)02421-7. doi: 10.1016/j.asjsur.2024.10.148. Online ahead of print. Asian J Surg. 2024. PMID: 39532642 Review.
Cited by
-
Influence of the metabolic and inflammatory profile in patients with frozen shoulder - systematic review and meta-analysis.BMC Musculoskelet Disord. 2025 May 15;26(1):475. doi: 10.1186/s12891-025-08706-9. BMC Musculoskelet Disord. 2025. PMID: 40375116 Free PMC article.
References
LinkOut - more resources
Full Text Sources
Research Materials
Miscellaneous
