

A Hybrid Photoplethysmography (PPG) Sensor System Design for Heart Rate Monitoring
- PMID: 39686169
- PMCID: PMC11644845
- DOI: 10.3390/s24237634
A Hybrid Photoplethysmography (PPG) Sensor System Design for Heart Rate Monitoring
Abstract
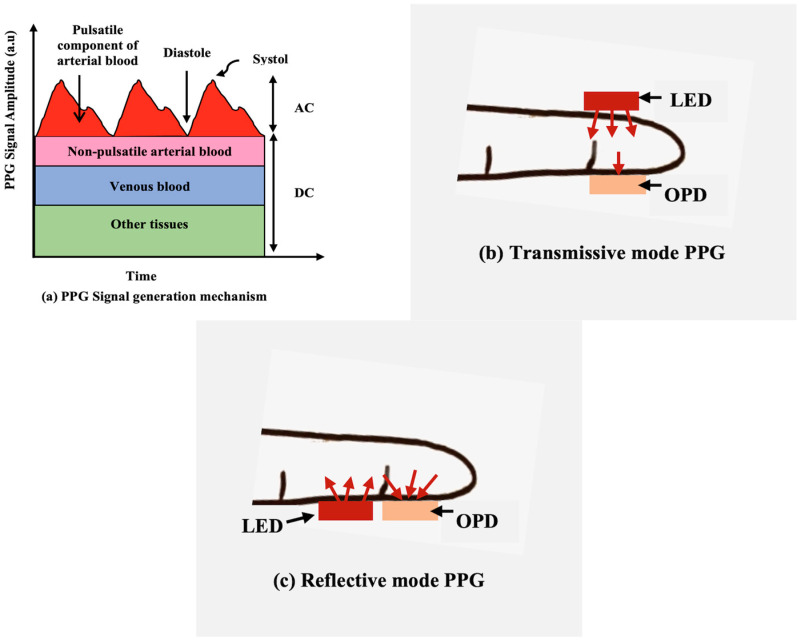
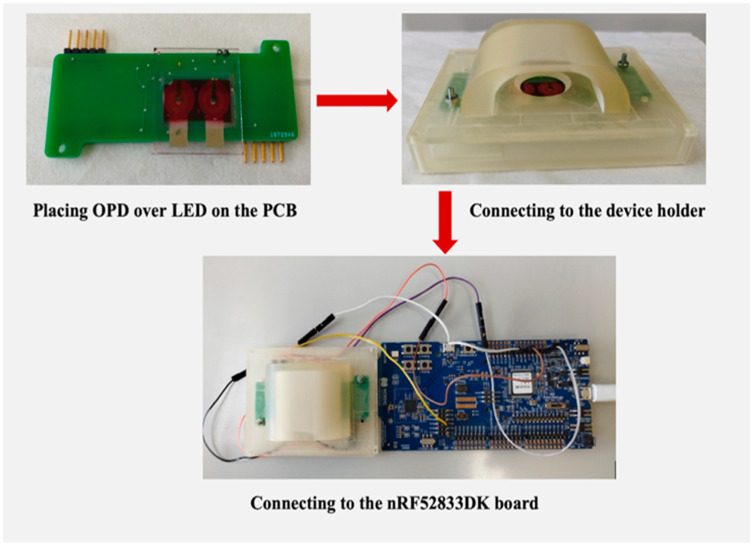
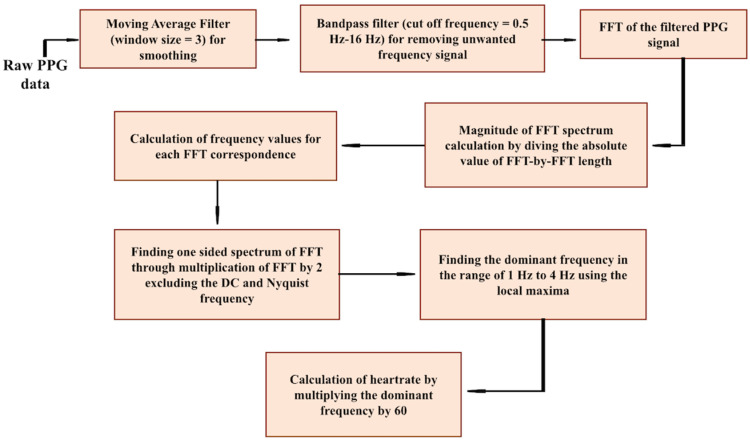
A photoplethysmography (PPG) sensor is a cost-effective and efficacious way of measuring health conditions such as heart rate, oxygen saturation, and respiration rate. In this work, we present a hybrid PPG sensor system working in a reflective mode with an optoelectronic module, i.e., the combination of an inorganic light-emitting diode (LED) and a circular-shaped organic photodetector (OPD) surrounding the LED for efficient light harvest followed by the proper driving circuit for accurate PPG signal acquisition. The performance of the hybrid sensor system was confirmed by the heart rate detection process from the PPG using fast Fourier transform analysis. The PPG signal obtained with a 50% LED duty cycle and 250 Hz sampling rate resulted in accurate heart rate monitoring with an acceptable range of error. The effects of the LED duty cycle and the LED luminous intensity were found to be crucial to the heart rate accuracy and to the power consumption, i.e., indispensable factors for the hybrid sensor.
Keywords: LED duty cycle; LED luminous intensity; heart rate; light-emitting diode (LED); organic photodetector (OPD); photoplethysmography (PPG).
Conflict of interest statement
Authors Kentaro Harada, Hin-Wai Mo and Hiroshi Fujimoto were employed by the company OPERA Solutions Inc. The remaining authors declare that the research was conducted in the absence of any commercial or financial relationships that could be construed as a potential conflict of interest.
Figures


References
-
- Tarassenko L., Clifton D.A. Semiconductor wireless technology for chronic disease management. Electron. Lett. 2011;47:30–32. doi: 10.1049/el.2011.2679. - DOI
-
- Mohan P.M., Nisha A.A., Nagarajan V., Jothi E.S.J. Measurement of Arterial Oxygen Saturation (SpO2) using PPG Optical Sensor; Proceedings of the 2016 International Conference on Communication and Signal Processing (ICCSP); Melmaruvathur, India. 6–8 April 2016; pp. p.1136–1140.
-
- Bhowmik T., Dey J., Tiwari V.N. A Novel Method for Accurate Estimation of HRV from Smartwatch PPG Signals; Proceedings of the 2017 39th Annual International Conference of the IEEE Engineering in Medicine and Biology Society (EMBC); Jeju, Republic of Korea. 11–15 July 2017; pp. 109–112. - PubMed
MeSH terms
LinkOut - more resources
Full Text Sources
