. 2024 Nov 29;24(23):7656.
doi: 10.3390/s24237656.

Low-Cost Sensor Network for Air Quality Assessment in Cabo Verde Islands

Affiliations

Low-Cost Sensor Network for Air Quality Assessment in Cabo Verde Islands

Anedito Zico da Costa et al. Sensors (Basel). .

Abstract

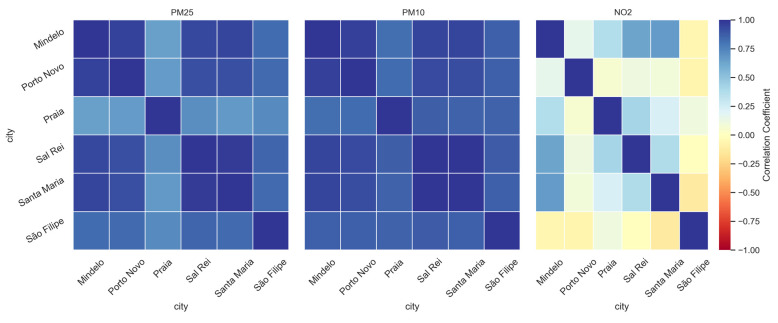
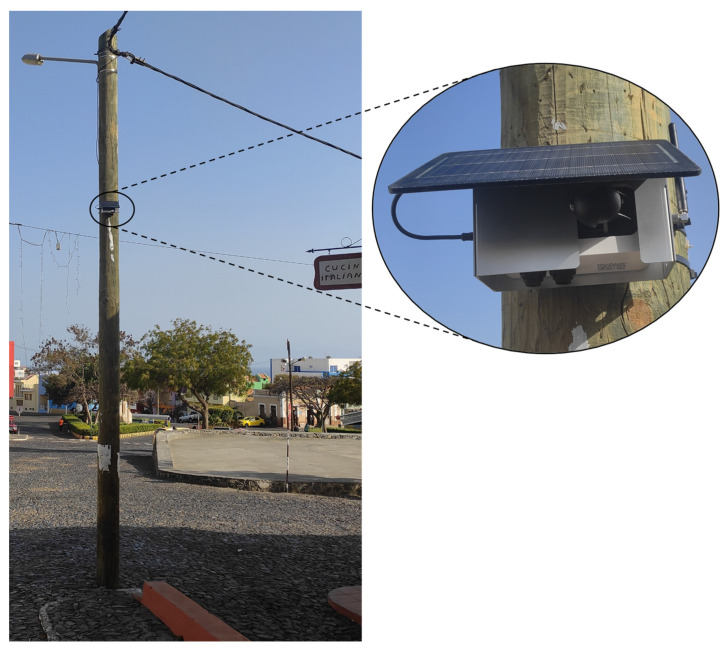
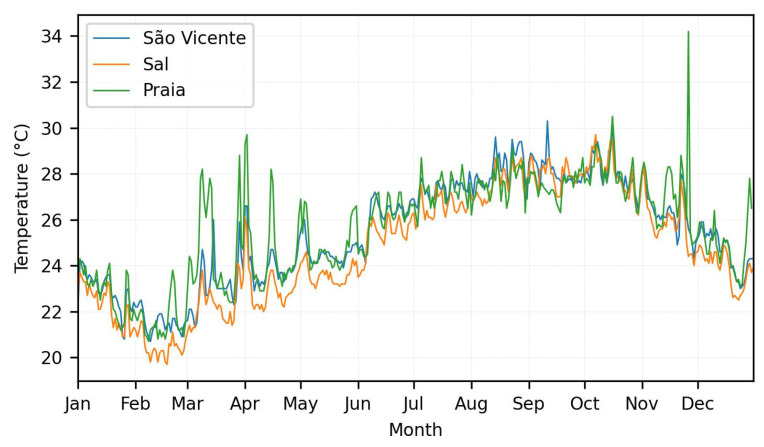
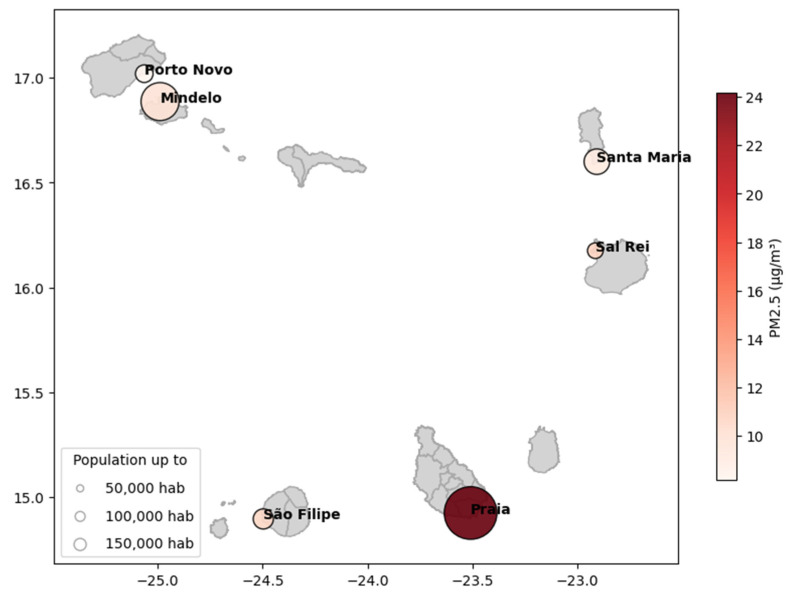
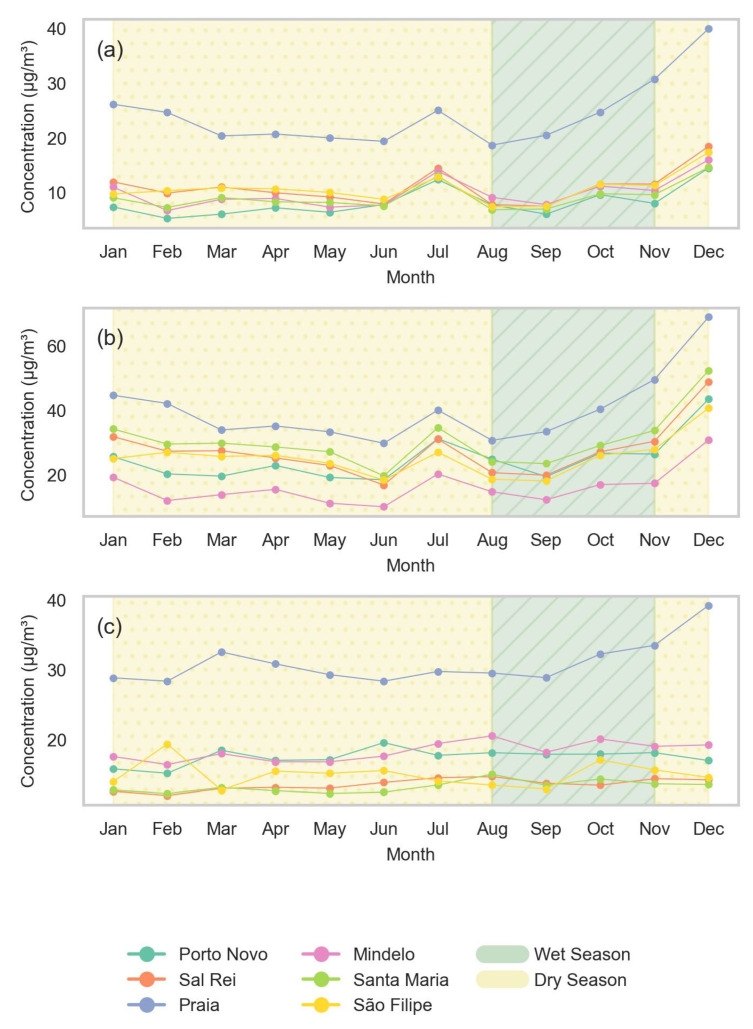
This study explores the application of low-cost sensor networks for air quality monitoring in Cabo Verde islands, utilizing Clarity Node-S sensors to measure fine particulate matter with diameters equal to or smaller than 10 µm (PM10) and 2.5 µm (PM2.5) and nitrogen dioxide (NO2) gasses, across various locations. The sensors were strategically placed and calibrated to ensure coverage of the whole archipelago and accurate data collection. The results consistently revealed seasonal patterns of dust variation across the archipelago, with concentrations of particulate matter exceeding World Health Organization (WHO) limits in all regions. However, Praia frequently exhibits the highest levels of air pollution, exceeding a 200 µg/m3 daily average, particularly during the dry season. Seasonal variations indicated that pollutants are significantly higher from November to March due to Saharan dust flux (a phenomenon locally know as Bruma Seca). Other cities showed more stable and lower pollutant concentrations. This study highlights the potential of low-cost sensors to provide extensive and real-time air quality data, enabling better environmental assessment and policy formulation. However, the variability in equipment accuracy and the limited geographical coverage remain the main limitations to be overcome. Future research should focus on these issues, and a sensor network integrated with reference methods could be a great asset to enhance data accuracy and improve outcomes of air quality monitoring in the country.

Keywords: Cabo Verde; NO2; PM10; PM2.5; air pollution; air quality; low-cost sensors.


Conflict of interest statement

The authors declare no conflicts of interest.

Figures

Figure A1
Figure A1
Correlation heatmaps of daily average pollutant concentrations between different cities in Cabo Verde for the year 2023. The correlation values are calculated based on daily average pollutant levels, showing the relationship between cities.
Figure A2
Figure A2
Boxplots of (a) PM2.5, (b) PM10, and (c) NO2 concentrations in study cities for dry and wet seasons in 2023. The yellow boxes represent the dry season, while the green boxes represent the wet season. The plots illustrate seasonal variability in pollutant levels, highlighting the differences between dry and wet conditions for each location.
Figure 1
Figure 1
A map of the location of the Cabo Verde in relation to the African continent (left map) and a detailed map of the islands (right). The shades of green represent the population across the islands and red dots indicate the locations of air quality sensors.
Figure 2
Figure 2
Clarity Node-S sensor installed in São Filipe city, on Fogo Island.
Figure 3
Figure 3
Daily average temperature in 2023 for Mindelo, Santa Maria, and Praia.
Figure 4
Figure 4
Total monthly precipitation (in mm) in Santiago, Fogo, and Santo Antão islands throughout the year of 2023.
Figure 5
Figure 5
Wind roses for the cities of (a) Mindelo at São Vicente island; (b) Santa Maria at Sal island; and (c) Praia at Santiago island, showing the distribution of wind direction and wind speed in 2023. The wind rose represents the frequency, in percentage, of each wind direction, providing insight into the predominant wind patterns in each island.
Figure 6
Figure 6
Pollution roses of PM2.5, PM10, and NO2 in Mindelo, Praia, and Santa Maria. Each pollution rose shows the frequency of pollutant concentrations by wind direction, with color bands representing different concentration levels.
Figure 7
Figure 7
A map of the spatial distribution of the average annual PM2.5 concentrations across the studied cities in Cabo Verde for 2023. The size of each marker represents the population size. The color gradient indicates the PM2.5 concentration.
Figure 8
Figure 8
Boxplots of pollutant concentration for different cities in Cabo Verde in 2023: (a) PM2.5, (b) PM10, and (c) NO2. The box represents the interquartile range (the middle 50% of the data) with a line at the median. The horizontal lines below and above the box represent the minimum and maximum values within 1.5 times the interquartile range, and the points represent the outliers.
Figure 9
Figure 9
Variation of daily average concentrations of air pollutants compared to WHO global air quality guideline levels (AQG; red dashed line) by location over 2023: (a) PM2.5, (b) PM10, and (c) NO2.
Figure 10
Figure 10
The monthly average concentrations of air pollutants in different locations in Cabo Verde throughout the year 2023: (a) PM2.5, (b) PM10, and (c) NO2. The shaded areas represent the dry and wet seasons.
Figure 11
Figure 11
Daily and weekly variations in air pollutant concentrations (PM2.5, PM10, and NO2) for all study locations in 2023. Left column: average hourly variations. Right column: average weekly variations.

References

    1. Borrego C., Ginja J., Coutinho M., Ribeiro C., Karatzas K., Sioumis T., Katsifarakis N., Konstantinidis K., De Vito S., Esposito E., et al. Assessment of Air Quality Microsensors versus Reference Methods: The EuNetAir Joint Exercise—Part II. Atmos. Environ. 2018;193:127–142. doi: 10.1016/j.atmosenv.2018.08.028. - DOI
    1. Freire S.M., Relvas H., Lopes M. Impact of Traffic Emissions on Air Quality in Cabo Verde. Environ. Monit. Assess. 2020;192:726. doi: 10.1007/s10661-020-08690-8. - DOI - PubMed
    1. Dhital S., Kaplan M.L., Orza J.A.G., Fiedler S. Atmospheric Dynamics of a Saharan Dust Outbreak Over Mindelo, Cape Verde Islands, Preceded by Rossby Wave Breaking: Multiscale Observational Analyses and Simulations. J. Geophys. Res. Atmos. 2020;125:e2020JD032975. doi: 10.1029/2020JD032975. - DOI
    1. Cardoso J. Ph.D. Thesis. University of Aveiro; Aveiro, Portugal: 2016. Estudo Do Aerossol (Poeira Do Sara) Na Região de Cabo Verde.
    1. Basith S., Manavalan B., Shin T.H., Park C.B., Lee W.S., Kim J., Lee G. The Impact of Fine Particulate Matter 2.5 on the Cardiovascular System: A Review of the Invisible Killer. Nanomaterials. 2022;12:2656. doi: 10.3390/nano12152656. - DOI - PMC - PubMed

LinkOut - more resources