. 2024 Dec 7;24(23):7827.
doi: 10.3390/s24237827.

Sensor-Based Frailty Assessment Using Fitbit

Affiliations

Sensor-Based Frailty Assessment Using Fitbit

Mohammad Hosseinalizadeh et al. Sensors (Basel). .

Abstract

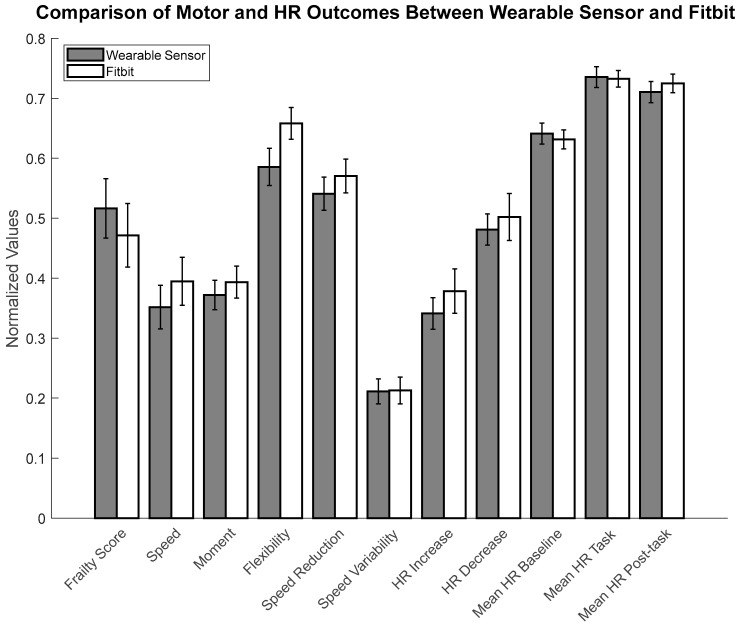
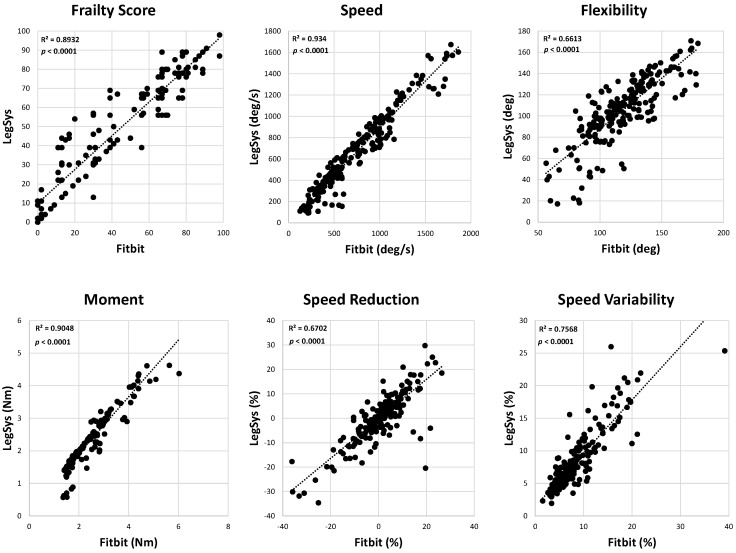
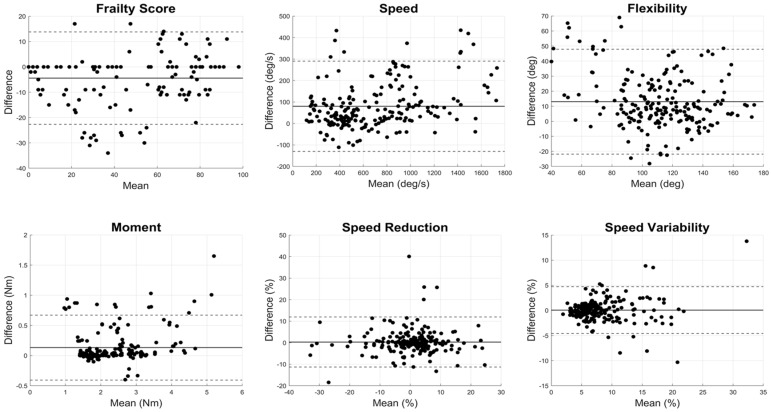
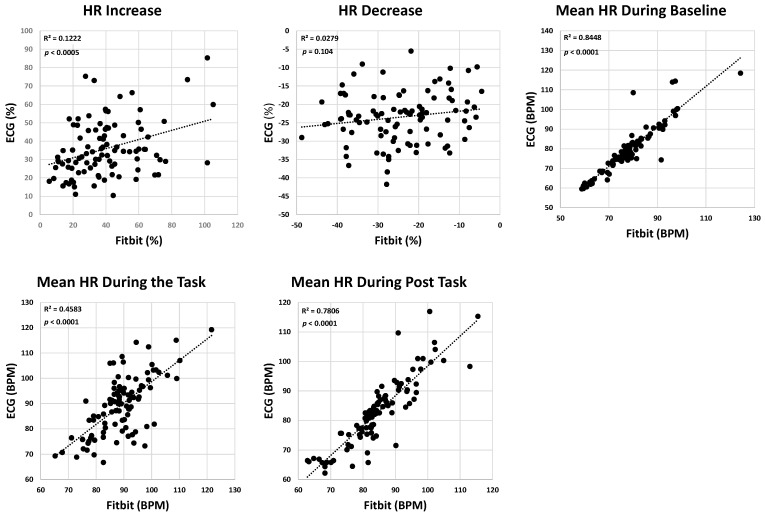
This study evaluated the reliability of Fitbit in assessing frailty based on motor and heart rate (HR) parameters through a validated upper extremity function (UEF) test, which involves 20 s of rapid elbow flexion. For motor performance, participants completed six trials of full elbow flexion using their right arm, with and without weight. Fitbit and a commercial motion sensor were worn on the right arm. For HR measurements, an ECG system was placed on the left chest alongside the Fitbit on the left wrist. Motor parameters assessing speed, flexibility, weakness, exhaustion, and HR before, during, and after UEF were measured. A total of 42 participants (age = 22 ± 3) were recruited. For motor parameters, excellent agreement was observed between the wearable sensor and Fitbit, except for flexibility (ICC = 0.87 ± 0.09). For HR parameters, ICC values showed weak agreement between ECG and Fitbit for HR increase and recovery (ICC = 0.24 ± 0.11), while moderate to stronger agreement was seen for mean HR during baseline, task, and post-task (ICC = 0.81 ± 0.13). Fitbit is a reliable tool for assessing frailty through motor parameters and provides reasonably accurate HR estimates during baseline, task, and recovery periods. However, Fitbit's ability to track rapid HR changes during activity is limited.

Keywords: Fitbit smartwatch; frailty assessment; heart rate (HR) monitoring; motor performance; wearable sensor.


Conflict of interest statement

The authors declare no conflicts of interest.

Figures

Figure 1
Figure 1
The UEF test setup schematic with IMU, ECG, and smartwatch sensors for motor and HR monitoring.
Figure 2
Figure 2
Comparison of motor and HR outcomes between the wearable sensor and Fitbit. All values were normalized to the maximum recorded value for each outcome. Error bars represent the normalized standard error for each outcome.
Figure 3
Figure 3
Correlation plots between Fitbit and commercial wearable motion sensor for motor parameters, including frailty score, speed, flexibility, moment, speed reduction, and speed variability. Each subplot includes the p-value and R2-value for the linear Pearson correlation between the devices.
Figure 4
Figure 4
Bland–Altman plots for motor parameters comparing Fitbit and a commercial wearable motion sensor, including frailty score, speed, flexibility, moment, speed reduction, and speed variability. Each subplot displays the mean difference and limits of agreement between the two systems. The x-axis represents the mean value of the two measurements (wearable sensor and Fitbit) for each parameter, while the y-axis shows the difference between Fitbit and wearable sensor values Solid lines indicate the mean differences, and dashed lines represent the limits of agreement (mean difference ± 1.96 standard deviations).
Figure 5
Figure 5
Correlation plots between the ECG system and Fitbit for HR parameters, including HR increase, HR decrease, mean HR during baseline, mean HR during the task, and mean HR during post-task. Each subplot includes the p-value and R2-value to assess the linear Pearson correlation between the devices.
Figure 6
Figure 6
Bland–Altman plots for HR parameters comparing ECG and Fitbit systems, including HR increase, HR decrease, mean HR baseline, mean HR task, and mean HR post-task. Each subplot displays the mean difference and limits of agreement between the two systems. The x-axis represents the mean value of the two measurements (ECG and Fitbit) for each parameter, while the y-axis shows the difference between Fitbit and ECG system. Solid lines indicate the mean differences, and dashed lines represent the limits of agreement (mean difference ± 1.96 standard deviations).

References

    1. Lp F. Frailty in older adults: Evidence for a phenotype. J. Gerontol. A Biol. Sci. Med. Sci. 2001;56:M146–M156. - PubMed
    1. Rockwood K., Andrew M., Mitnitski A. A Comparison of two approaches to measuring frailty in elderly people. J. Gerontol. Ser. A Biol. Sci. Med. Sci. 2007;62:738–743. doi: 10.1093/gerona/62.7.738. - DOI - PubMed
    1. Toosizadeh N., Ehsani H., Parthasarathy S., Carpenter B., Ruberto K., Mohler J., Parvaneh S. Frailty and heart response to physical activity. Arch. Gerontol. Geriatr. 2021;93:104323. doi: 10.1016/j.archger.2020.104323. - DOI - PubMed
    1. Toosizadeh N., Eskandari M., Ehsani H., Parvaneh S., Asghari M., Sweitzer N. Frailty assessment using a novel approach based on combined motor and cardiac functions: A pilot study. BMC Geriatr. 2022;22:199. doi: 10.1186/s12877-022-02849-3. - DOI - PMC - PubMed
    1. McRae P.J., Walker P.J., Peel N.M., Hobson D., Parsonson F., Donovan P., Reade M.C., Marquart L., Mudge A.M. Frailty and geriatric syndromes in vascular surgical ward patients. Ann. Vasc. Surg. 2016;35:9–18. doi: 10.1016/j.avsg.2016.01.033. - DOI - PubMed

LinkOut - more resources