. 2025 Feb;12(6):e2409883.
doi: 10.1002/advs.202409883. Epub 2024 Dec 16.

Dietary Palmitic Acid Drives a Palmitoyltransferase ZDHHC15-YAP Feedback Loop Promoting Tumor Metastasis

Affiliations

Dietary Palmitic Acid Drives a Palmitoyltransferase ZDHHC15-YAP Feedback Loop Promoting Tumor Metastasis

Jianxin Wang et al. Adv Sci (Weinh). 2025 Feb.

Abstract

Elevated uptake of saturated fatty acid palmitic acid (PA) is associated with tumor metastasis; however, the precise mechanisms remain partially understood, hindering the development of therapy for PA-driven tumor metastasis. The Hippo-Yes-associated protein (Hippo/YAP) pathway is implicated in cancer progression. Here it is shown that a high-palm oil diet potentiates tumor metastasis in murine xenografts in part through YAP. It is found that the palmitoyltransferase ZDHHC15 is a YAP-regulated gene that forms a feedback loop with YAP. Notably, PA drives the ZDHHC15-YAP feedback loop, thus enforces YAP signaling, and hence promotes tumor metastasis in murine xenografts. In addition, it is shown that ZDHHC15 associates with Kidney and brain protein (KIBRA, also known as WW- and C2 domain-containing protein 1, WWC1), an upstream component of Hippo signaling, and mediates its palmitoylation. KIBRA palmitoylation leads to its degradation and regulates its subcellular localization and activity toward the Hippo/YAP pathway. Moreover, PA enhances KIBRA palmitoylation and degradation. It is further shown that combinatorial targeting of YAP and fatty acid synthesis exhibits augmented effects against metastasis formation in mice fed with a Palm diet. Collectively, these findings uncover a ZDHHC15-YAP feedback loop as a previously unrecognized mechanism underlying PA-promoted tumor metastasis and support targeting YAP and fatty acid synthesis as potential therapeutic targets in PA-driven tumor metastasis.

Keywords: S‐palmitoylations; YAP; ZDHHC15; palmitic acids; tumor metastasis.


Conflict of interest statement

The authors declare no conflict of interest.

Figures
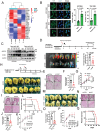
Figure 1
Figure 1
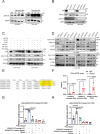
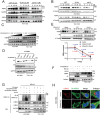
Palmitic acid promotes cancer metastasis in part through YAP signaling. A) GO analysis conducted on differentially expressed genes in TOV‐112D cells treated with palmitic acid (100 µm, 24 h) or BSA control. B) Immunofluorescence staining of YAP (green) on HCC1954 and TOV‐112D cells treated with palmitic acid of 100 µm for 24 h. Nuclear staining was achieved using DAPI (blue). Scale bars represent 25 µm. C) HCC1954 and TOV‐112D cells were treated with various concentrations of palmitic acid. Immunoblotting analysis was performed to examine the expression levels of AMOTL2 and CYR61. Representative results were obtained from at least three independent experiments with similar results. D) Experimental protocol for YAP‐depleted MDA‐MB‐231 cells to promote tumor metastasis in an orthotopic transplantation model. Shown are images and BLI quantification of lung metastasis (n = 5 mice in each group). E) Representative images of H&E staining (n = 5 mice in each group). F, G) The number of lung metastatic nodules (F) and G) weight was counted and statistically analyzed, (n = 5 mice in each group). H) Effect of YAP on PA‐promoted tumor metastasis potential in YAP‐knockdown TOV‐112D cells was examined by the tail vein injection metastasis model. After 5 weeks mice were euthanized, and the brightfield lung images of each group are shown (n = 6 for each group). I) Representative images of H&E staining (n = 6 for each group). J–L) The number of J) lung metastatic nodules, K) weight, and L) survival rate was counted and statistically analyzed (n = 6 for each group). M) Effect of YAP on PA‐promoted tumor metastasis potential in YAP‐knockdown MDA‐MB‐231 cells were examined by the tail vein injection metastasis model. After 5 weeks mice were euthanized, and the brightfield lung images of each group are shown (n = 6 for each group). N) Representative images of H&E staining (n = 6 for each group). O–Q) The number of O) lung metastatic nodules, P) weight, and Q) survival rate were counted and statistically analyzed. (n = 6 for each group). P values were determined by the two‐tailed Student's t‐test (B, D, F, J, O) two‐way analysis of variance analysis (G, K, P), and Log‐rank Mantel–Cox test (L, Q). Data are representative of three independent experiments.
Figure 2
Figure 2
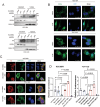
ZDHHC15 positively regulates YAP activity. A) TEAD luciferase reporter activity was assessed in HCC1954 cells following transfection with siRNAs targeting ZDHHC1‐24 respectively or nontargeting control (NC), or MST2/LATS1 or vector control, along with the 8xGTIIC‐luciferase reporter and pRL‐TK Renilla luciferase, with Renilla luciferase serving as an internal control. Cells were then treated with palmitic acid (PA, 100 µm) for 36 h. P values were determined using one‐way ANOVA with Dunnett's multiple comparison test (n = 3). B) HCC1954 cells following transfection with V5 or Flag–tagged‐ZDHHC1‐24 expression constructs, or YAP5SA or MST2/LATS1 or vector control, along with the 8xGTIIC‐luciferase reporter and pRL‐TK Renilla luciferase. Data were normalized to the vector control. P values were determined using one‐way ANOVA with Dunnett's multiple comparison test (n = 3) C) Immunofluorescence staining of YAP (green) and DAPI (blue) was performed on HCC1954 and TOV‐112D cells transfected with V5‐ZDHHC15 WT and DHHS variant. Scale bars: 25 µm. P values were determined using one‐way ANOVA with Dunnett's multiple comparison test (n = 3) D) Immunoblotting (IB) analysis of YAP in the nucleus and cytoplasm of TOV‐112D and HCC1954 cells transfected with V5‐ZDHHC15 WT and DHHS mutant constructs. E) IB analysis was conducted to evaluate the levels of AMOTL2 and CYR61 in HCC1954 and TOV‐112D cells following transfection with V5‐ZDHHC15 WT and DHHS variant. F) IB analysis of Hippo/YAP pathway in ZDHHC15‐depleted HCC1954 and TOV‐112D cells. G) KEGG pathway analysis of differential expressed mRNA transcripts in ZDHHC15‐depleted TOV‐112D cells and their respective control cells. H) Gene set enrichment analysis revealed enrichment in Hippo pathway. GAPDH was used as a loading control. Data are representative of three independent experiments.
Figure 3
Figure 3
ZDHHC15 is a YAP‐regulated gene and forms a feedback loop. A) HCC1954 and TOV‐112D cells were treated with various concentrations of palmitic acid. Immunoblotting (IB) analysis was performed to examine the expression levels of ZDHHC15. B) IB analysis was performed using specific antibodies against YAP, ZDHHC15, and AMOTL2 in YAP‐depleted HCC1954 and TOV‐112D cells. C) HCC1954 and TOV‐112D cells with stable knockdown of YAP were transfected with either the vector control or plasmids encoding YAP‐WT, YAP‐5SA, and YAP‐S94A. The expression levels of YAP, ZDHHC15, and CYR61 were measured by IB. D) HCC1954 and TOV‐112D cells were transfected with non‐targeting siRNA control or respective siRNA targeting TEAD1, TEAD2, TEAD3, or TEAD4 for 48 h. IB analysis was performed for TEAD1/2/3/4, CYR61, and ZDHHC15 protein levels. GAPDH was used as a loading control. E) A schematic diagram illustrating the binding site sequence between TEAD1 and the ZDHHC15 promoter. F) Chromatin immunoprecipitation (ChIP) analysis demonstrated the binding of TEAD1 to the ZDHHC15 promoter in HCC1954 cells. Protein‐bound chromatin was immunoprecipitated with a TEAD1 antibody, with IgG serving as a control. The immunoprecipitated DNA was quantitatively analyzed using primers specific to the ZDHHC15 binding sequence, with CDH4 as a positive control. P values were determined by the two‐tailed Student's t‐test (n = 3). G,H) Luciferase reporter assays were performed using wild‐type or mutant ZDHHC15 promoter constructs in G) HCC1954 and H) TOV‐112D cells transfected with or without TEAD1. Data are presented as the mean ± SD. P values were assessed by one‐way ANOVA followed by Tukey's multiple‐comparison test (n = 3). Data are representative of three independent experiments.
Figure 4
Figure 4
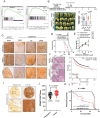
ZDHHC15 promotes metastasis in breast and ovarian cancers. A) RNA‐seq analysis of ZDHHC15‐depleted HCC1954 cells and control cells. Gene set enrichment analysis revealed enrichment in ECM receptor interaction and Focal adhesion. B) ZDHHC15‐depleted TOV‐112D cells were reconstituted with ZDHHC15‐WT or ZDHHC15‐DHHS constructs, then subjected to athymic nude mice xenograft through tail vein injection. After 5 weeks mice were euthanized, and the brightfield lung images of each group are shown (n = 5 mice in each group). C–E) The number of lung metastatic nodules (C), survival rate (D), and weight (E) were counted and statistically analyzed. (n = 5 mice in each group). F–G) Representative images of H&E staining (F) and immunohistochemical staining (G) of ZDHHC15, MMP‐2, and CYR61 performed on paraffin‐embedded xenograft tumor tissues. Scale bar: 100 µm. H) Kaplan–Meier survival analysis of grade III breast cancer samples from TCGA (n = 481, P = 0.029). I) Representative IHC staining of ZDHHC15 was performed on a cohort of breast cancer tissues. J) IHC score of ZDHHC15 for the panel. K) Kaplan–Meier analysis of the recurrence‐free survival of breast cancer patients in the cohort with high v.s. low ZDHHC15 expression. Data are presented as the mean ± SD. P values were determined by the two‐tailed Student's t‐test (J), the one‐way ANOVA, followed by Tukey's post hoc test (C), two‐way analysis of variance analysis (E), and Log‐rank Mantel–Cox test (D, K). Data are representative of three independent experiments. Scale bar: 100 µm. Data are representative of three independent experiments.
Figure 5
Figure 5
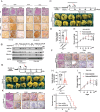
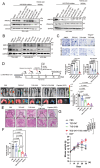
PA hijacks the ZDHHC15‐YAP loop promoting cancer metastasis. A) Immunohistochemical (IHC) staining of ZDHHC15, MMP‐2, and YAP in paraffin‐embedded xenograft tumor tissues from the indicated groups. Scale bar: 100 µm B) ZDHHC15‐depleted HCC1954 and TOV‐112D cells were stimulated with palmitic acid (200 µm) for 12 h. Immunoblotting (IB) analysis of the expression levels of AMOTL2, CYR61, and ZDHHC15. C) Treatment plan for ZDHHC15‐depleted MDA‐MB‐231 cells, mice were fed with a high‐fat diet plus Palm oil in an orthotopic transplantation model. After 6 weeks mice were euthanized, and the brightfield lung images of each group are shown (n = 6 mice in each group). D) The number of lung metastatic nodules and E) weight were counted and statistically analyzed. (n = 6 mice in each group). F) H&E and IHC staining of ZDHHC15, MMP‐2, CYR61, and YAP in paraffin‐embedded xenograft tumor tissues from the indicated groups (n = 6 mice in each group). Scale bar: 100 µm. G) Treatment plan for ZDHHC15‐depleted TOV‐112D cells, mice were fed with a high‐fat diet plus Palm oil in a tail vein injection model. The brightfield lung images of each group are shown (n = 6 mice in each group). (H‐J) The number of H) lung metastatic nodules, I) weight, and J) survival rate were counted and statistically analyzed. (n = 6 mice in each group). K) H&E and IHC staining of ZDHHC15, MMP‐2, CYR61, and YAP in paraffin‐embedded xenograft tumor tissues from the indicated groups (n = 6 mice in each group). Scale bar: 100 µm. P values were determined by the two‐tailed Student's t‐test (D, H), two‐way analysis of variance analysis (E, I), and Log‐rank Mantel–Cox test (J). Data are representative of three independent experiments.
Figure 6
Figure 6
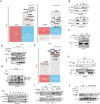
ZDHHC15 interacts with KIBRA and mediates its palmitoylation. A) Immunoprecipitation‐mass spectrometry (IP‐MS) was performed to identify ZDHHC15 or KIBRA binding partners in HCC1954 cells. The volcano plot of multiple group differences shows the same proteins in the BioGRID database that interact with ZDHHC15 (right) or KIBRA (left) as in this mass spectrometry result. B) HCC1954 and TOV‐112D cells were treated with MG132 (15 µm, 4 h) and IP was conducted using anti‐KIBRA or IgG antibodies, followed by immunoblotting (IB) with specific antibodies. C) IP for V5‐ZDHHC15 WT and DHHS mutant association with KIBRA in HEK‐293T cells. D) KIBRA palmitoylation levels were evaluated in HCC1954 cells transfected with V5‐ZDHHC15 using ABE assays, with or without 50 µm of 2‐BP for 24 h treatment in the presence or absence of HAM. E) HCC1954 cells transfected with V5‐ZDHHC15 were subjected to ABE analysis using V5‐tag antibodies in the presence or absence of HAM. The HAM condition served as a negative control. Streptavidin beads were utilized to enrich biotinylated proteins, which were subsequently identified through mass spectrometry (MS). Candidate proteins were considered when their abundance was at least two‐fold higher compared to the control in the HAM+ sample. The volcano plot with multiple group differences shows the same gene as the ZDHHC15 palmitoylation substrate in the SwissPalm database and Ocasio et al.[ 104 ] as reported in this mass spectrometry result. F) ABE analysis was performed to assess KIBRA palmitoylation levels in HCC19431954 cells expressing ZDHHC15 WT and DHHS variant, with MG132 pretreatment. G) KIBRA palmitoylation were analyzed in HEK293T cells using APE assays upon ectopic expression of V5‐ZDHHC15 and/or 2‐BP (50 µm) treatment. H) ABE assay was conducted to analyze KIBRA palmitoylation in TOV‐112D cells ectopically overexpressing HA‐tagged‐KIBRA WT or mutant. I) TOV‐112D cells ectopically expressing HA‐KIBRA or vector control were treated with 100 µm palmitic acid or BSA, in the presence or absence of 2‐BP (50 µm) for 24 h prior to the ABE assay. J) ABE analysis of the palmitoylation of exogenous KIBRA in ZDHHC15‐depleted HCC1954 cells. The cells were transfected with HA‐KIBRA and treated with palmitic acid (PA, 100 µm) for 24 h.
Figure 7
Figure 7
KIBRA palmitoylation decreases its protein stability. A,B) HCC1954 and TOV‐112D cells were treated with 2‐BP (25 µm), ML349 (20 µm), or palmB (1 µm) for the indicated times (A), or stimulated with indicated concentrations of 2‐BP, ML349, and palmB for 16 h B). The protein levels of KIBRA and GAPDH were analyzed by immunoblotting (IB). C) Ectopic expression of V5‐ZDHHC15 in HCC1954 and TOV‐112D cells. The protein levels of KIBRA were analyzed by IB. D) Ectopic expression of V5‐ZDHHC15 WT or DHHS mutant, along with HA‐KIBRA in HCC1954 and TOV‐112D cells. The protein level of HA‐KIBRA was analyzed by IB. E) Ectopic expression of V5‐ZDHHC15 was performed in HEK‐293T cells, followed by treatment with CHX (50 mg mL−1) for indicated time points. The endogenous KIBRA protein levels were analyzed by IB. P values were assessed by one‐way ANOVA followed by Tukey's multiple‐comparison test (n = 3). F) Ectopic expression of V5‐ZDHHC15 was performed in HCC1954 and TOV‐112D cells followed by treatment with bafilomycin A1 or MG132 for 4 h. The protein expression of KIBRA was analyzed by IB. G) HCC1954 and TOV‐112D cells were co‐transfected with V5‐ZDHHC15 WT or DHHS mutant, along with HA‐Ub constructs. After 48 h, cells were treated with MG132 (20 µm) for 4 h. IP was performed using anti‐KIBRA antibodies, followed by IB with the indicated antibodies. H) ZDHHC15‐overexpressed HCC1954 cells were stained with LAMP2 (red) and HA‐KIBRA (green). The colocalization of exogenous HA‐KIBRA and LAMP2 was examined using immunofluorescence microscopy. The cell nucleus (blue) was stained with DAPI. Scale bars: 25 µm. Data are representative of three independent experiments.
Figure 8
Figure 8
Abrogation of KIBRA palmitoylation leads to KIBRA nuclear localization. A) HCC1954 and TOV‐112D cells with stable knockdown of KIBRA were transfected with HA‐KIBRA WT and HA‐KIBRA 2CS constructs. The protein levels of exogenous KIBRA in the nucleus and cytoplasm were analyzed by IB. B) Immunofluorescence staining of KIBRA (green) on HCC1954 and TOV‐112D cells treated with 2‐BP (25 µm) for 24 h. Scale bars: 25 µm. C) Ectopic expression of HA‐KIBRA WT and HA‐KIBRA 2CS was performed in HCC1954 and TOV‐112D cells. Confocal microscopy was used to analyze the co‐localization of ZDHHC15 (green) and HA‐KIBRA (red). Scale bars: 25 µm. D) HCC1954 and TOV‐112D cells were transfected with the 8xGTIIC‐luciferase reporter along with KIBRA WT and its mutants. YAP 5SA and Myc‐tagged LATS1/MST2 were utilized as positive and negative controls, respectively. P values were assessed by one‐way ANOVA with Tukey's multiple comparisons test (n = 3). Data are representative of three independent experiments.
Figure 9
Figure 9
Combinatorial targeting of ZDHHC15‐YAP loop and fatty acid synthesis suppresses metastasis formation in mice fed with a Palm diet. A) YAP/TEAD inhibitors and fatty acid synthesis inhibitors induced AMOTL2 and ZDHHC15 protein expression in HCC1954 and TOV‐112D cells. These cells were treated with 20 µm ML‐7, 10 µm BET‐inhibitor, 20 µm TED‐347, 10 µm T‐5224, 20 µm K975, 1 nm Dasatinib, 25 µm C75 or 10 µm TVB‐3166 respectively for 24 h. B) HCC1954, TOV‐112D, and MDA‐MB‐231 cells were treated with DMSO, 20 µm TED‐347 or 10 µm TVB‐3166, or TED‐347 plus TVB‐3166 for 16 h. IB analysis of the expression levels of MMP‐9 and MMP‐2. C) The cell invasion capacity of TOV‐112D and MDA‐MB‐231 cells was evaluated using the trans‐well chamber after treatment with DMSO, 20 µm TED‐347 or 10 µm TVB‐3166, or TED‐347+TVB‐3166 for 16 h. P values were determined by the one‐way ANOVA, followed by Tukey's post hoc test (n = 3). D) Treatment plan for mice fed with a high‐fat diet plus palm oil in orthotopic transplantation models. The mice were treated with PBS, TED‐347 (20 mg kg−1) Cisplatin (10 mg kg−1) tail vein injection once every three days, and TVB‐3166 (60–80mg kg−1) with oral gavage once daily. Shown are images and BLI quantification of lung metastasis (n = 5 mice in each group). E) H&E staining in paraffin‐embedded xenograft tumor tissues from the indicated groups (n = 5 mice in each group). (F, G) The number of lung metastatic nodules (F), and weight (G) were counted and statistically analyzed. (n = 5 mice in each group). Scale bar: 100 µm. P values were determined by the one‐way ANOVA, followed by Tukey's post hoc test (D, F), and two‐way analysis of variance analysis (G). Data are representative of three independent experiments.
Figure 10
Figure 10
Schematic model of KIBRA palmitoylation and ZDHHC15‐YAP loop in cancer metastasis. Left: ZDHHC15‐YAP “OFF”, YAP is phosphorylated by LATS1 and is degraded in the cytoplasm, thereby TEAD transcription is shut down. Right: ZDHHC15‐YAP “ON” upon palmitic acid stimulation, ZDHHC15‐mediated KIBRA palmitoylation is enhanced, leading to KIBRA degradation, YAP activation, and TEAD transcription. Similar to other YAP target genes, ZDHHC15 is regulated by YAP/TEAD, and forms a feed‐forward loop in the Hippo pathway, thereby contributing to PA‐ and/or YAP‐triggered cancer metastasis.

References

    1. Zhou Q., Li L., Zhao B., Guan K. L., Circ. Res. 2015, 116, 1431. - PMC - PubMed
    1. Choi S. Y., Bae H., Jeong S. H., Park I., Cho H., Hong S. P., Lee D. H., Lee C. K., Park J. S., Suh S. H., Choi J., Yang M. J., Jang J. Y., Onder L., Moon J. H., Jeong H. S., Adams R. H., Kim J. M., Ludewig B., Song J. H., Lim D. S., Koh G. Y., Nat. Commun. 2020, 11, 519. - PMC - PubMed
    1. Codelia V. A., Irvine K. D., Cell 2012, 150, 669. - PubMed
    1. Yu F. X., Zhao B., Guan K. L., Cell 2015, 163, 811. - PMC - PubMed
    1. Wu S., Huang J., Dong J., Pan D., Cell 2003, 114, 445. - PubMed

LinkOut - more resources