. 2025 Feb;16(1):e13665.
doi: 10.1002/jcsm.13665. Epub 2024 Dec 17.

Lonafarnib Protects Against Muscle Atrophy Induced by Dexamethasone

Affiliations

Lonafarnib Protects Against Muscle Atrophy Induced by Dexamethasone

Sanghoon Bae et al. J Cachexia Sarcopenia Muscle. 2025 Feb.

Abstract

Background: Muscle atrophy, including glucocorticoid-induced muscle wasting from treatments such as dexamethasone (DEX), results in significant reductions in muscle mass, strength and function. This study investigates the potential of lonafarnib, a farnesyltransferase inhibitor, to counteract DEX-induced muscle atrophy by targeting key signalling pathways.

Methods: We utilized in vitro models with C2C12 myotubes treated with DEX and in vivo models with Caenorhabditis elegans and DEX-treated Sprague-Dawley rats. Myotube morphology was assessed by measuring area, fusion index and diameter. Muscle function was evaluated by grip strength and compound muscle action potential (CMAP) in the gastrocnemius (GC) and tibialis anterior (TA) muscles. Molecular mechanisms were explored through RNA sequencing and Western blotting to assess changes in mitochondrial function and muscle signalling pathways.

Results: Lonafarnib (2 μM) significantly improved myotube area (1.49 ± 0.14 × 105 μm2 vs. 1.03 ± 0.49 × 105 μm2 in DEX, p < 0.05), fusion index (18.73 ± 1.23% vs. 13.3 ± 1.56% in DEX, p < 0.05) and myotube diameter (31.89 ± 0.89 μm vs. 21.56 ± 1.01 μm in DEX, p < 0.05) in C2C12 myotubes. In C. elegans, lonafarnib (100 μM) increased the pharyngeal pumping rate from 212 ± 7.21 contractions/min in controls to 308 ± 17.09 contractions/min at day 4 (p < 0.05), indicating enhanced neuromuscular function. In DEX-induced atrophic rats, lonafarnib improved maximal grip strength (DEX: 13.91 ± 0.78 N vs. 1 μM lonafarnib: 16.18 ± 0.84 N and 5 μM lonafarnib: 16.71 ± 0.83 N, p < 0.05), increased muscle weight in GC, and enhanced CMAP amplitudes in both GC and TA muscles. Western blot analysis showed that lonafarnib treatment upregulated UCP3 and ANGPTL4 and increased phosphorylation of mTOR and S6 ribosomal protein (p < 0.05), indicating enhanced mitochondrial function and protein synthesis. Knockdown models further demonstrated that lonafarnib could partially rescue muscle atrophy phenotypes, indicating its action through multiple molecular pathways.

Conclusions: Lonafarnib mitigates dexamethasone-induced muscle atrophy by enhancing mitochondrial function and activating anabolic pathways. These findings support further investigation of lonafarnib as a therapeutic agent for muscle atrophy in clinical settings.

Keywords: ANGPLT4; UCP3; dexamethasone; drug repositioning; lonafarnib; muscle atrophy.


Conflict of interest statement

The authors declare no conflicts of interest.

Figures

FIGURE 1
FIGURE 1
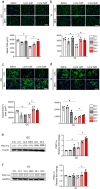
Effect of lonafarnib on dexamethasone‐induced muscle atrophy in in vitro models. (a) Representative microscopy images stained with MYH (green) and DAPI (blue) illustrating the morphological differences between the control group (CTL), dexamethasone‐induced muscle atrophy model (DEX), and DEX models treated with 0.5, 1, 2 or 4 μM lonafarnib (DL0.5, DL1, DL2 and DL4, respectively). (b) Quantitative analysis of myotube area. (c) Evaluation of the fusion index, d. Myotube diameter measurements. (e, f) Relative fold changes in MuRF1 (e) and MAFbx (f) gene expression levels determined by real‐time PCR analysis for each group. *p < 0.05 by one‐way ANOVA with the Games–Howell post hoc test.
FIGURE 2
FIGURE 2
Effects of lonafarnib on motor function and muscle weight in animal models of muscle atrophy. (a) Pharyngeal pumping velocity in C. elegans : Comparison between the control (CTL) group and the groups treated with 1, 10 or 100 μM lonafarnib (n = 3 per group). (b) Grip strength results:Comparison between control (CTL) and dexamethasone (DEX)‐induced muscle atrophy model rats treated with or without 1 or 5 μM lonafarnib (CL1, CL5, DL1, or DL5) (n = 6 per group). (c) Changes in body weight: Analysis of control and dexamethasone‐induced muscle atrophy model rats treated with or without 1 or 5 μM lonafarnib. (d) Representative images of muscle tissue from each group (n = 6 per group). Weights of specific hindlimb muscles—the gastrocnemius (e), and tibialis anterior (f)—across groups (n = 6 per group). *p < 0.05 between the control and group treated with 100 μM lonafarnib (a), and between DEX group and group treated with 5 μM lonafarnib (DL5) (b, c), and **p < 0.05 between DEX group and group treated with 1 μM lonafarnib (DL1) (b) by two‐way ANOVA followed by the Bonferroni post hoc test.. *p < 0.05 by one‐way ANOVA with the Games–Howell post hoc test (e, f). CTL = control, CL1 = control that received 1 μM lonafarnib, CL5 = control that received 5 μM lonafarnib, DEX = dexamethasone‐induced muscle atrophy model, DL1 = dexamethasone‐induced muscle atrophy model that received 1 μM lonafarnib, DL5 = dexamethasone‐induced muscle atrophy model that received 5 μM lonafarnib.
FIGURE 3
FIGURE 3
Effect of lonafarnib on electrophysiological function in muscle atrophy models. Representative images showing the compound muscle action potential (CMAP) in the gastrocnemius (GC) (a) and tibialis anterior (TA) (c) muscles in different groups: control (CTL), dexamethasone‐induced muscle atrophy (DEX) models, and models treated with 1 or 5 μM lonafarnib (CL1, CL5, DL1 and DL5, respectively) (n = 4 per group). Quantitative analysis of onset latency in the gastrocnemius (b) and tibialis anterior (d) muscles. *p < 0.05 by one‐way ANOVA with the Games–Howell post hoc test. GC = gastrocnemius, TA = tibialis anterior.
FIGURE 4
FIGURE 4
Lonafarnib‐induced histological and molecular changes in muscle atrophy models. Representative images and quantitative analysis of dystrophin‐stained cross‐sectional areas in the gastrocnemius (GC) muscle (a) and tibialis anterior (TA) muscle (b). Representative images and quantitative analysis of cytochrome C‐stained areas in the GC muscle (c) and TA muscle (d) in different groups. Western blot images and relative expression of PGC1‐α in the GC muscle (e) and TA muscle (f) in different groups (n = 4 per group). *p < 0.05 by one‐way ANOVA with the Games–Howell post hoc test.
FIGURE 5
FIGURE 5
Transcriptional changes following lonafarnib administration. Summary of DEG analysis and significant aspects of transcriptional transitions in the four comparison groups after lonafarnib administration. The number of (a) up‐ and (b) downregulated genes identified in both tissues in the DEX group (DL1 and DL5). Overlapping areas in the Venn diagram represent genes common to every comparison group. The number of genes in the solid line region represents the number of genes in the gastrocnemius muscles, and the number in the dashed line region represents the number of genes in the tibialis anterior muscle. (c) The common DEGs (15 upregulated DEGs and one downregulated DEG) whose expression significantly changed in response to lonafarnib administration were visualized via heatmap clustering. The legend and colour key show the experimental cases and the number of expression values, respectively. (d) The biological roles of 74 up‐ and 29 downregulated genes that were commonly differentially expressed in at least three groups were identified. Red and blue circles indicate the associations of up‐ and downregulated genes, respectively, with darkness indicating significance. (e) A violin plot showing the distribution of the expression intensity of genes involved in six biological mechanisms essential for muscle homeostasis. Violin plots combine box plots and kernel density traces to describe the distribution pattern of a data vector. All expression differences were compared to those of the control to determine whether each group exhibited a drastic change in the corresponding biological mechanism. One to four asterisks (*–****) indicate p values less than 0.05, 0.01, 0.001, and 0.0001, respectively.
FIGURE 6
FIGURE 6
Western blot analysis of key genes in muscle atrophy models after treatment with lonafarnib. (a) Representative images of western blots (left) and quantitative analysis of the phosphorylated p44/42Thr202/Thy204(p‐p44/42Thr202/Thy204)‐to‐p44/42 MAPK ratio, the phosphorylated PTENSer380 (p‐PTENSer380)‐to‐PTEN ratio, the p‐AktSer473‐to‐Akt ratio, p‐AktThr308‐to‐Akt ratio and the p‐mTORSer2448‐to‐mTOR ratio (right). (b) Representative western blot images (left) and quantitative analysis of the phosphorylated P70S6KThr389/P70S6K ratio, the phosphorylated S6 ribosomal protein (RP)Ser235/236/S6 RP ratio, and the phosphorylated S6 RPSer240/244/S6 RP ratio (right), (c) representative western blot images (left) and quantitative analysis of Ucp3 and Angptl4 expression (right), and (d) representative western blot images (left) and quantitative analysis of the phosphorylated CaMKIIThr172/CaMKII ratio (p‐CaMKII/CaMKII) and phosphorylated AMPKThr286/AMPK ratio (p‐AMPK/AMPK) (right) (n = 4 per group). *p < 0.05 by one‐way ANOVA with the Games–Howell post hoc test.
FIGURE 7
FIGURE 7
Effect of lonafarnib in the Ucp3 and Angptl4 knockdown models. Representative image and the results of the quantitative analyses of myotube area, fusion index, myotube diameter, and relative fold changes (RT–PCR) in Ucp3 (a and b, respectively) and Angptl4 (c and d, respectively) knockdown models (n = 4 per group). *p < 0.05 by one‐way ANOVA with the Games–Howell post hoc test.
FIGURE 8
FIGURE 8
Proposed mechanisms of action of lonafarnib in muscle atrophy models.

References

    1. Cruz‐Jentoft A. J. and Sayer A. A., “Sarcopenia,” Lancet 393 (2019): 2636–2646. - PubMed
    1. Feike Y., Zhijie L., and Wei C., “Advances in Research on Pharmacotherapy of Sarcopenia,” Aging Medicine (Milton) 4 (2021): 221–233. - PMC - PubMed
    1. Suzuki M., Jeng L. J. B., Chefo S., et al., “FDA Approval Summary for Lonafarnib (Zokinvy) for the Treatment of Hutchinson‐Gilford Progeria Syndrome and Processing‐Deficient Progeroid Laminopathies,” Genetics in Medicine 25 (2023): 100335. - PubMed
    1. Nakazawa H., Wong L. P., Shelton L., Sadreyev R., and Kaneki M., “Farnesysltransferase Inhibitor Prevents Burn Injury‐Induced Metabolome Changes in Muscle,” Metabolites 12 (2022): 800. - PMC - PubMed
    1. Saxton R. A. and Sabatini D. M., “mTOR Signaling in Growth, Metabolism, and Disease,” Cell 168 (2017): 960–976. - PMC - PubMed