. 2024 Nov 15;27(12):111393.
doi: 10.1016/j.isci.2024.111393. eCollection 2024 Dec 20.

CFTR represses a PDX1 axis to govern pancreatic ductal cell fate

Affiliations

CFTR represses a PDX1 axis to govern pancreatic ductal cell fate

Pavana G Rotti et al. iScience. .

Abstract

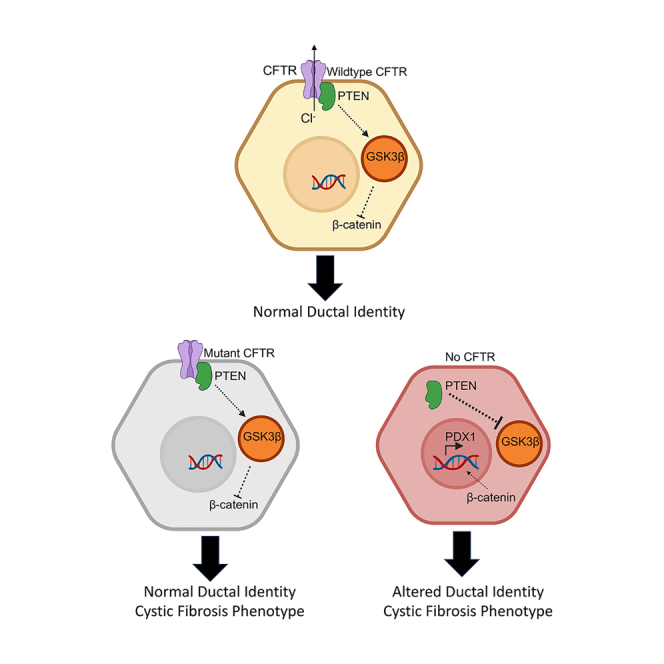
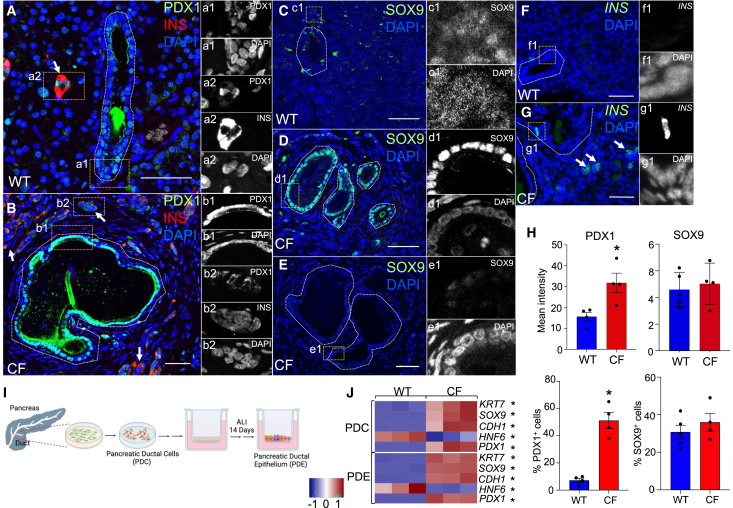
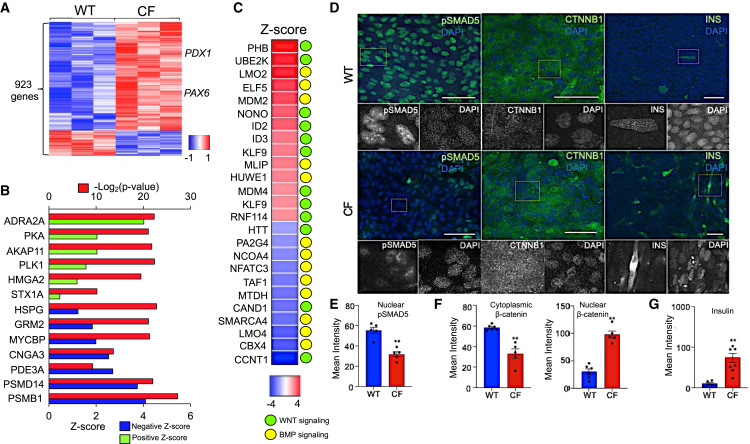
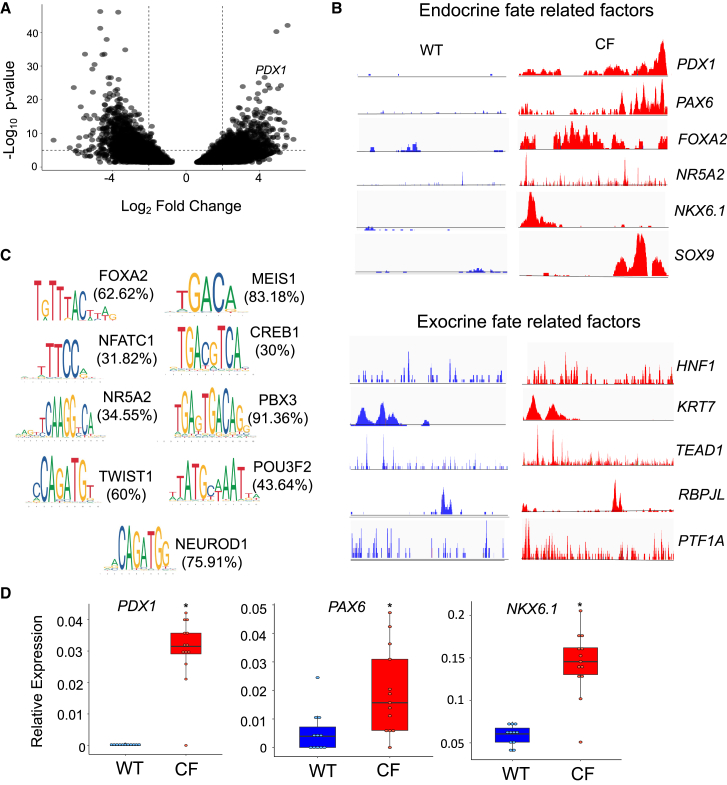
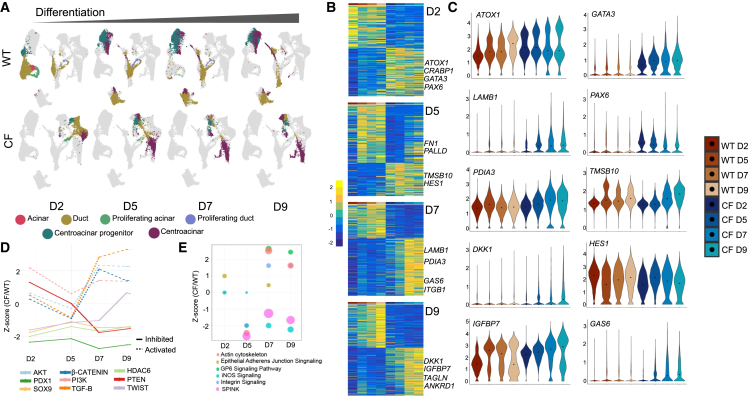
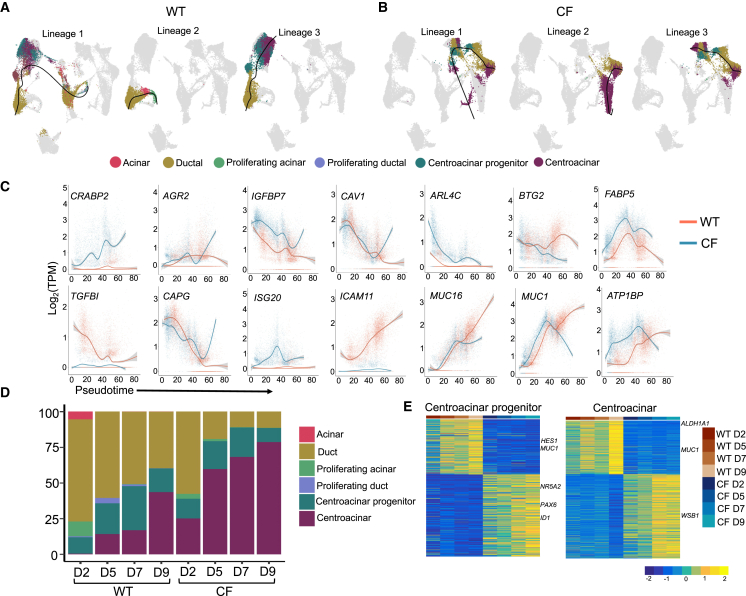
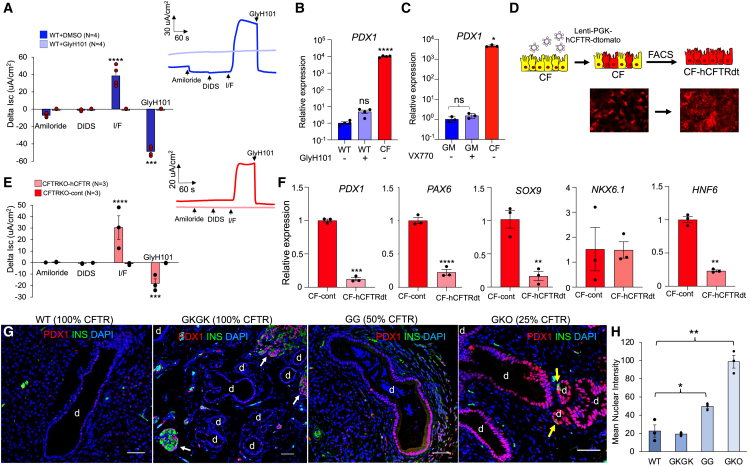
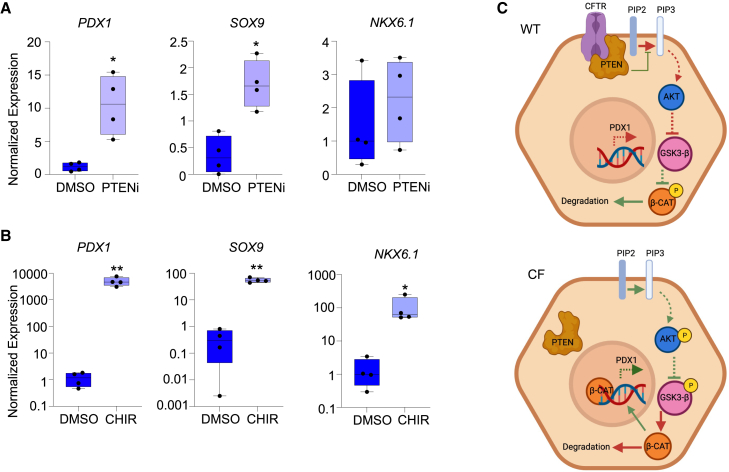
Inflammation, acinar atrophy, and ductal hyperplasia drive pancreatic remodeling in newborn cystic fibrosis (CF) ferrets lacking a functional cystic fibrosis conductance regulator (CFTR) channel. These changes are associated with a transient phase of glucose intolerance that involves islet destruction and subsequent regeneration near hyperplastic ducts. The phenotypic changes in CF ductal epithelium and their impact on islet function are unknown. Using bulk RNA sequencing (RNA-seq), single-cell RNA sequencing (scRNA-seq), and assay for transposase-accessible chromatin using sequencing (ATAC-seq) on CF ferret models, we demonstrate that ductal CFTR protein constrains PDX1 expression by maintaining PTEN and GSK3β activation. In the absence of CFTR protein, centroacinar cells adopted a bipotent progenitor-like state associated with enhanced WNT/β-Catenin, transforming growth factor β (TGF-β), and AKT signaling. We show that the level of CFTR protein, not its channel function, regulates PDX1 expression. Thus, this study has discovered a cell-autonomous CFTR-dependent mechanism by which CFTR mutations that produced little to no protein could impact pancreatic exocrine/endocrine remodeling in people with CF.

Keywords: Cell biology; Molecular biology; Physiology; Transcriptomics.


Conflict of interest statement

The authors declare no competing interests.

Figures

None
Graphical abstract
Figure 1
Figure 1
Aberrant gene expression in CF pancreatic ducts (A–E) WT and CF 2-month-old ferret pancreas immunostained for (A and B) PDX1 and INS or (C–E) SOX9. Insets are single-channel images of the regions marked by the dotted boxes. (F and G) Immunofluorescent images of 2-month-old WT and CF ferret pancreas stained for INS. Islets are identified by the expression of insulin and are marked by arrows. Ducts are identified by the presence of a lumen and marked by dotted lines. All images were acquired on a confocal microscope (Zeiss 880) at 20X magnification and processed for maximum intensity projection. Scale bars are 50 μm. (H) Mean intensity of nuclear PDX1 or SOX9 immunoreactivity within ductal cells and frequency of PDX1- or SOX9-positive cells from WT (n = 4 donors) and CF (n = 4 donors) 2-month-old pancreata. Four ducts were quantified from each donor and averaged. Data show the mean ± SEM. Nonparametric Mann-Whitney t test was used to evaluate significance (∗p < 0.05). (I) Schematic of in vitro approached used to establish ferret pancreatic duct epithelium (PDE) from passaged pancreatic ductal cells (PDCs). (J) Relative expression of pancreatic duct enriched genes in WT and CF PDC and PDE quantified using RT-qPCR. Nonparametric Mann-Whitney t test was used to evaluate significance (∗p < 0.05).
Figure 2
Figure 2
Transcriptional changes in CF PDE implicate WNT activation and BMP repression (A) The bulk transcriptomes of newborn WT and CF PDE cultures were sequenced. Heatmap shows differentially expressed genes following Benjamini-Hochberg correction (p < 0.05). (B) Upstream regulators of observed DEGs were obtained from IPA analysis. The Z scores and p values of the top regulators are shown. (C) Overlap between putative upstream regulators of DEGs found in PDE cultures and known regulators of pancreatic endocrine progenitors specific genes. Activation Z scores are displayed in the heatmap. Association of the candidate upstream regulators with WNT or BMP signaling is indicated on the right. (D) Whole-mount localization of pSMAD5 (BMP regulator) and nuclear CTNNB1 (β-catenin, WNT regulator) with insulin in WT and CF PDE cultures. Images were obtained on confocal microscope Zeiss 880 at 20X magnification and processed for maximum intensity projection. (E) Quantification of nuclear pSMAD5 in WT (n = 5 donors) and CF (n = 5 donors) PDE cultures. (F) Quantification of cytoplasmic and nuclear CTNNB1 in WT (n = 6 donors) and CF (n = 5 donors) PDE cultures. (G) Quantification of insulin expression in WT (N = 6 donors) and CF (N = 7 donors) PDE cultures. Bar plots in (E–G) show mean intensity of expression from 3 transwells per donor +/− SEM. Significance was calculated using nonparametric Mann-Whitney t test (∗∗p < 0.01).
Figure 3
Figure 3
Altered epigenome in CF PDE cultures leads to greater accessibility of endocrine lineage-related genes (A) Differentially open regions (DORs) in the genome of CF relative to WT PDE cultures are shown in the volcano plot. Regions in the genome with −2< or >2 Log2FC read alignment were considered differentially open between genotypes. (B) Histograms of the number of reads aligned to genomic loci of endocrine fate-related factors and exocrine fate-related factors. (C) Analysis of motif enrichment (AME) for TF binding site motifs in the open regions of the CF PDE genome. Enriched motifs of endocrine fate-related TFs are shown. The percentage of open regions with the shown motifs is given in parentheses. (D) RT-qPCR quantification of endocrine fate-associated gene expression in WT (n = 11 cultures from 6 donors) and CF (n = 13 cultures from 6 donors) PDE cultures. Boxplots indicate mean relative expression +/− SEM. Significance was calculated using nonparametric Mann-Whitney t test (∗p < 0.05).
Figure 4
Figure 4
Single-cell transcriptomes of actively differentiating PDCs reveal acquisition of an epithelial-to-mesenchymal transitional phenotype in CF PDE cultures (A) WT and CF PDE on day 2 (D2), day 5 (D5), day 7 (D7), and day 9 (D9) of differentiation at ALI underwent 10× single-cell RNA sequencing (scRNA-seq). Shown are uniform manifold approximation and projections (UMAPs) of cell types at each time point of differentiation; cell markers for classification used a combined mouse and human scRNA-seq pancreatic datasets. (B) Heatmaps of DEGs in CF relative to WT PDE cultures at each time point. Genes relevant to epithelial-to-mesenchymal transition (EMT), diabetes, and cystic fibrosis are highlighted. Time point of differentiation is shown in the color-coded panel on top of each heatmap (using the legend shown in C). (C) Violin plots of DEGs found in WT vs. CF PDE cultures depicting Log2(TPM) expression level at each time point of differentiation. (D) Putative upstream regulators of the DEGs in CF PDE cultures. Activation Z score of candidate regulators is shown at each time point of differentiation. Z scores >2 indicate activation (dotted lines) and <−2 indicates inhibition. (E) Activation Z scores of IPA pathways altered in CF relative to WT PDE cultures at each time point of differentiation.
Figure 5
Figure 5
CF PDE cultures predominantly differentiate to centroacinar cells (A and B) Lineage trajectories observed in differentiating (A) WT and (B) CF PDE cultures using slingshot pseudotime ordering. (C) Variable expression profile of genes associated with centroacinar progenitors and centroacinar cell development in CF and WT PDE lineages. (D) Relative proportions of cell types in WT and CF PDE cultures at different time points of differentiation. A higher relative proportion of centroacinar cells is observed in CF PDE cultures. (E) DEGs in centroacinar progenitor and centroacinar cells generated from WT and CF PDE cultures at day 9 of differentiation.
Figure 6
Figure 6
CFTR protein presence, but not function, regulates PDX1 expression (A) Short circuit current measurement in WT PDE cultures differentiated in the presence of CFTR inhibitor GlyH101 or vehicle (DMSO). Responses to sequential addition of amiloride, DIDS, IBMX/Forskolin (IF), and GlyH101 are shown (n = 4 donors with 2 cultures averaged per donor). Inset is a representative current trace for each condition. (B) RT-qPCR quantification of PDX1 expression under the conditions show in (A). PDX1 expression in CFTR-KO PDE cultures without GlyH101 is shown for comparison (n = 4 donors with 3–4 cultures combined for RNA). (C) PDX1 expression in PDE cultures derived from ferret PDCs with homozygous CFTR-G551D germ line and differentiated in the presence of VX-770 (+) or DMSO (−) (n = 3 donors with 3–4 cultures combined for RNA). PDX1 expression in CFTR-KO PDEs is shown for comparison (n = 3 donors with 3–4 transwells combined for RNA). PDX1 expression is normalized to that of (B) WT (−) or (C) G551D (−). (D) Schematic of human CFTR (hCFTR) complementation in CFTR-KO PDCs using a lentiviral vector that also expresses tdTomato. A vector expressing just tdTomato was used as a control (cont). FACS-enriched tdTomato-positive cells were used to generate PDE cultures. Representative images of PDC cultures before and after FACS enrichment are shown below the schematic. (E) Short circuit current measurements of PDE cultures-derived lentiviral transduced CFTR-KO PDCs expressing hCFTR/tdTomato or tdTomato alone. Responses to sequential addition of amiloride, DIDS, IBMX/Forskolin (IF), and GlyH101 are shown (n = 3 donors). Inset is a representative trace of current for each condition. (F) RT-qPCR quantification of ductal (SOX9, HNF6) and endocrine (PDX1, PAX6, NKX6.1) genes expression from the conditions in (E) (n = 3 donors with 2 cultures combined for RNA). Expression levels are normalized to CFTR-KO tdTomato PDE cultures. (G) Immunofluorescence images of PDX1 and INS expression in 2-month-old WT ferrets and CFTR mutants ferrets with variable expression of CFTR protein (percent CFTR expression is shown on top of each image). Images were obtained on confocal microscope Zeiss 880 at 20X magnification and processed for maximum intensity projection. Scale bars, 50 μm. (H) Quantification of PDX1 expression in ductal epithelium (n = 3 donors for each genotype). All graphs show the mean ± SEM. Significance was calculated using nonparametric Mann-Whitney t test (∗p < 0.05, ∗∗p < 0.01, ∗∗∗p < 0.001, ∗∗∗∗p < 0.0001).
Figure 7
Figure 7
PTEN inhibition and WNT activation induce PDX1 expression in WT PDE (A and B) RT-qPCR quantification of PDX1, SOX9, and NKX6.1 mRNA in WT PDEs exposed to PTEN inhibitor (A) (PTENi) and WNT agonist (B) (CHIR). Boxplots show the mean relative expression +/− SEM for n = 4 donors per condition with ≥3 PDE cultures analyzed per donor and averaged. Significance was calculated using nonparametric Mann-Whitney t test (∗p < 0.05, ∗∗p < 0.01). (C) Schematic of proposed model for CFTR/PTEN-mediated PDX1 regulation. The reactions that are proposed to be active in the presence or absence of CFTR are shown by green arrows (activating) and lines with caps (inhibitory), whereas reactions that are suppressed are indicated in red arrows and lines with caps. Dotted arrows indicate presence of intermediate reactions that are not shown in the schematic.

References

    1. Grasemann H., Ratjen F. Cystic Fibrosis. N. Engl. J. Med. 2023;389:1693–1707. doi: 10.1056/NEJMra2216474. - DOI - PubMed
    1. Gibson-Corley K.N., Engelhardt J.F. Animal Models and Their Role in Understanding the Pathophysiology of Cystic Fibrosis-Associated Gastrointestinal Lesions. Annu. Rev. Pathol. 2021;16:51–67. doi: 10.1146/annurev-pathol-022420-105133. - DOI - PubMed
    1. Rickels M.R., Norris A.W., Hull R.L. A tale of two pancreases: exocrine pathology and endocrine dysfunction. Diabetologia. 2020;63:2030–2039. doi: 10.1007/s00125-020-05210-8. - DOI - PMC - PubMed
    1. Hart N.J., Aramandla R., Poffenberger G., Fayolle C., Thames A.H., Bautista A., Spigelman A.F., Babon J.A.B., DeNicola M.E., Dadi P.K., et al. Cystic fibrosis-related diabetes is caused by islet loss and inflammation. JCI Insight. 2018;3 doi: 10.1172/jci.insight.98240. - DOI - PMC - PubMed
    1. Pan F.C., Wright C. Pancreas organogenesis: from bud to plexus to gland. Dev. Dynam. 2011;240:530–565. doi: 10.1002/dvdy.22584. - DOI - PubMed