Metabolomic disorders caused by an imbalance in the gut microbiota are associated with central precocious puberty
- PMID: 39687078
- PMCID: PMC11646730
- DOI: 10.3389/fendo.2024.1481364
Metabolomic disorders caused by an imbalance in the gut microbiota are associated with central precocious puberty
Abstract
Background: Central precocious puberty (CPP) is characterized by the premature activation of the hypothalamic-pituitary-gonadal axis, resulting in early onset of sexual development. The incidence of CPP has been rising in recent years, with approximately 90% of cases lacking a clearly identifiable etiology. While an association between precocious puberty and gut microbiota has been observed, the precise causal pathways and underlying mechanisms remain poorly understood. The study aims to investigate the potential mechanisms through which gut microbiota imbalances may contribute to CPP.
Methods: In this study, clinical information and fecal samples were collected from 50 CPP patients and 50 healthy control subjects. The fecal samples were analyzed by 16S rDNA sequencing and UPLC-MS/MS metabolic analysis. Spearman correlation analysis was used to identify the relationships between gut microbiota and metabolites.
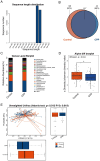
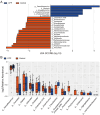
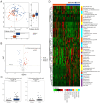
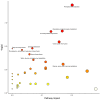
Results: The gut microbiota composition in CPP patients was significantly different from that in healthy controls, characterized by an increased abundance of Faecalibacterium and a decreased abundance of Anaerotruncus. Additionally, significant differences were observed in metabolite composition between the CPP and control groups. A total of 51 differentially expressed metabolites were identified, with 32 showing significant upregulation and 19 showing significant downregulation in the CPP group. Furthermore, Spearman correlation analysis indicated that gut microbiota dysbiosis may contribute to altered metabolic patterns in CPP, given its involvement in the regulation of several metabolic pathways, including phenylalanine and tyrosine biosynthesis and metabolism, the citrate cycle (TCA cycle), glyoxylate and dicarboxylate metabolism, and tryptophan metabolism.
Conclusions: The study revealed the gut microbial and metabolite characteristics of CPP patients by integrating microbiome and metabolomics analyses. Moreover, several key metabolic pathways involved in the onset and progression of CPP were identified, which were regulated by gut microbiota. These findings broaden the current understanding of the complex interactions between gut microbial metabolites and CPP, and provide new insights into the pathogenesis and clinical management of CPP.
Keywords: 16S rDNA; GnRH; central precocious puberty; gut microbiota; metabolomics.
Copyright © 2024 Liu, Zhou, Li, Yin and Li.
Conflict of interest statement
The authors declare that the research was conducted in the absence of any commercial or financial relationships that could be construed as a potential conflict of interest.
Figures


Similar articles
-
Gut microbiome combined with metabolomics reveals biomarkers and pathways in central precocious puberty.J Transl Med. 2023 May 11;21(1):316. doi: 10.1186/s12967-023-04169-5. J Transl Med. 2023. PMID: 37170084 Free PMC article.
-
Glycodeoxycholic acid alleviates central precocious puberty by modulating gut microbiota and metabolites in high-fat diet-fed female rats.Cell Mol Life Sci. 2025 Apr 17;82(1):163. doi: 10.1007/s00018-025-05680-2. Cell Mol Life Sci. 2025. PMID: 40244411 Free PMC article.
-
Serum Metabolomic Analysis of Healthy and Central Precocious Puberty Girls.Clin Endocrinol (Oxf). 2025 Jun;102(6):664-672. doi: 10.1111/cen.15226. Epub 2025 Mar 5. Clin Endocrinol (Oxf). 2025. PMID: 40042104
-
Interaction between Vitamin D homeostasis, gut microbiota, and central precocious puberty.Front Endocrinol (Lausanne). 2024 Dec 9;15:1449033. doi: 10.3389/fendo.2024.1449033. eCollection 2024. Front Endocrinol (Lausanne). 2024. PMID: 39717097 Free PMC article. Review.
-
Precocious puberty and microbiota: The role of the sex hormone-gut microbiome axis.Front Endocrinol (Lausanne). 2022 Oct 21;13:1000919. doi: 10.3389/fendo.2022.1000919. eCollection 2022. Front Endocrinol (Lausanne). 2022. PMID: 36339428 Free PMC article. Review.
Cited by
-
Research summary, possible mechanisms and perspectives of gut microbiota changes causing precocious puberty.Front Nutr. 2025 Apr 25;12:1596654. doi: 10.3389/fnut.2025.1596654. eCollection 2025. Front Nutr. 2025. PMID: 40352262 Free PMC article. Review.
References
MeSH terms
LinkOut - more resources
Full Text Sources

