. 2024 Nov 29:78:102969.
doi: 10.1016/j.eclinm.2024.102969. eCollection 2024 Dec.

Risk of intraoperative hemorrhage during cesarean scar ectopic pregnancy surgery: development and validation of an interpretable machine learning prediction model

Affiliations

Risk of intraoperative hemorrhage during cesarean scar ectopic pregnancy surgery: development and validation of an interpretable machine learning prediction model

Xinli Chen et al. EClinicalMedicine. .

Abstract

Background: Current models for predicting intraoperative hemorrhage in cesarean scar ectopic pregnancy (CSEP) are constrained by known risk factors and conventional statistical methods. Our objective is to develop an interpretable prediction model using machine learning (ML) techniques to assess the risk of intraoperative hemorrhage during CSEP in women, followed by external validation and clinical application.

Methods: This multicenter retrospective study utilized electronic medical record (EMR) data from four tertiary medical institutions. The model was developed using data from 1680 patients with CSEP diagnosed and treated at Qilu Hospital of Shandong University, Chongqing Health Center for Women and Children, and Dezhou Maternal and Child Health Care Hospital between January 1, 2008, and December 31, 2023. External validation data were obtained from Liao Cheng Dong Chang Fu District Maternal and Child Health Care Hospital between January 1, 2021, and December 31, 2023. Random forest (RF), Lasso, Boruta, and Extreme Gradient Boosting (XGBoost) were employed to identify the most influential variables in the model development data set; the best variables were selected based on reaching the λmin value. Model development involved eight machine learning methods with ten-fold cross-validation. Accuracy and decision curve analysis (DCA) were used to assess model performance for selection of the optimal model. Internal validation of the model utilized area under the receiver operating characteristic curve (AUC), sensitivity, specificity, Matthews correlation coefficient, and F1 score. These same indicators were also applied to evaluate external validation performance of the model. Finally, visualization techniques were used to present the optimal model which was then deployed for clinical application via network applications.

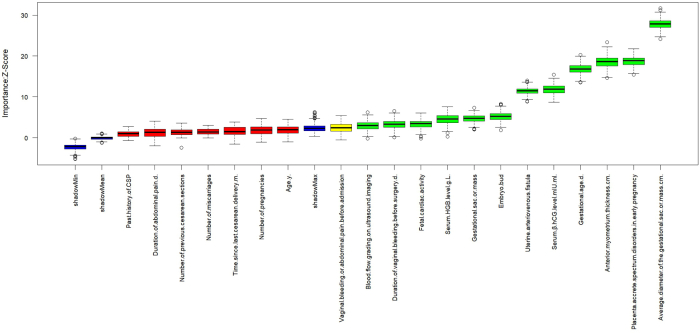
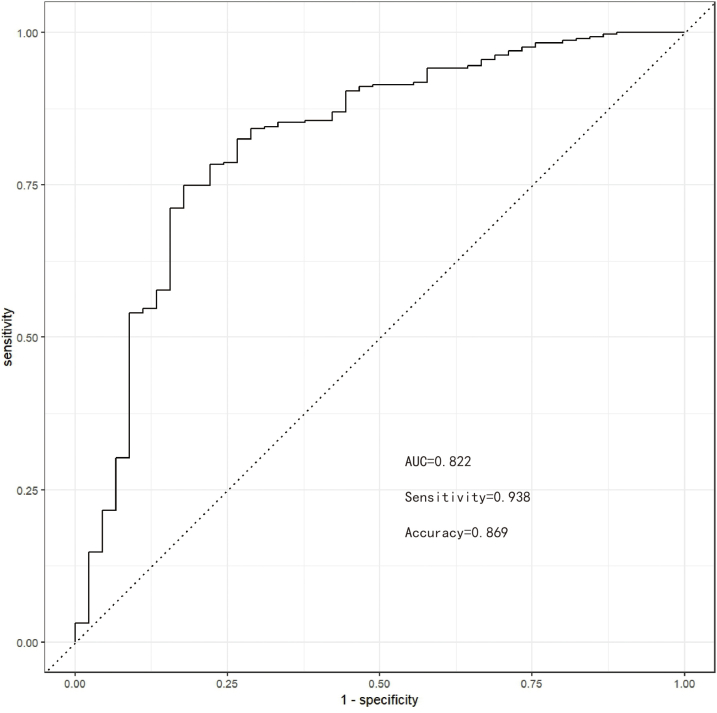
Findings: Setting λmin at the value of 0.003, the optimal variable combination containing 9 variables was selected for model development. The optimal prediction model (Bayes) had an accuracy of 0.879 (95% CI: 0.857-0.901) an AUC of 0.882 (95% CI: 0.860-0.904), a DCA curve maximum threshold probability of 0.41, and a maximum return of 7.86%. The internal validation accuracy was 0.869 (95% CI: 0.847-0.891), an AUC of 0.822 (95% CI: 0.801-0.843), a sensitivity of 0.938, a specificity of 0.422, a Matthews correlation coefficient of 0.392, and an F1 score of 0.925. In the external validation, the accuracy was 0.936 (95% CI: 0.913-0.959), an AUC of 0.853 (95% CI: 0.832-0.874), a sensitivity of 0.954, a specificity of 0.5, a Matthews correlation coefficient of 0.365, and an F1 score of 0.966. This indicates that the prediction model performed well in both internal and external validation.

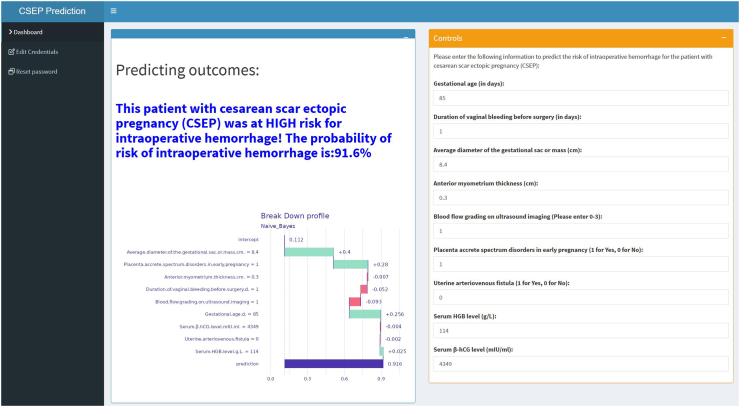
Interpretation: The developed prediction model, deployed in the network application, is capable of forecasting the risk of intraoperative hemorrhage during CSEP. This tool can facilitate targeted preoperative assessment and clinical decision-making for clinicians. Prospective data should be utilized in future studies to further validate the extended applicability of the model.

Funding: Natural Science Foundation of Shandong Province; Qilu Hospital of Shandong University.

Keywords: Cesarean scar ectopic pregnancy; Interpretable machine learning; Intraoperative hemorrhage; Prediction model; Visualization.


Conflict of interest statement

The authors declare no conflict of interest related to this work.

Figures

Fig. 1
Fig. 1
Flow chart for model development and validation.
Fig. 2
Fig. 2
The relationship between variables is depicted graphically using scatter plots, density plots, histograms, and box plots to gain insights into their distribution.
Fig. 3
Fig. 3
The Sankey diagram effectively illustrates the allocation of the research subject across various predictor variables.
Fig. 4
Fig. 4
The application will automatically estimate the likelihood of intraoperative hemorrhage in CSEP patients. CSEP: cesarean scar ectopic pregnancy.
Supplementary Fig. S1
Supplementary Fig. S1. Data distribution after imputation. The values on the horizontal axis respectively represent the number of multiple imputations, among which 0 represents the original data. The values on the vertical axis represent the range of values of the variable. The red dots represent the post-imputation data. When the post-imputation data falls within the range of values on the vertical axis, it indicates that the imputed data has a high degree of credibility.
Supplementary Fig. S2
Supplementary Fig. S2. The relationship between tree number and out-of-bag(20 characteristic variables).
Supplementary Fig. S3
Supplementary Fig. S3. Descending order of importance of 20 predictive variables, with the left showing MDA, and the right showing MDG. MDA: mean decrease accuracy; MDG: mean decrease gini.
Supplementary Fig. S4
Supplementary Fig. S4. List 20 predictive variables in descending order of importance.
Supplementary Fig. S5
Supplementary Fig. S5. The screening process of predictive variables(coefficient distribution).
Supplementary Fig. S6
Supplementary Fig. S6. The screening process of predictive variables(cross validation).
Supplementary Fig. S7
Supplementary Fig. S7. 9 non-zero predictive variables selected by Lasso regression screening.
Supplementary Fig. S8
Supplementary Fig. S8. The changing of importance scores of each variable during Boruta's running process. In these box plots, the red indicates the rejected features, the yellow indicates the features to be determined, and the blue respectively represents the significance of the minimum, average, and maximum shadow features, namely the magnitude of the Z-Score.
Supplementary Fig. S9
Supplementary Fig. S9. The changing of Z-scores during the running of Boruta. These curves respectively indicate the changing trends of the Z-Scores of the rejected features (red), the features to be determined (yellow), and the minimum, average, and maximum shadow features (blue) when the algorithm iterates 400 times.
Supplementary Fig. S10
Supplementary Fig. S10. The variables selected by XGBoost sorted by importance. XGBoost: Extreme Gradient Boosting.
Supplementary Fig. S11
Supplementary Fig. S11. Variable Wayne diagram screened by four methods.
Supplementary Fig. S12
Supplementary Fig. S12. The accuracy of each model. The error bars respectively represent the mean accuracy and the 95% confidence intervals of the eight models.
Supplementary Fig. S13
Supplementary Fig. S13. The ROC curve of each model.
Supplementary Fig. S14
Supplementary Fig. S14. The DCA curve of each model.
Supplementary Fig. S15
Supplementary Fig. S15. The ROC curve for internal validation.
Supplementary Fig. S16
Supplementary Fig. S16. The Lift curve for internal validation.
Supplementary Fig. S17
Supplementary Fig. S17. Confusion matrices for internal validation.
Supplementary Fig. S18
Supplementary Fig. S18. The ROC curve for external validation.
Supplementary Fig. S19
Supplementary Fig. S19. The Lift curve for external validation.
Supplementary Fig. S20
Supplementary Fig. S20. Confusion matrices for external validation.
Supplementary Fig. S21
Supplementary Fig. S21. The PDP for the average diameter of the gestational sac or mass. PDP: partial dependence plots.
Supplementary Fig. S22
Supplementary Fig. S22. The PDP for anterior myometrium thickness. PDP: partial dependence plots.
Supplementary Fig. S23
Supplementary Fig. S23. Prediction probability of individuals without intraoperative hemorrhage.
Supplementary Fig. S24
Supplementary Fig. S24. Prediction probability of individuals with intraoperative hemorrhage.

References

    1. Liu L., Ross W.T., Chu A.L., Deimling T.A. An updated guide to the diagnosis and management of cesarean scar pregnancies. Curr Opin Obstet Gynecol. 2020;32(4):255–262. - PubMed
    1. Tan K.L., Jiang L., Chen Y.M., et al. Local intra-gestational sac methotrexate injection followed by dilation and curettage in treating cesarean scar pregnancy. Arch Gynecol Obstet. 2020;302(2):439–445. - PubMed
    1. Ban Y., Shen J., Wang X., et al. Cesarean scar ectopic pregnancy clinical classification system with recommended surgical strategy. Obstet Gynecol. 2023;141(5):927–936. - PMC - PubMed
    1. De Braud L.V., Knez J., Mavrelos D., Thanatsis N., Jauniaux E., Jurkovic D. Risk prediction of major haemorrhage with surgical treatment of live cesarean scar pregnancies. Eur J Obstet Gynecol Reprod Biol. 2021;264:224–231. - PubMed
    1. Yang F., Yang X., Jing H., et al. MRI-based scoring model to predict massive hemorrhage during dilatation and curettage in patients with cesarean scar pregnancy. Abdom Radiol (NY) 2023;48(10):3195–3206. - PubMed

LinkOut - more resources