. 2024 Nov 30:45:363-387.
doi: 10.1016/j.bioactmat.2024.11.020. eCollection 2025 Mar.

Reduction reactions dominate the interactions between Mg alloys and cells: Understanding the mechanisms

Affiliations

Reduction reactions dominate the interactions between Mg alloys and cells: Understanding the mechanisms

Jua Kim et al. Bioact Mater. .

Abstract

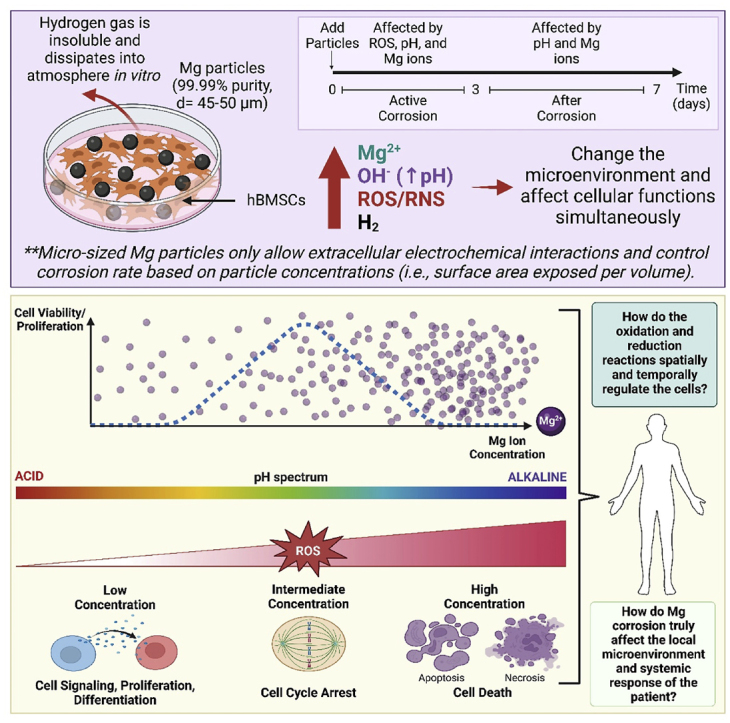
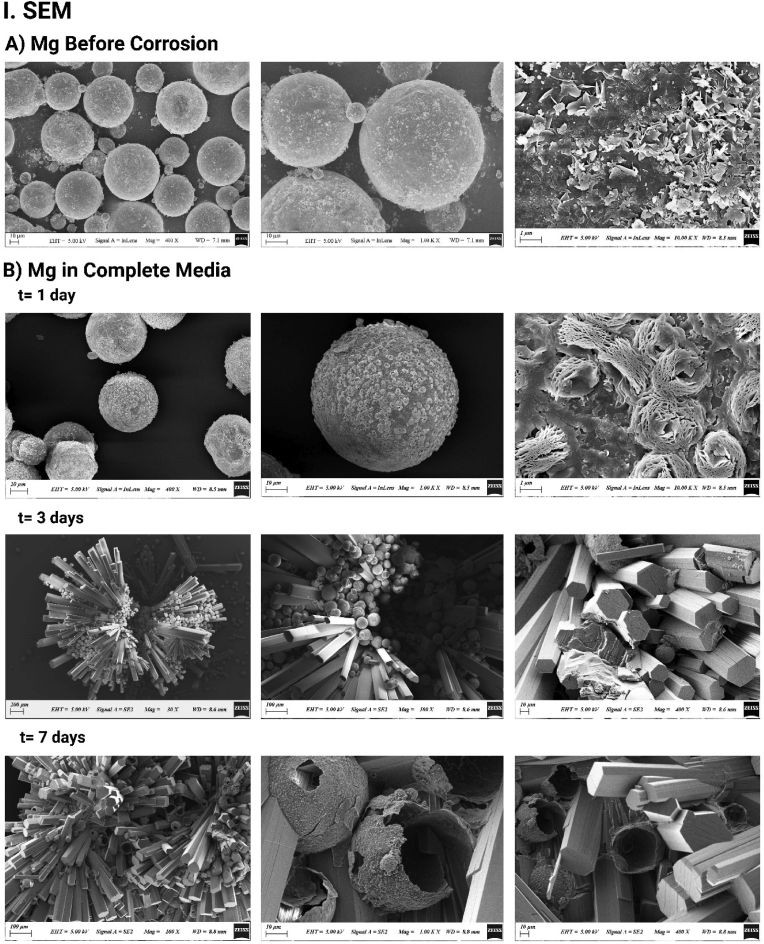
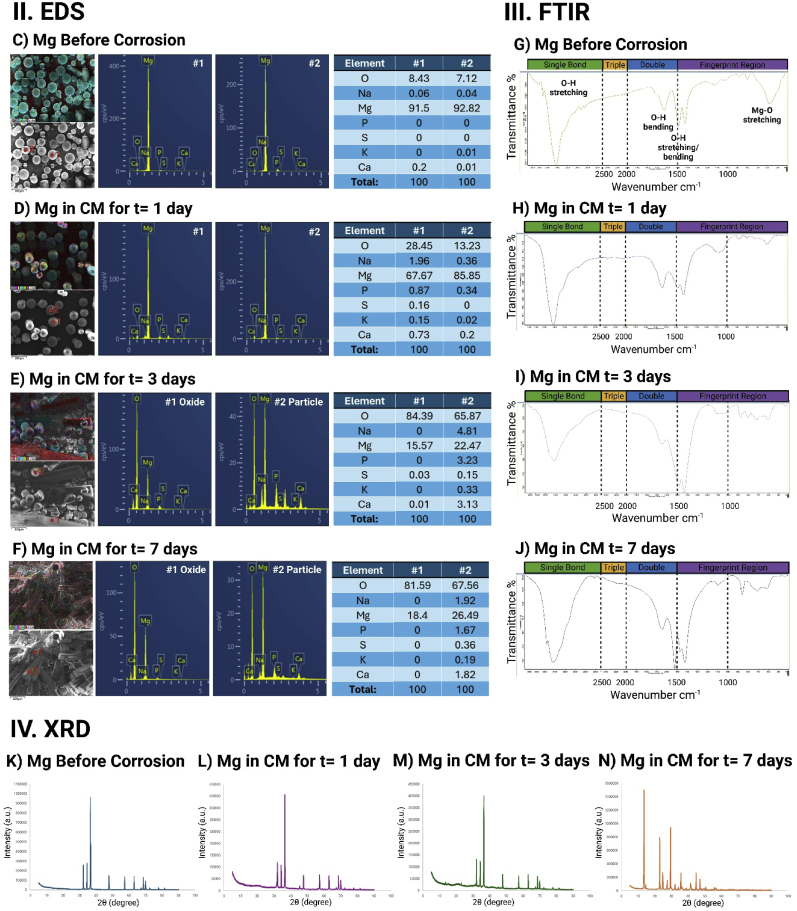
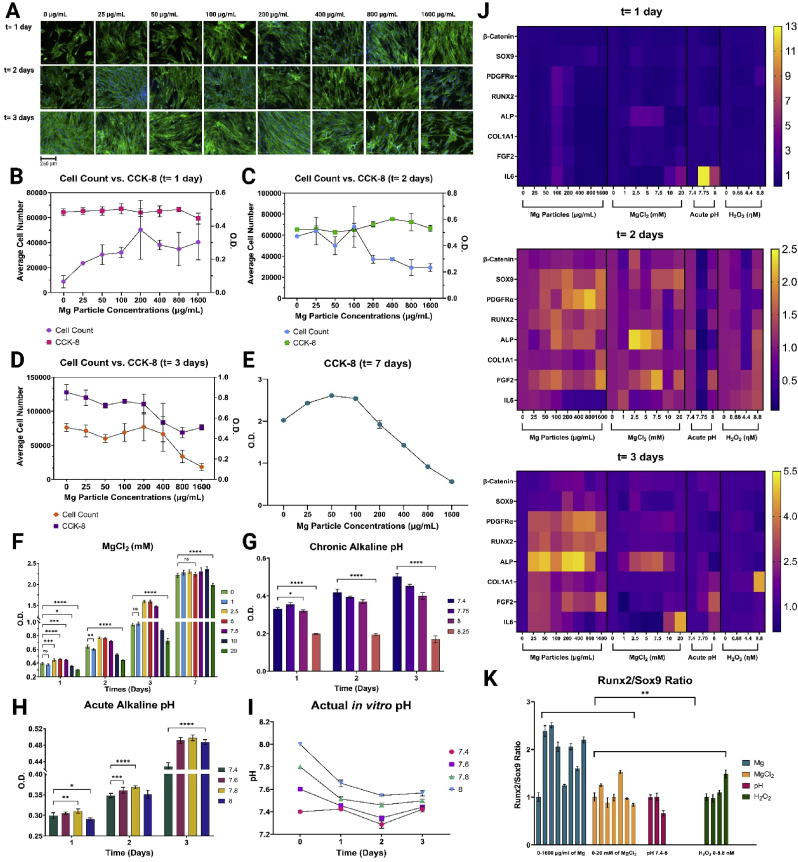
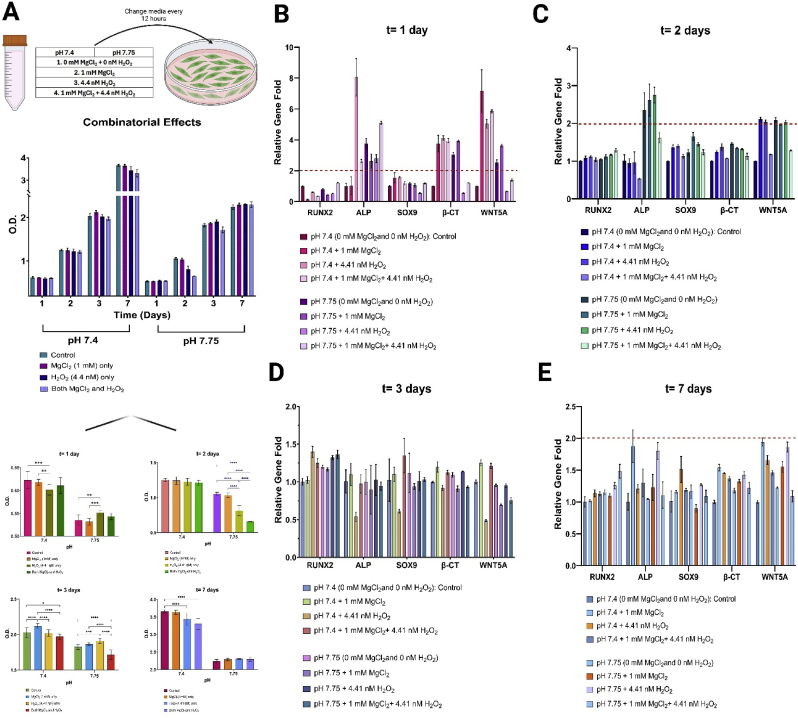
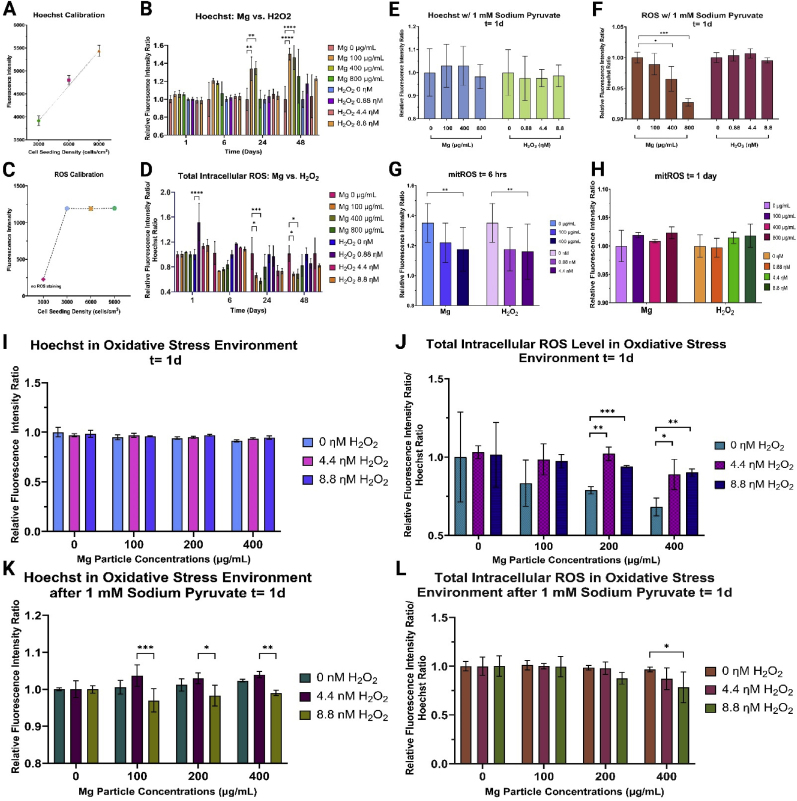
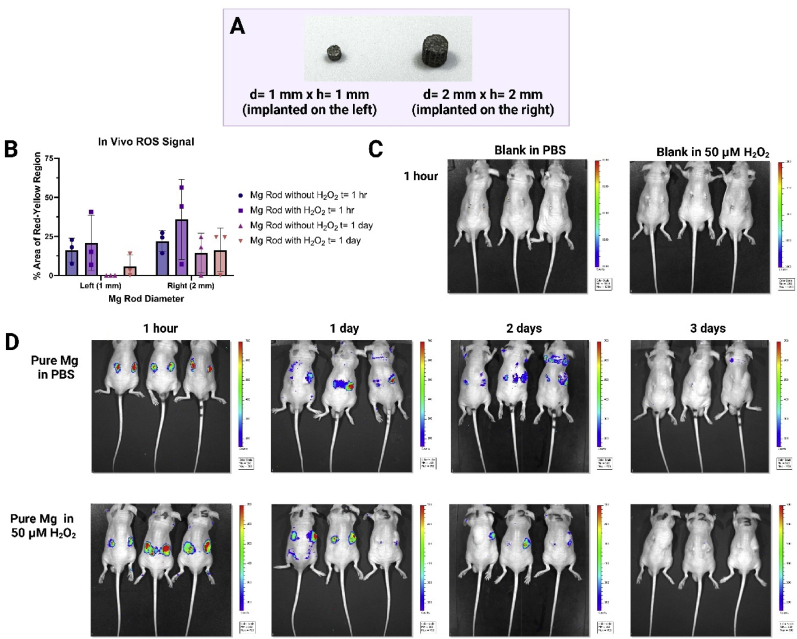
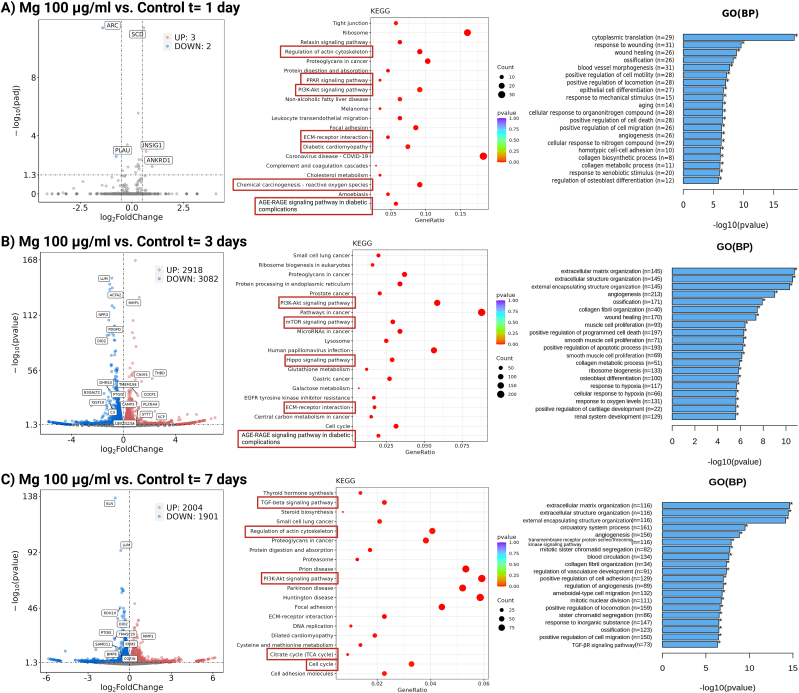
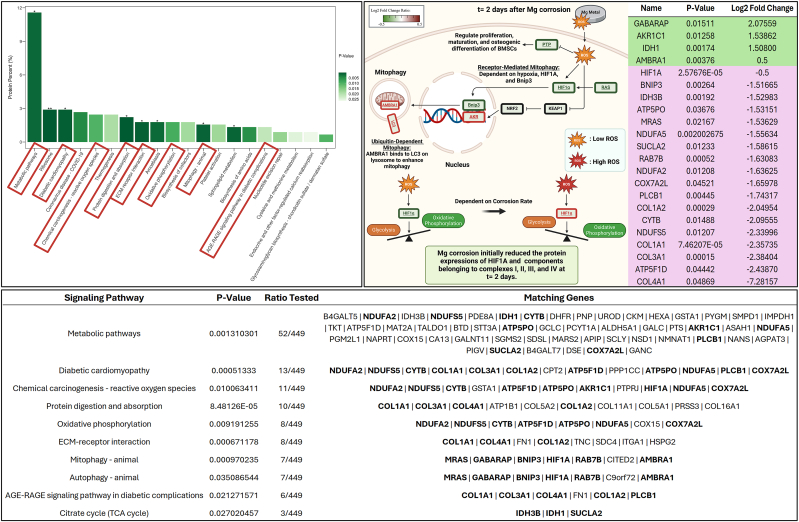
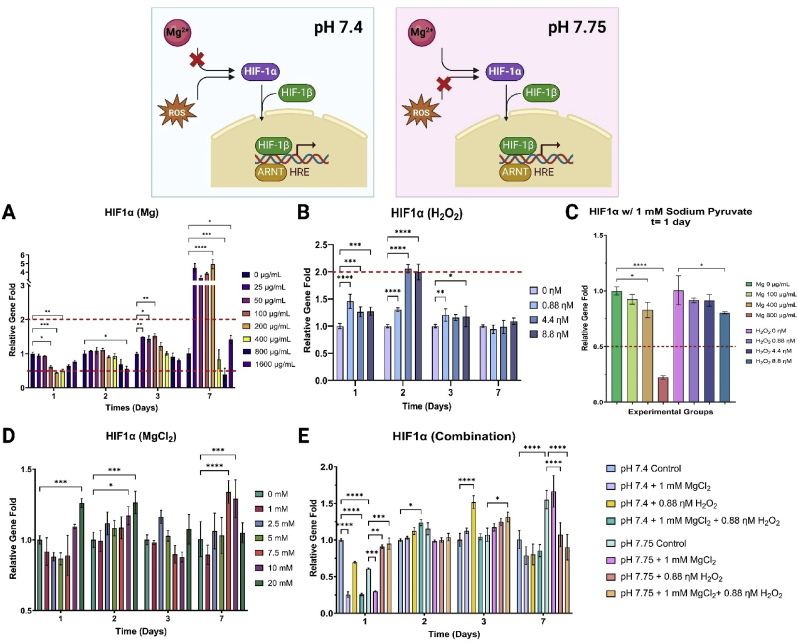
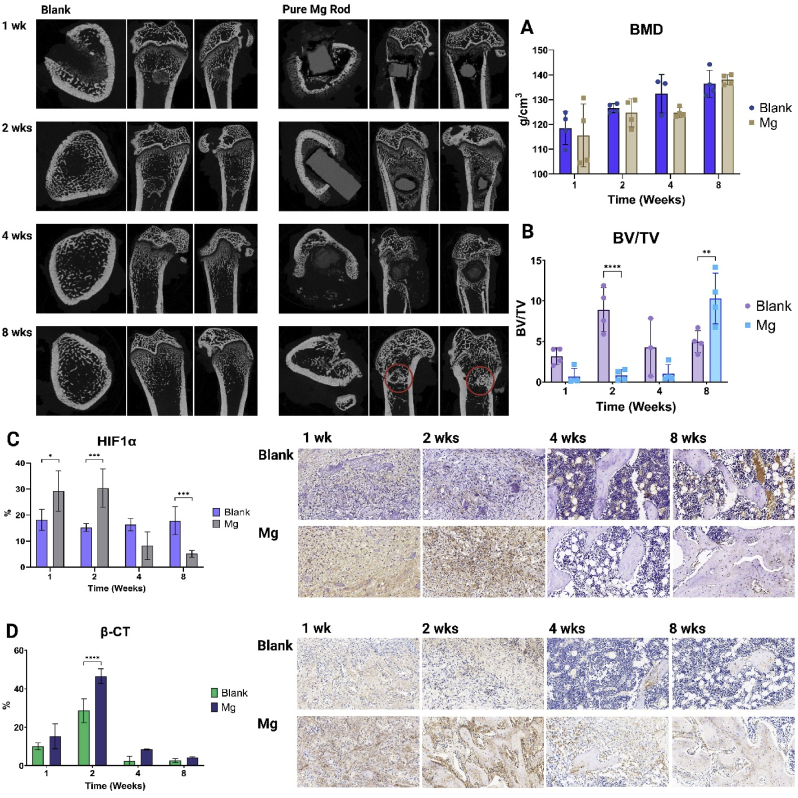
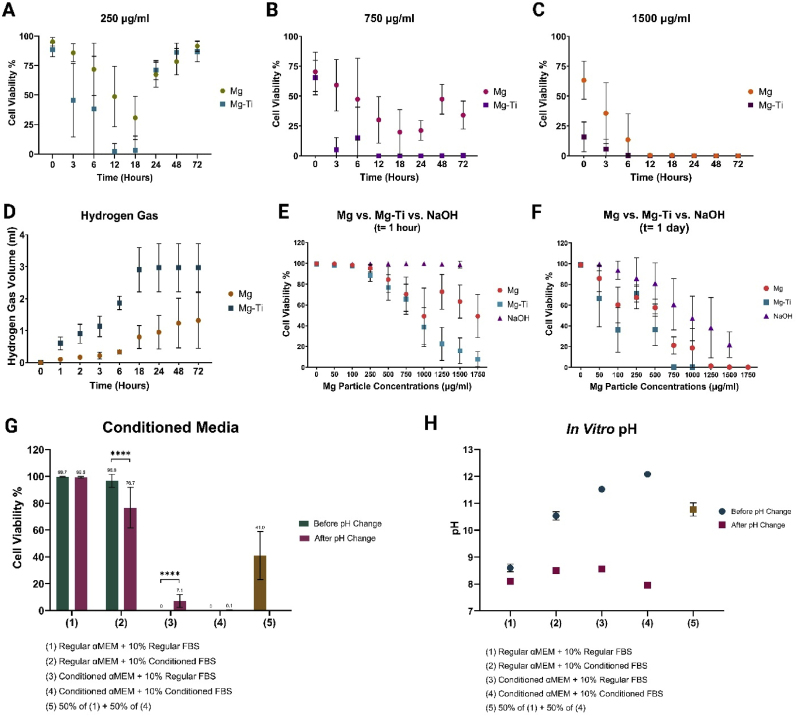
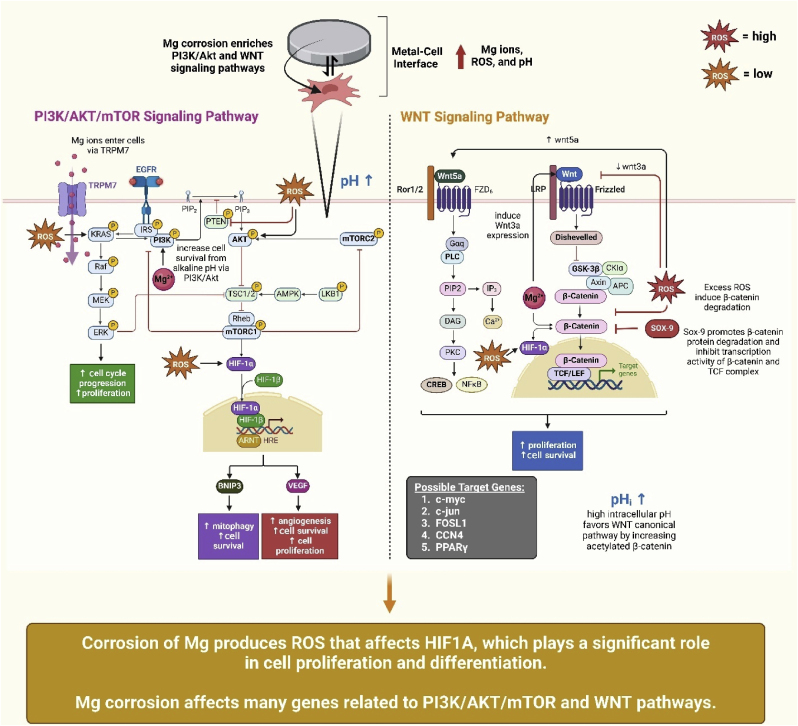
Magnesium (Mg) alloys are popular biodegradable metals studied for orthopedic and cardiovascular applications, mainly because Mg ions are essential trace elements known to promote angiogenesis and osteogenesis. However, Mg corrosion consists of oxidation and reduction reactions that produce by-products, such as hydrogen gas, reactive oxygen species, and hydroxides. It is still unclear how all these by-products and Mg ions concomitantly alter the microenvironment and cell behaviors spatially and temporally. This study shows that Mg corrosion can enhance cell proliferation by reducing intracellular ROS. However, Mg cannot decrease ROS and promote cell proliferation in simulated inflammatory conditions, meaning the microenvironment is critical. Furthermore, cells may respond to Mg ions differently in chronic or acute alkaline pH or oxidative stress. Depending on the corrosion rate, Mg modulates HIF1α and many signaling pathways like PI3K/AKT/mTOR, mitophagy, cell cycle, and oxidative phosphorylation. Therefore, this study provides a fundamental insight into the importance of reduction reactions in Mg alloys.

Keywords: Alkaline pH; Electrochemical reactions; Magnesium alloys; Mg ions; Reactive oxygen species.


Conflict of interest statement

The authors declare the following personal relationships which may be considered as potential competing interests: Haobo Pan is currently employed by Shenzhen Healthemes Biotechnology Co. Ltd. Haobo Pan is an editorial board member for Bioactive Materials and was not involved in the editorial review or the decision to publish this article.

Figures

Image 1
Graphical abstract
Fig. 1
Fig. 1
A) SEM images of Mg particles before corrosion. B) SEM images of Mg particles corroded in complete media (αMEM + 10 % FBS + 1 % PS) for t = 1, 3, or 7 days. EDS showing elemental analysis for Mg particles C) before corrosion and corroded in complete media for D) t = 1 day, E) t = 3 days, and F) t = 7 days. FTIR spectrum of Mg of G) before corrosion and corroded in complete media for H) t = 1 day, I) t = 3 days, and J) t = 7 days. X-ray diffraction patterns of Mg K) before corrosion and corroded in complete media for L) t = 1 day, M) t = 3 days, and N) t = 7 days.
Fig. 1
Fig. 1
A) SEM images of Mg particles before corrosion. B) SEM images of Mg particles corroded in complete media (αMEM + 10 % FBS + 1 % PS) for t = 1, 3, or 7 days. EDS showing elemental analysis for Mg particles C) before corrosion and corroded in complete media for D) t = 1 day, E) t = 3 days, and F) t = 7 days. FTIR spectrum of Mg of G) before corrosion and corroded in complete media for H) t = 1 day, I) t = 3 days, and J) t = 7 days. X-ray diffraction patterns of Mg K) before corrosion and corroded in complete media for L) t = 1 day, M) t = 3 days, and N) t = 7 days.
Fig. 2
Fig. 2
A) hBMSCs treated with different concentrations of Mg particles between 0 and 1600 μg/mL, then fixed and stained with DAPI (nucleus, blue) and Phalloidin-488 (actin, green) over time t = 1–3 days. Cell count and CCK-8 analysis showing cell viability and proliferation after Mg particle treatment for B) t = 1 day, C) t = 2 days, D) t = 3 days, and E) t = 7 days (for 7 days, only CCK-8 value is shown). hBMSC proliferation shown as optical density after F) 0–20 mM of MgCl2 treatment, G) chronic alkaline pH from 7.4 to 8.25 replenished every 12 h, and H) acute alkaline pH between 7.4 and 8. I) Actual in vitro pH measured for the acute pH experiment as the pH fell over time due to 5 % CO2 incubation. J) qPCR measuring relative gene expressions levels for hBMSCs treated with different concentrations of either Mg particles, MgCl2, alkaline pH (acute), or H2O2 for t = 1–3 days. K) Runx2/Sox9 ratio taken from qPCR measurements to show the potential of osteogenesis, where Mg particles showed the highest Runx2/Sox9 ratio over 2-fold compared to the other groups. Two-way ANOVA analysis was used to find statistical significance using GraphPad Prism 10.2 software, where ∗p < 0.05, ∗∗p < 0.01, ∗∗∗p < 0.001, and ∗∗∗∗p < 0.0001.
Fig. 3
Fig. 3
hBMSCs were treated in either just Mg ions, H2O2, or both at either pH of 7.4 or 7.75 with media replenished every 12 h for t = 1–7 days. A) hBMSC proliferation measured in optical density and B) relative gene expressions of Runx2, ALP, Sox9, beta-catenin, and DKK1. Two-way ANOVA analysis was used to find statistical significance using GraphPad Prism 10.2 software, where ∗p < 0.05, ∗∗p < 0.01, ∗∗∗p < 0.001, and ∗∗∗∗p < 0.0001.
Fig. 4
Fig. 4
A) Hoechst calibration shows that Hoechst measurement is dependent on cell numbers. B) Hoechst measurement after treating hBMSCs with either Mg 0–800 μg/mL or H2O2 0–8.8 ηM from 1 h to 2 days. C) ROS calibration showing ROS fluorescence intensity measurement at different cell seeding densities from 3000 to 9000 cells/cm2. Cells at 3000 cells/cm2 were also measured without ROS staining. E) Hoechst and F) total intracellular ROS levels after Mg or H2O2 treatment and 1 mM sodium pyruvate for t = 1 day. I) Hoechst and J) total intracellular ROS levels after Mg particle treatment in oxidative stress environment for t = 1 day. K) Hoechst and L) total intracellular ROS levels after Mg particle treatment in oxidative stress environment with 1 mM of sodium pyruvate for t = 1 day. Two-way ANOVA analysis was used to find statistical significance using GraphPad Prism 10.2 software, where ∗p < 0.05, ∗∗p < 0.01, ∗∗∗p < 0.001, and ∗∗∗∗p < 0.0001.
Fig. 5
Fig. 5
A) Mg implant rods that were implanted in Balb/c nude mice. Two different sizes of Mg were implanted in the same mice. B) Total intracellular ROS signals detected after implantation of either 1 mm (left) and 2 mm (right) diameter pure Mg rods subcutaneously in mice for either t = 1 h or 1 day. Images of C) blank controls without Mg rods, either injected with PBS or 50 μM H2O2 into the subcutaneous pocket (about 200 mL of volume) to show that without Mg rods, there is no ROS detection. D) Pure Mg rods were inserted with either PBS or 50 μM H2O2 solution over time from 1 h to 3 days until no ROS signal was detected. The min and max thresholds used to detect for blank groups were min = 1000 and max = 1200 and for Mg groups min = 160 and max = 700. Two-way ANOVA analysis was used to find statistical significance using GraphPad Prism 10.2 software, where ∗p < 0.05, ∗∗p < 0.01, ∗∗∗p < 0.001, and ∗∗∗∗p < 0.0001.
Fig. 6
Fig. 6
Transcriptome sequencing of hBMSCs treated with Mg 100 μg/mL for A) t = 1 day, B) t = 3 days, and C) t = 7 days compared to the control group (no particle treatment). KEGG pathway analysis shows that pathways enriched include PI3K/Akt pathway for all time points. Other enrichment pathways include ECM-receptor interaction, AGE-RAGE signaling pathway in diabetic complications, TGF-beta signaling pathway, cell cycle/citrate cycle, chemical carcinogenesis-reactive oxygen species (ROS).
Fig. 7
Fig. 7
Proteome analysis after Mg treatment for t = 2 days. Enriched pathways found in proteome analysis matched enrichment pathways found from transcriptome sequencing, including chemical carcinogenesis- ROS, mitophagy, AGE-RAGE, citrate cycle, ECM-receptor interactions, and so forth.
Fig. 8
Fig. 8
HIF1α gene expressions for hBMSCs treated with A) Mg particles, B) H2O2, C) Mg or H2O2 with 1 mM sodium pyruvate, D) MgCl2, and E) combinations of Mg ions and H2O2 in different pH levels (chronic). Two-way ANOVA analysis was used to find statistical significance using GraphPad Prism 10.2 software, where ∗p < 0.05, ∗∗p < 0.01, ∗∗∗p < 0.001, and ∗∗∗∗p < 0.0001.
Fig. 9
Fig. 9
In vivo bone defect femur analysis. Bone was drilled in 2 mm size and either pure Mg rod (d = 2 mm x h = 5 mm) was implanted or left blank. BMD and BV/TV were analyzed from the micro-CT. IHC staining was done to measure HIF1α and β-catenin expressions in tissues, which was analyzed using Image J and IHC Toolbox (https://imagej.net/ij/plugins/ihc-toolbox/). Two-way ANOVA analysis was used to find statistical significance using GraphPad Prism 10.2 software, where ∗p < 0.05, ∗∗p < 0.01, ∗∗∗p < 0.001, and ∗∗∗∗p < 0.0001.
Fig. 10
Fig. 10
MC3T3-E1 cell viability after Mg or Mg-Ti treatment of A) 250, B) 750, and C) 1500 μg/mL from t = 0–72 h. D) Hydrogen gas volume measured during corrosion of 0.05 g of Mg or Mg-Ti in 5 mL pipette with funnel in a 30 mL complete media solution. MC3T3-E1 cell viability after treating cells with different concentrations of Mg, Mg-Ti (0–1750 μg/mL), or NaOH that resulted in alkaline pH between 7 and 11 for E) t = 1 h and F) t = 1 day. G) MC3T3-E1 cell viability after treating cells in different conditioned media groups before and after adjusting pH using HCl, and H) actual in vitro pH before and after adjustment.
Fig. 11
Fig. 11
Schematic illustrations show major signaling pathways affected by Mg corrosion, confirmed with transcriptome sequencing, proteome analysis, and qPCR, as well as supported by other references to encapsulate how reduction reactions affect the following pathways [[101], [102], [103], [104], [105]].

Similar articles

References

    1. Montoya C., Du Y., Gianforcaro A.L., Orrego S., Yang M., Lelkes P.I. On the road to smart biomaterials for bone research: definitions, concepts, advances, and outlook. Bone Res. 2021;9:12. doi: 10.1038/s41413-020-00131-z. - DOI - PMC - PubMed
    1. Global metal implants and medical alloys market size, share, growth analysis, by material type (titanium and titanium alloys, stainless steel), by product type(orthopedic implants, dental implants), by application (Joint replacement, trauma and orthopedic surgeries) - industry forecast 2023-2030. Skyquest. 2024 https://www.skyquestt.com/report/metal-implants-and-medical-alloys-marke... %20is%20the%20global%20market,period%20(2023%2D2030)
    1. Gilbert J.L., Sivan S., Liu Y., Kocagӧz S.B., Arnholt C.M., Kurtz S.M. Direct in vivo inflammatory cell-induced corrosion of CoCrMo alloy orthopedic implant surfaces. Biomed Mater Res A. 2015;103:211–223. doi: 10.1002/jbm.a.35165. - DOI - PMC - PubMed
    1. Lee H., Kurtz M.A., Gilbert J.L. Reactive oxygen species, electrode potential and pH affect CoCrMo alloy corrosion and semiconducting behavior in simulated inflammatory environments. Acta Biomater. 2024 doi: 10.1016/j.actbio.2024.08.010. - DOI - PubMed
    1. Kurtz M.A., Khullar P., Gilbert J.L. Cathodic activation and inflammatory species are critical to simulating in vivo Ti-6Al-4V selective dissolution. Acta Biomater. 2022;149:399–409. doi: 10.1016/j.actbio.2022.07.020. - DOI - PubMed

LinkOut - more resources