

Genotype But Not Body Shape Predicts River Migration Success in Atlantic Salmon
- PMID: 39687579
- PMCID: PMC11647181
- DOI: 10.1002/ece3.70682
Genotype But Not Body Shape Predicts River Migration Success in Atlantic Salmon
Abstract
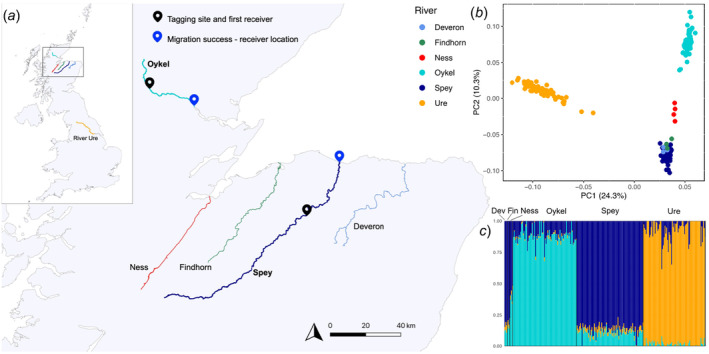
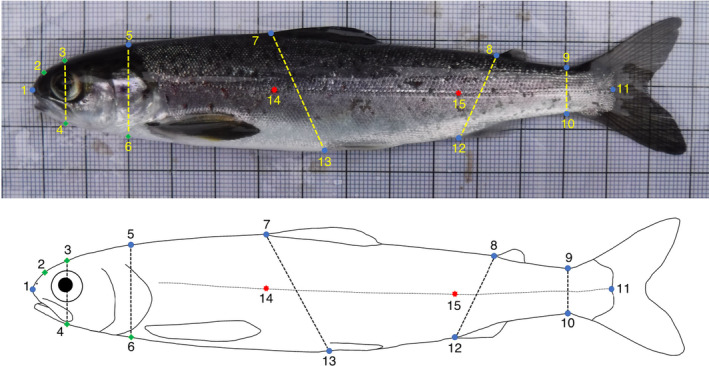
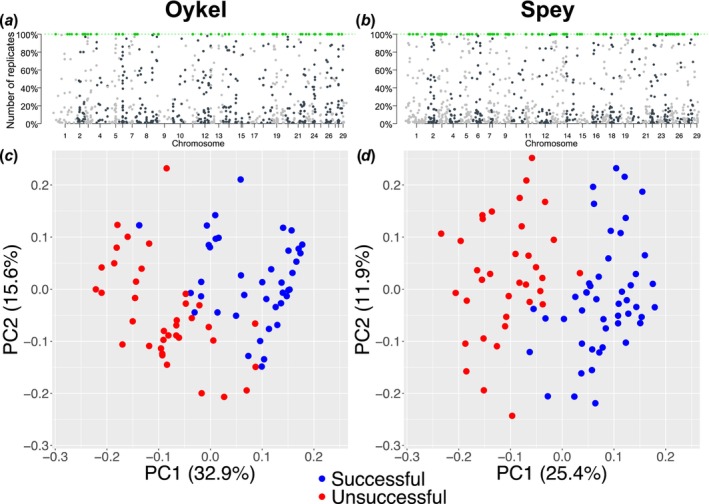
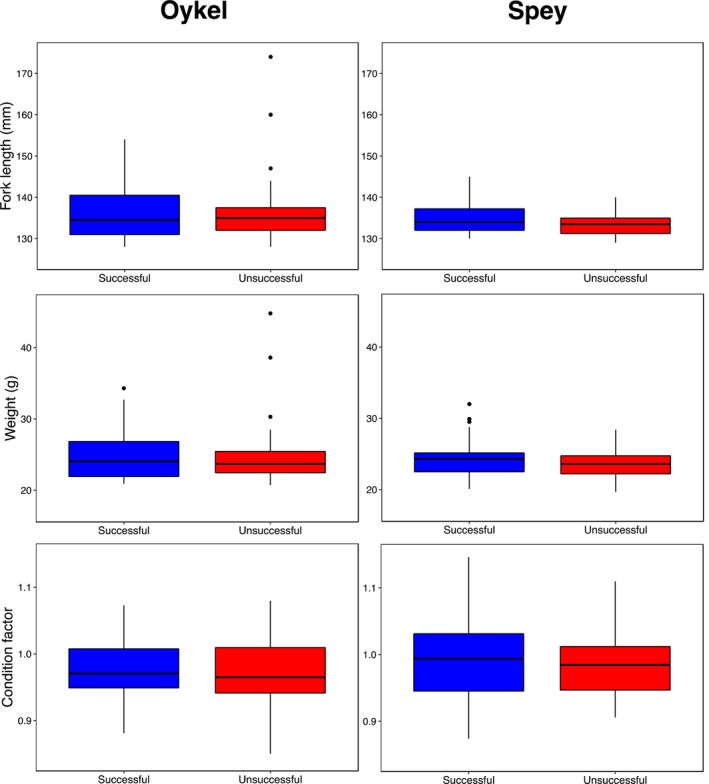
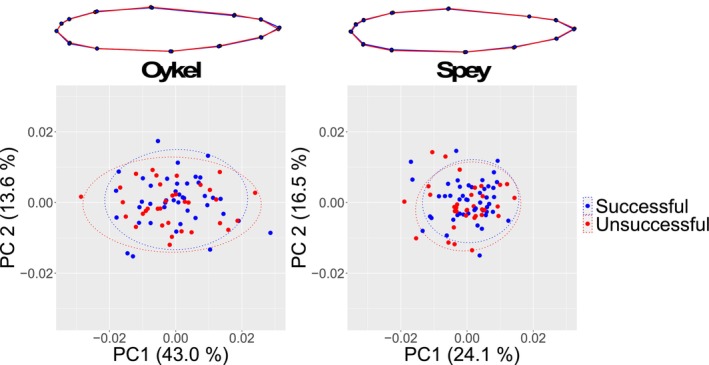
Migratory species typically undertake demanding long-distance journeys, across different habitat types during which they are exposed to multiple natural and anthropogenic stressors. Mortality during migration is typically high and may be human induced. Understanding individual responses to these selection pressures is rarely attempted because of the challenges of relating individual phenotypic and genetic data to migration success. Here, we show distinct single nucleotide polymorphism (SNP) sets significantly differentiated between Atlantic salmon smolts making successful migrations to sea and those that failed to migrate, in two different rivers. In contrast, morphological variation was not diagnostic of migration success. Populations from each river were genetically distinct, and while different genes were possibly implicated in migration success in each river, they related to common biological processes (e.g., osmoregulation and immune and stress response). Given that migration failure should quickly purge polymorphism at selected SNPs from a population, the question of how genetic diversity in these populations is maintained is an important one. Standing genetic variation could be maintained by different life history strategies and/or environmentally driven balancing selection. Our work highlights the importance of preserving genetic diversity to ensure evolutionary resilience at the population level and has practical implications for management.
Keywords: SNPs; animal migration; genome scan; geometric morphometrics; salmon; telemetry.
© 2024 The Author(s). Ecology and Evolution published by John Wiley & Sons Ltd.
Conflict of interest statement
The authors declare no conflicts of interest.
Figures
Similar articles
-
Migration patterns and navigation cues of Atlantic salmon post-smolts migrating from 12 rivers through the coastal zones around the Irish Sea.J Fish Biol. 2024 Jan;104(1):265-283. doi: 10.1111/jfb.15591. Epub 2023 Nov 8. J Fish Biol. 2024. PMID: 37843923
-
Investigating the behaviour of Atlantic salmon (Salmo salar L.) post-smolts during their early marine migration through the Clyde Marine Region.J Fish Biol. 2022 Nov;101(5):1285-1300. doi: 10.1111/jfb.15200. Epub 2022 Sep 8. J Fish Biol. 2022. PMID: 36053776 Free PMC article.
-
Lake shape and the characteristics of migration behavior modify Atlantic salmon smolt migration success through lakes.J Fish Biol. 2025 Feb;106(2):538-551. doi: 10.1111/jfb.15972. Epub 2024 Oct 23. J Fish Biol. 2025. PMID: 39444193 Free PMC article.
-
A critical review of adaptive genetic variation in Atlantic salmon: implications for conservation.Biol Rev Camb Philos Soc. 2007 May;82(2):173-211. doi: 10.1111/j.1469-185X.2006.00004.x. Biol Rev Camb Philos Soc. 2007. PMID: 17437557 Review.
-
A critical life stage of the Atlantic salmon Salmo salar: behaviour and survival during the smolt and initial post-smolt migration.J Fish Biol. 2012 Jul;81(2):500-42. doi: 10.1111/j.1095-8649.2012.03370.x. J Fish Biol. 2012. PMID: 22803722 Review.
References
-
- Adams, D. C. , Collyer M., Kaliontzopoulou A., and Baken E.. 2021. “Geomorph: Software for Geometric Morphometric Analyses. R Package Version 4.0.2.” https://cran.r‐project.org/package=geomorph.
-
- Alerstam, T. , Hedenström A., and Åkesson S.. 2003. “Long‐Distance Migration: Evolution and Determinants.” Oikos 103: 247–260. 10.1034/j.1600-0706.2003.12559.x. - DOI
-
- Assumpção, L. D. , Makrakis M. C., Makrakis S., et al. 2012. “The Use of Morphometric Analysis to Predict the Swimming Efficiency of Two Neotropical Long‐Distance Migratory Species in Fish Passage.” Neotropical Ichthyology 10: 797–804. 10.1590/S1679-62252012000400012. - DOI
-
- Baken, E. K. , Collyer M. L., Kaliontzopoulou A., and Adams D. C.. 2021. “Geomorph v4.0 and gmShiny: Enhanced Analytics and a New Graphical Interface for a Comprehensive Morphometric Experience.” Methods in Ecology and Evolution 12: 2355–2363. 10.1111/2041-210X.13723. - DOI
LinkOut - more resources
Full Text Sources
