

Virulence Evolution via Pleiotropy in Vector-Borne Plant Pathogens
- PMID: 39687580
- PMCID: PMC11646936
- DOI: 10.1002/ece3.70741
Virulence Evolution via Pleiotropy in Vector-Borne Plant Pathogens
Abstract
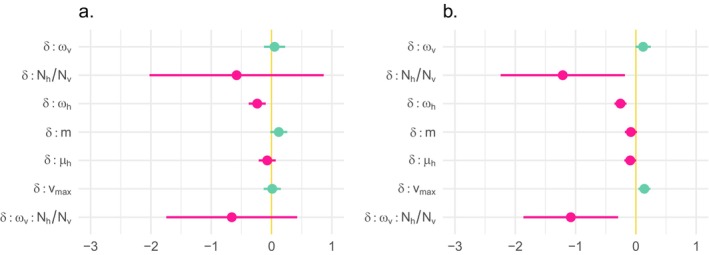
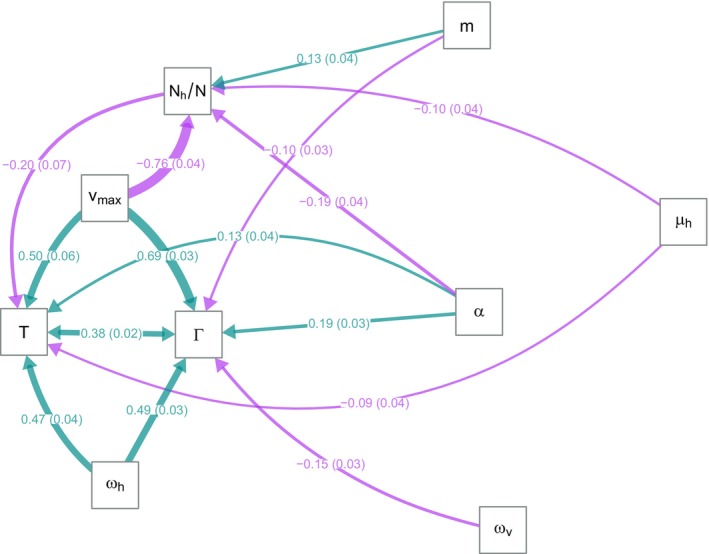
The dynamics of virulence evolution in vector-borne plant pathogens can be complex. Here, we use individual-based, quantitative-genetic simulations to investigate how virulence evolution depends on genetic trade-offs and population structure. Although quite generic, the model is inspired by the ecology of the plant-pathogenic bacterium Xylella fastidiosa, and we use it to gain insights into possible modes of virulence evolution in that group. In particular, we aim to sharpen our intuition about how virulence may evolve over short time scales via antagonistically pleiotropic alleles affecting pathogen performance within hosts and vectors. We find that even when pathogens find themselves much more often in hosts than vectors, selection in the vector environment can cause correlational and potentially non-adaptive changes in virulence in the host. The extent of such correlational virulence evolution depends on many system parameters, including the pathogen transmission rate, the proportion of the pathogen population occurring in hosts, the strengths of selection in host and vector environments, and the functional relationship between pathogen load and virulence. But there is a statistical interaction between the strength of selection in vectors and the proportion of the pathogen population in hosts, such that if within-vector selection is strong enough, over the short term, it can dominate virulence evolution, even when the host environment predominates.
© 2024 The Author(s). Ecology and Evolution published by John Wiley & Sons Ltd.
Conflict of interest statement
The authors declare no conflicts of interest.
Figures
Similar articles
-
Evolutionary consequences of vector-borne transmission: how using vectors shapes host, vector and pathogen evolution.Parasitology. 2022 Nov;149(13):1667-1678. doi: 10.1017/S0031182022001378. Epub 2022 Oct 6. Parasitology. 2022. PMID: 36200511 Free PMC article. Review.
-
Vector-Borne Pathogen and Host Evolution in a Structured Immuno-Epidemiological System.Bull Math Biol. 2017 Feb;79(2):325-355. doi: 10.1007/s11538-016-0239-0. Epub 2016 Dec 28. Bull Math Biol. 2017. PMID: 28032207
-
The role of the ratio of vector and host densities in the evolution of transmission modes in vector-borne diseases. The example of sylvatic Trypanosoma cruzi.J Theor Biol. 2012 Nov 7;312:133-42. doi: 10.1016/j.jtbi.2012.07.028. Epub 2012 Aug 7. J Theor Biol. 2012. PMID: 22892441
-
Coevolutionary dynamics of host-pathogen interaction with density-dependent mortality.J Math Biol. 2022 Jul 25;85(2):15. doi: 10.1007/s00285-022-01782-8. J Math Biol. 2022. PMID: 35877051 Free PMC article.
-
Insect-Borne Plant Pathogens and Their Vectors: Ecology, Evolution, and Complex Interactions.Annu Rev Entomol. 2018 Jan 7;63:169-191. doi: 10.1146/annurev-ento-020117-043119. Epub 2017 Oct 2. Annu Rev Entomol. 2018. PMID: 28968147 Review.
References
-
- Bates, D. 2003. “lme4: Linear Mixed‐Effects Models using ‘Eigen’ and S4.” 10.32614/CRAN.package.lme4. - DOI
LinkOut - more resources
Full Text Sources
