. 2024 Dec 2:15:1483346.
doi: 10.3389/fimmu.2024.1483346. eCollection 2024.

Spatial transcriptomics and in situ immune cell profiling of the host ectocervical landscape of HIV infected Kenyan sex working women

Affiliations

Spatial transcriptomics and in situ immune cell profiling of the host ectocervical landscape of HIV infected Kenyan sex working women

Mathias Franzén Boger et al. Front Immunol. .

Abstract

Introduction: Chronic immune activation is a hallmark of human immunodeficiency virus (HIV) infection that significantly impacts disease pathogenesis. However, in-depth studies characterizing the immunological landscape of the ectocervix during chronic HIV infection remain scarce despite the importance of this tissue site for HIV transmission.

Methods: Ectocervical tissue samples were obtained from antiretroviral-naïve HIV-seropositive and -seronegative Kenyan female sex workers. These samples were assessed by spatial transcriptomics and Gene Set Enrichment Analysis. We further performed multi-epitope ligand cartography (MELC) using an in situ staining panel that included 17 markers of primarily T cell-mediated immune responses.

Results: Spatial transcriptomics revealed tissue-wide immune activation encompassing immune responses associated with chronic HIV infection. First, both the epithelial and submucosal compartments showed diverse but significant upregulation of humoral immune responses, as indicated by the expression of several antibody-related genes. Second, an antiviral state-associated cellular immunity was also observed in the HIV-seropositive group, characterized by upregulation of genes involved in interferon signaling across the mucosal tissue and a more spatially restricted mucosal expression of genes related to T cell activity and effector functions relative to the HIV-seronegative group. Additionally, HIV associated structural alterations were evident within both compartments. Downregulated genes across the epithelium were mainly linked to epithelial integrity, with the outer layer involved in terminal differentiation and the inner layer associated with epithelial structure. MELC analysis further revealed a significantly increased ectocervical leukocyte population in HIV-seropositive participants, primarily driven by an increase in CD8+ T cells while the CD4+ T cell population remained stable. Consistent with our spatial transcriptomics data, T cells from HIV-seropositive participants showed an increased effector phenotype, defined by elevated expression of various granzymes.

Conclusion: By combining spatial transcriptomics and MELC, we identified significant HIV-associated cervical immune activity driven by induction of both T and B cell activity, together with a general antiviral state characterized by sustained interferon induction. These findings underscore that chronic HIV infection is associated with an altered ectocervical mucosal immune landscape years after primary infection. This sheds light on HIV pathogenesis at distant local sites and complements current knowledge on HIV-associated systemic immune activation.

Keywords: B cells; HIV; T cells; interferon; mucosal immunology; multi-epitope ligand cartography; spatial transcriptomics.


Conflict of interest statement

The authors declare that the research was conducted in the absence of any commercial or financial relationships that could be construed as a potential conflict of interest.

Figures
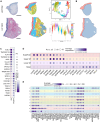
Figure 1
Figure 1
Overview of the ectocervical transcriptional profiles within the epithelial and submucosal compartments. (A) Examples images of H&E staining of ectocervical tissue samples from the HIV+FSWs (upper) and the HIVFSWs (lower) and unsupervised clustering determined by UMAP analysis of gene expression profiles plotted on ectocervical tissue (Pat-ID P023 and P067). A total of 13 clusters were identified (four epithelial and nine submucosal); the RNA count in each cluster is listed as an indication of cell density (lower right). (B) Manual classification of ectocervical tissue into epithelial and submucosal regions based on morphology to assess the gene expression profile within each compartment. (C) The top genes differentially expressed in the manually annotated epithelial vs. submucosal regions. (D, E) The top five individual marker genes expressed in each of the (D) four epithelial clusters and (E) nine submucosal clusters compared to all other clusters are shown. Scale bars represent 0.5 mm. H&E, hematoxylin and eosin; FSW, female sex worker; UMAP, uniform manifold approximation and projection.
Figure 2
Figure 2
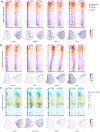
Differential ectocervical gene expressions associated with chronic HIV infection. The spatiotemporal dynamics of gene expression is here demonstrated at the individual spot level. Spots are ordered by similarity in gene expression, resulting in a pseudo measurement of distance across the mucosa. The color codes represent different clusters. (A) Selected upregulated genes within all four epithelial layers (Y-axis) in HIV+FSW and HIVFSW plotted relative to the expression (X-axis) of selected genes with gene expression values plotted on tissue below. (B) Selected upregulated genes within the superficial layer (PLSCR1), upper intermediate (IRF1) and the lower intermediate and basal layer (ANXA1) as well as across all epithelial layers the KRT1 gene was downregulated, comparing HIV+FSWs with HIVFSWs, with gene expression values plotted on tissue below. (C) Selected upregulated genes across cluster 4, 10 and 1 (IGHG2), cluster 4 and 1 (HLA-DRB1) and cluster 4 (GZMA and NKG7) in HIV+ vs. HIVFSWs, with gene expression plotted on tissue below. Plotted individuals: Pat-ID P023 and P067. FSW, female sex worker; DEG, differentially expressed gene. IM, intermediate layer.
Figure 3
Figure 3
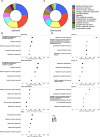
Altered major biological pathways associated with chronic HIV infection. Gene expression profiles within all clusters identified by spatial transcriptomics were subjected to GSEA using the GO database. (A) The GO terms enriched in HIV+FSW vs. HIV-FSWs were summarized using GO Slim to identify the major HIV-associated altered biological pathways within the epithelium, and (B) the top 5 enriched GO terms (partly functionally overlapping) of the four epithelial layers. (C) The summarized GO slim terms of the submucosa, and (D) the top 5 enriched GO terms (partly functionally overlapping) of three submucosal clusters 4, 10 and 1. Figure A and C depict the percentage of pathways that were categorized within each higher-level pathway. GO, Gene Ontology; GSEA, Gene Set Enrichment Analysis; FSW, female sex worker.
Figure 4
Figure 4
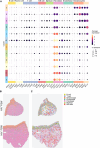
Visualization of the cell populations present within the ectocervix. (A) The average gene expression levels of cell markers for the distinct cell populations present within the clusters identified in the cervix. (B) Relative gene expression levels of the select cell markers in each spot illustrated as a pie chart plotted on tissue (Pat-ID P023 and P067). (C) Given the predominance of keratinocytes and fibroblasts across the analyzed tissue, keratinocyte- and fibroblast-related genes were excluded to better visualize immune cell distribution in tissue of HIV+FSWs and HIVFSWs. FSW, female sex worker.
Figure 5
Figure 5
Altered cervical immune cell populations are present in women with chronic HIV infection. (A) UMAP analysis followed by unsupervised clustering of ectocervical leukocytes from MELC-stained tissue sections. (B) Feature plot visualizing cellular protein expression levels of CD3, CD8, CD4, and CD69. (C) Dot plot visualizing MFI levels of individual markers within each cluster. (D) UMAP plot showing the clustering and leukocyte prevalence within the HIV+FSWs and HIVFSWs. (E) Bar chart showing the frequencies (upper) and total counts (lower) of cells within each cluster in the two study groups. Statistical significance was determined using the Mann–Whitney U test with significance set at P < 0.05. *, P < 0.05; **, P < 0.01. FSW, female sex worker; MELC, multi-epitope ligand cartography; MFI, mean fluorescence intensity; UMAP, uniform manifold approximation and projection.
Figure 6
Figure 6
Increased cervical CD8+ T cells are observed in women with chronic HIV infection. (A) UMAP analysis followed by unsupervised clustering of ectocervical CD8+ T cells from MELC-stained tissue sections. (B) Feature plot visualizing cellular protein expression of CD69, CD103, Eomes, GzmA, HLA-DR/DP/DQ, and TCR Vα7.2. (C) Dot plot visualizing MFI levels of individual markers within each CD8+ T cell sub-cluster. (D) UMAP plot showing the sub-clustering and CD8+ T cell prevalence within HIV+FSWs and HIVFSWs. (E) Boxplots showing the frequencies (upper) and total cell counts (lower) of the CD8+ T cell clusters within the two study groups. Statistical significance was determined using the Mann–Whitney U test with significance set at P < 0.05. *, P < 0.05; **, P < 0.01. FSW, female sex worker; Gzm, granzyme; MELC, multi-epitope ligand cartography; MFI, mean fluorescence intensity; UMAP, uniform manifold approximation and projection.
Figure 7
Figure 7
Cervical CD4+ T cell levels are unchanged in women with chronic HIV infection. (A) UMAP analysis followed by unsupervised clustering of ectocervical CD4+ T cells from MELC-stained tissue sections. (B) Feature plot visualizing cellular protein expression of CD69, CD103, Eomes, HLA-DR/DP/DQ, CD161, and TCR Vα7.2. (C) Dot plot visualizing MFI levels of individual markers within each CD4+ T cell sub-cluster. (D) UMAP plot showing the sub-clustering and CD4+ T cell prevalence within HIV+FSWs and HIVFSWs. (E) Bar chart showing the frequencies (upper) and total cell counts (lower) of the CD4+ T cell clusters within the two study groups. Statistical significance was determined using the Mann–Whitney U test with significance set at P < 0.05. FSW, female sex worker; MELC, multi-epitope ligand cartography; MFI, mean fluorescence intensity; UMAP, uniform manifold approximation and projection.
Figure 8
Figure 8
Increased cervical CD3low/neg leukocyte levels are observed in women with chronic HIV infection. (A) UMAP analysis followed by unsupervised clustering of ectocervical CD3low/neg leukocytes from MELC-stained tissue sections. (B) Feature plot visualizing cellular protein expression of CD8, CD4, HLA-DR/DP/DQ, Langerin, GzmA, and Eomes. (C) Dot plot visualizing MFI levels of individual markers within each CD3low/neg leukocyte sub-cluster. (D) UMAP showing the sub-clustering and CD3low/neg leukocyte prevalence within the HIV+FSWs and HIVFSWs. (E) Bar chart showing the frequencies (upper) and total cell counts (lower) of the CD3low/neg leukocyte clusters within the two study groups. Statistical significance was determined using the Mann–Whitney U test with significance set at P < 0.05. *, P < 0.05; **, P < 0.01. FSW, female sex worker; Gzm, granzyme; MELC, multi-epitope ligand cartography; MFI, mean fluorescence intensity; UMAP, uniform manifold approximation and projection.

References

    1. Kamat A, Misra V, Cassol E, Ancuta P, Yan Z, Li C, et al. . A plasma biomarker signature of immune activation in HIV patients on antiretroviral therapy. PloS One. (2012) 7:e30881. doi: 10.1371/journal.pone.0030881 - DOI - PMC - PubMed
    1. So-Armah KA, Tate JP, Chang CCH, Butt AA, Gerschenson M, Gibert CL, et al. . Do biomarkers of inflammation, monocyte activation, and altered coagulation explain excess mortality between HIV infected and uninfected people? J Acquir Immune Defic Syndr. (2016) 72:206. doi: 10.1097/QAI.0000000000000954 - DOI - PMC - PubMed
    1. Brenchley JM, Price DA, Schacker TW, Asher TE, Silvestri G, Rao S, et al. . Microbial translocation is a cause of systemic immune activation in chronic HIV infection. Nat Med. (2006) 12:1365–71. https://www.nature.com/articles/nm1511. - PubMed
    1. Giorgi JV, Hultin LE, McKeating JA, Johnson TD, Owens B, Jacobson LP, et al. . Shorter survival in advanced human immunodeficiency virus type 1 infection is more closely associated with T lymphocyte activation than with plasma virus burden or virus chemokine coreceptor usage. J Infect Dis. (1999) 179:859–70. doi: 10.1086/314660 - DOI - PubMed
    1. Nasi M, Pinti M, Mussini C, Cossarizza A. Persistent inflammation in HIV infection: established concepts, new perspectives. Immunol Lett. (2014) 161:184–8. doi: 10.1016/j.imlet.2014.01.008 - DOI - PubMed