. 2024 Dec 2:15:1384220.
doi: 10.3389/fgene.2024.1384220. eCollection 2024.

Assessment of genetic structure and trait associations of Watkins wheat landraces under Egyptian field conditions

Affiliations

Assessment of genetic structure and trait associations of Watkins wheat landraces under Egyptian field conditions

Ahmed Fawzy Elkot et al. Front Genet. .

Abstract

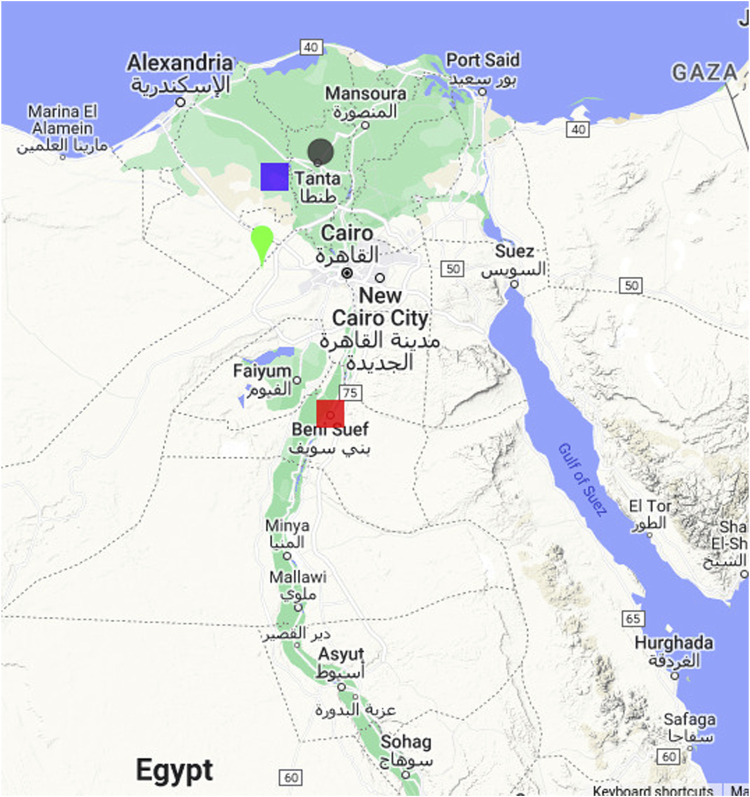
Background: Wheat landraces represent a reservoir of genetic diversity that can support wheat improvement through breeding. A core panel of 300 Watkins wheat landraces, as well as 16 non-Watkins landraces and elite wheat cultivars, was grown during the 2020-2021 and 2021-2022 seasons at four Agricultural Research Stations in Egypt, Gemmiza, Nubaria, Sakha, and Sids, to evaluate the core panel for agromorphological and yield-related traits. The genetic population structure within these genotypes were assessed using 35,143 single nucleotide polymorphisms (SNPs).

Results: Cluster analyses using Discriminant Analysis of Principal Components (DAPC) and k-means revealed three clusters with moderate genetic differentiation and population structure, possibly due to wheat breeding systems and geographical isolation. The best ancestry was k = 4, but k = 2 and k = 3 were also significant. A genome-wide association study (GWAS) identified clustered marker trait associations (MTAs) linked to thousand kernel weight on chromosome 5A, plant height on chromosomes 3B and 1D, days to heading on chromosomes 2A, 4B, 5B and 1D, and plant maturity on chromosomes 3A, 2B, and 6B. In the future, these MTAs can be used to accelerate the incorporation of beneficial alleles into locally adapted germplasm through marker-assisted selection. Gene enrichment analysis identified key genes within these loci, including Reduced height-1 (Rht-A1) and stress-related genes.

Conclusion: These findings underscore significant genetic connections and the involvement of crucial biological pathways.

Keywords: Watkins; agromorphological traits; genome-wide association study (GWAS); marker trait associations; population structure; wheat.


Conflict of interest statement

The authors declare that the research was conducted in the absence of any commercial or financial relationships that could be construed as a potential conflict of interest.

Figures

FIGURE 1
FIGURE 1
Map showing the locations of the experimental field trials conducted for wheat in Egypt. The locations include the Sakha Agricultural Research Station (green teardrop), Nubaria Agricultural Research (mauve square), Gemmiza Agricultural Research Station (grey spot), and Sids Agricultural Research (red square).
FIGURE 2
FIGURE 2
The distribution of trait values across different years and stations. Each violin represents the range and density of trait values for a specific combination of trait, station, and year.
FIGURE 3
FIGURE 3
The distribution of 9402 SNP markers across the wheat genome. The x-axis represents the chromosomes of the wheat genome, while the vertical bars represent the density of SNP markers per Gb according to the legend on the right.
FIGURE 4
FIGURE 4
The genomic linkage disequilibrium association across the wheat genome based on 35K Axiom Wheat Genotyping Array data. (A) LD decay plot: The X-axis represents the physical distance in base pairs (bp) between SNPs, and the Y-axis represents the LD measured as R2 . Red points indicate r2 values between SNP pairs, while gray points represent background LD values. The green line marks the threshold for significant LD, and the blue line shows the average R2 value across distances. (B) Box plot of the LD values across wheat chromosomes.
FIGURE 5
FIGURE 5
Genetic diversity of the studied wheat population based on Discriminant Analysis of Principal Components (DAPC), showing clustering of individuals according to their sampling countries. Each color represents a different country.
FIGURE 6
FIGURE 6
The clustering analysis of the studied wheat landraces. Panel (A) shows the expected number of populations for different Bayesian Information Criteria (BIC) values, where the optimal number of populations was predicted to be 3. Panel (B) displays the predicted number of genetic clusters based on the DAPC analysis. Panel (C) presents a bar plot illustrating the assignment of individual landraces to different groups.
FIGURE 7
FIGURE 7
Hierarchical cluster dendrogram of the studied wheat landraces based on SNP genotyping data. The different colors represent the geographical origin of the landraces.
FIGURE 8
FIGURE 8
The population structure of studied wheat landraces based on 35K Axiom Wheat Genotyping Array data. The optimal number of ancestral populations was determined using the results of 10 K runs, with K = 4 being the most significant structure for the population. The figure shows the clustering of 316 wheat accessions into four groups (Q1, Q2, Q3, Q4) with different lineages, each representing a specific proportion of the total population.
FIGURE 9
FIGURE 9
Manhattan plots show the Genome-Wide Association Study (GWAS) results of the days to heading (DH) trait across four environments from 2020 to 2021 and their statistical significance (FDR). Each dot represents a Single Nucleotide Polymorphism (SNP), and its position on the plot represents its chromosomal location. The red dots represent SNPs that are significantly associated with days to heading (DH) trait (FDR 0.1), while blue dots represent significant SNPs with p-value 0.001).
FIGURE 10
FIGURE 10
Manhattan plots showing the genome-wide association study (GWAS) results of plant height (PH) and days to maturity (DM) traits across four environments from 2020–2021 to 2021–2022. The x-axis represents the physical position of SNPs on each chromosome, and the y-axis shows the negative logarithm of the adjusted p-values [−log10 (p-value)]. The red dots represent SNPs that are significantly associated with the studied traits (FDR 0.1), while blue dots represent significant SNPs with p-value 0.001).
FIGURE 11
FIGURE 11
Manhattan plots displaying the genome-wide association study (GWAS) results for the 1,000 kernel weight (1000 KW) trait in wheat across four environments from 2020–2021 to 2021–2022. The horizontal axis shows the physical position of each single nucleotide polymorphism (SNP) across the wheat genome, while the vertical axis represents the –log10 p-value of association for each SNP. The red dots represent SNPs that are significantly associated with the 1,000 KW trait (FDR 0.1), while blue dots represent significant SNPs with p-value 0.001).

References

    1. Aalto S., Kiiras K., Mayer H., Miettinen H. (2022). Armed conflict in Ukraine. Perspect. Geogr. inequalities Sustain. Dev. Goals—five case Stud. 42. 10.1016/j.geosus.2022.09.003 - DOI
    1. Abay K. (2023). Wheat genetics, research and development in Egypt. International Food Policy Research Institute.
    1. Abdalla A., Becker M., Stellmacher T. (2023). The contribution of agronomic management to sustainably intensify Egypt’s wheat production. Agriculture 13, 978. 10.3390/agriculture13050978 - DOI
    1. Abdelmageed K., Chang X.-h., Wang D.-m., Wang Y.-j., Yang Y.-s., Zhao G.-c., et al. (2019). Evolution of varieties and development of production technology in Egypt wheat: a review. J. Integr. Agric. 18, 483–495. 10.1016/s2095-3119(18)62053-2 - DOI
    1. Aleksandrov V., Kartseva T., Alqudah A. M., Kocheva K., Tasheva K., Börner A., et al. (2021). Genetic diversity, linkage disequilibrium and population structure of Bulgarian bread wheat assessed by genome-wide distributed snp markers: from old germplasm to semi-dwarf cultivars. Plants 10, 1116. 10.3390/plants10061116 - DOI - PMC - PubMed

LinkOut - more resources