. 2025 Apr;151(13):946-965.
doi: 10.1161/CIRCULATIONAHA.124.069574. Epub 2024 Dec 17.

METTL4-Mediated Mitochondrial DNA N6-Methyldeoxyadenosine Promoting Macrophage Inflammation and Atherosclerosis

Affiliations

METTL4-Mediated Mitochondrial DNA N6-Methyldeoxyadenosine Promoting Macrophage Inflammation and Atherosclerosis

Longbin Zheng et al. Circulation. 2025 Apr.

Abstract

Background: Mitochondrial dysfunction is a key factor in the development of atherogenesis. METTL4 (methyltransferase-like protein 4) mediates N6- methyldeoxyadenosine (6mA) of mammalian mitochondrial DNA (mtDNA). However, the role of METTL4-mediated mitoepigenetic regulation in atherosclerosis is still unknown. This study aims to investigate the potential involvement of METTL4 in atherosclerosis, explore the underlying mechanism, and develop targeted strategies for treating atherosclerosis.

Methods: Expression levels of mtDNA 6mA and METTL4 were determined in atherosclerotic lesions. We explored the mechanism of METTL4 involvement in atherosclerosis using Mettl4Mac-KO-Apoe-/- and Mettl4MUT-Apoe-/- mice and cell models, as well as bone marrow transplantation. Natural compound libraries were screened to identify potent METTL4 antagonists. In addition, bioinspired proteolysis targeting chimera technology targeting macrophages within plaques was used to increase the efficacy of the METTL4 antagonist.

Results: The expression levels of mtDNA 6mA and METTL4 were significantly increased in plaque macrophages. Mettl4Mac-KO-Apoe-/- mice displayed suppressed mtDNA 6mA levels and atherosclerotic progression, which were reversed by METTL4 restoration through bone marrow transplantation (n=6). Mechanistically, elevated METTL4 expression reduces mitochondrial ATP6 (MT-ATP6) expression by suppressing its transcription, thereby impairing the activity of mitochondrial respiration chain complex V. This disruption leads to the accumulation of excess protons in the mitochondrial intermembrane space, causing mitochondrial dysfunction. Consequently, mtDNA is released into the cytoplasm, ultimately triggering inflammasome activation. All results were reversed by the mutation in the METTL4 methyltransferase active site. Mettl4MUT-Apoe-/- mice showed suppressed mtDNA 6mA levels and atherosclerotic progression and repaired mitochondrial function of macrophage, which were reversed by METTL4 restoration through bone marrow transplantation (n=6). Pemetrexed was identified as the first METTL4 antagonist to effectively alleviate atherosclerotic progression. Furthermore, we generated a proteolysis targeting chimera drug based on pemetrexed that specifically targeted METTL4 in macrophages within plaques, showing a promising therapeutic effect on atherosclerosis.

Conclusions: This study revealed a novel mechanism by which mtDNA 6mA orchestrated mitochondrial function-related gene expression in macrophages, thereby promoting atherosclerosis. Through various experimental techniques, such as gene manipulation, pharmacological inhibition, and proteolysis targeting chimera, this study demonstrated that mtDNA 6mA and its specific enzyme METTL4 hold potential as therapeutic targets for atherosclerosis.

Keywords: METTL4; atherosclerosis; inflammation; macrophages; mitochondria.


Conflict of interest statement

None.

Figures
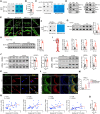
Figure 1.
Figure 1.
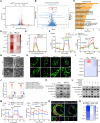
METTL4 (methyltransferase-like protein 4) is involved in the progression of atherosclerosis. A and B, N6-methyldeoxyadenosine (6mA) dot blot (A) and MethylFlash m6A DNA Methylation ELISA Kit (B) analysis of mitochondrial DNA (mtDNA) 6mA levels in human monocyte–derived macrophages (HMDMs) treated with or without oxidized low-density lipoprotein (ox-LDL, 50 μg/mL, 24 hours). n=6 per group. C, 6mA dot blot analysis of mtDNA and total DNA in ox-LDL–stimulated HMDMs. n=6 per group. D, Western blot analysis of the subcellular localization of METTL4 protein in HMDMs treated with or without ox-LDL. VDAC (mitochondria) and H3 (nucleus) were selected as organelle-specific marker proteins. n=6 per group. E, Super-resolution fluorescence imaging the colocalization of METTL4 (red) with mitochondria (TOMM20, green) in ox-LDL–stimulated HMDMs with Scr or siMETTL4. n=6 per group. F, 6mA dot blot analysis of mtDNA 6mA levels in HMDMs transfected with Scr or siMETTL4 followed by ox-LDL stimulation. n=6 per group. G, Western blot analysis of the levels of METTL4 in nonatherosclerotic (Non-AS) and atherosclerotic (AS) arteries derived from patients. n=6 per group. H, Western blot analysis of the levels of METTL4 in the arteries derived from Apoe-/- mice fed with normal chow (NC) or high-fat diet (HFD). n=6 per group. I, RT-qPCR (quantitative reverse transcription polymerase chain reaction) analysis of Mettl4 and inflammatory factors (MCP-1, IL-1β, and TNF-α) in the athero-prone (lower curvature, LC) and athero-protective (greater curvature, GC) regions of atherosclerotic lesions derived from HFD-fed Apoe-/- mice. n=6 per group. J, Western blot analysis of METTL4 in human aortic smooth muscle cells (HASMCs), human aortic endothelial cells (HAECs), HMDMs, and bone marrow–derived macrophages (BMDMs) treated with or without ox-LDL. n=6 per group. K, Immunofluorescence analysis of METTL4 (green) and macrophage marker (CD68, red) in the HMDMs treated with or without ox-LDL. n=6 per group. L, Immunofluorescence analysis of METTL4 (green) and macrophage marker (CD68, red) in the aortic root from Apoe-/- mice fed with a HFD for 8 and 12 weeks. n=6 per group. M, RT-qPCR analysis of METTL4 levels in peripheral blood mononuclear cells (PBMCs) of healthy individuals and PBMCs of symptomatic and asymptomatic patients with carotid atherosclerosis. n=21 per group. N, Linear regression analysis of mRNA levels of METTL4 with inflammatory factors in PBMCs from patients with carotid atherosclerosis. n=42 per group. O, Nuclear run-on experiments coupled with RT-qPCR analysis of the global nascent METTL4 transcript in HMDMs treated with or without ox-LDL. n=6 per group. Data represent the mean±SEM. **P<0.01, ***P<0.001 by unpaired 2-sided Student t test (B and H through J), unpaired 2-sided Student t test with Welch correction (I and O), Brown-Forsythe and Welch ANOVA test followed by Dunnett T3 multiple comparisons test (M), Mann-Whitney test (G), and Pearson correlation analysis (N).
Figure 2.
Figure 2.
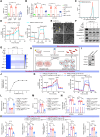
Myeloid-specific deletion of METTL4 reduces atherosclerosis. A, Strategy for the generation of Mettl4flox/flox mice. B, Schematic diagram of atherosclerotic model establishment in Mettl4flox/flox-Apoe-/- mice and Mettl4Mac-KO-Apoe-/- mice. C, En face Oil Red O staining of the aortas of HFD-fed Mettl4flox/flox-Apoe-/- mice and Mettl4Mac-KO-Apoe-/- mice. n=6 per group. D and E, The Oil Red O (D) and HE staining (E) in the aortic roots of HFD-fed Mettl4flox/flox-Apoe-/- and Mettl4Mac-KO-Apoe-/- mice. n=6 per group. F, RT-qPCR (quantitative reverse transcription polymerase chain reaction) analysis of CD11b within the aortic root plaques derived from HFD-fed Mettl4flox/flox-Apoe-/- and Mettl4Mac-KO-Apoe-/- mice. n=10 per group. G, Representative immunofluorescence staining images of macrophages (CD68, red) and DAPI (blue) in the aortic roots from HFD-fed Mettl4flox/flox-Apoe-/- and Mettl4Mac-KO-Apoe-/- mice. n=6 per group. H, The Masson and Sirius red staining in the aortic roots of HFD-fed Mettl4flox/flox-Apoe-/- and Mettl4Mac-KO-Apoe-/- mice. n=6 per group. I, Representative immunofluorescence staining images of smooth muscle cell (SMA, green) and DAPI (blue) in the aortic roots of HFD-fed Mettl4flox/flox-Apoe-/- and Mettl4Mac-KO-Apoe-/- mice. n=6 per group. J, Dot blot analysis of mtDNA 6mA levels in thioglycolate-elicited peritoneal macrophages (TEPMs) derived from HFD-fed Mettl4flox/flox-Apoe-/- and Mettl4Mac-KO-Apoe-/- mice. n=6 per group. Data represent the mean±SEM. **P<0.01, ***P<0.001 by unpaired 2-sided Student t test (C through E and H) and unpaired 2-sided Student t test with Welch correction (C and F through I).
Figure 3.
Figure 3.
METTL4-activated macrophage inflammasome through cytoplasmic mtDNA released through mitochondrial permeability transition pore (mPTP) opening. A, Volcano plot of RNA-Seq data (GSE280434) from HMDMs treated with siMETTL4+ox-LDL and Scr+ox-LDL. B, Bubble diagram illustrating the Gene Ontology (GO) enrichment of differentially expressed genes. Each circle corresponds to the number of genes assigned to each category. C, Enrichment of genes involved in GO biological processes. D, RT-qPCR (quantitative reverse transcription polymerase chain reaction) analysis of inflammatory factors in HMDMs transfected with or without siMETTL4 followed by ox-LDL stimulation is presented as a heatmap. n=6 per group. E, Flow cytometry analysis of mitochondrial membrane potential using a JC-1 probe in HMDMs transfected with or without siMETTL4 followed by ox-LDL stimulation. n=6 per group. F, Oxygen consumption rate (OCR) and extracellular acidification rate (ECAR) in HMDMs transfected with or without siMETTL4 followed by ox-LDL stimulation were monitored using a Seahorse XFe24 analyzer. n=6 per group. G, The ultrastructure of mitochondria in HMDMs transfected with or without siMETTL4 followed by ox-LDL stimulation was examined by transmission electron microscopy. LD indicates lipid droplets; M, mitochondria; and N, nucleus. n=6 per group. H, The fluorescence imaging of mitochondrial morphology in HMDMs transfected with or without siMETTL4 followed by ox-LDL stimulation. n=6 per group. I, Quantitative PCR (qPCR) analysis of cytoplasmic mtDNA (MT-ND1 and MT-ND2), nuclear LINE1 elements (L1ORF1 and L1ORF2), and ribosomal gene (18SRRNA) in HMDMs transfected with or without siMETTL4 followed by ox-LDL stimulation. n=6 per group. J, The METTL4-deficient HMDMs were transfected with or without METTL4 overexpression plasmid, which were then pretreated with 5 μM CsA for 2 hours, followed by ox-LDL stimulation. Then, qPCR was conducted to analyze cytoplasmic DNA content of these HMDMs. n=6 per group. K, Western blot analysis of inflammasome-associated proteins (caspase-1 and IL-1β) in HMDMs transfected with or without siMETTL4 followed by ox-LDL stimulation. n=6 per group. L, The METTL4-deficient HMDMs were transfected with or without METTL4 overexpression plasmid, which were then treated with mtDNA or DNase (deoxyribonuclease) I. Then, Western blot was conducted to analyze the expression of inflammasome-associated proteins in the cells. n=6 per group. M, OCR and ECAR in TEPMs from HFD-fed Mettl4Mac-KO-Apoe-/- and Mettl4flox/flox-Apoe-/- mice were monitored using a Seahorse XFe24 analyzer. n=6 per group. N, Representative immunofluorescence staining images of macrophage (CD68, red) and IL-1β (green) in the aortic roots derived from HFD-fed Mettl4flox/flox-Apoe-/- and Mettl4Mac-KO-Apoe-/- mice. n=6 per group. O, RT-qPCR analysis of inflammatory factors in plaque macrophages from HFD-fed Mettl4flox/flox-Apoe-/- and Mettl4Mac-KO-Apoe-/- mice. The results are presented as a heatmap. n=6 per group. Data represent the mean±SEM. *P<0.05, **P<0.01, ***P<0.001 by 2-way ANOVA followed by Tukey multiple comparisons test (D and I), Brown-Forsythe and Welch ANOVA test followed by Dunnett T3 multiple comparisons test (J), unpaired 2-sided Student t test (O), and unpaired 2-sided Student t test with Welch correction (O).
Figure 4.
Figure 4.
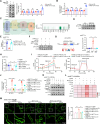
The mtDNA 6mA is the critical factor for METTL4 in regulating mitochondrial dysfunction in ox-LDL–stimulated macrophages. A, MethylFlash m6A DNA Methylation ELISA Kit analysis of mtDNA 6mA levels in HMDMs transfected with pcDNA, METTL4-WT, and METTL4-MUT followed by ox-LDL stimulation. n=6 per group. B, qPCR (quantitative polymerase chain reaction) analysis of cytoplasmic mtDNA content in HMDMs transfected with pcDNA, METTL4-WT, and METTL4-MUT followed by ox-LDL stimulation. n=6 per group. C, Flow cytometry analysis of the mitochondrial membrane potential using the JC-1 probe in METTL4-deficient HMDMs transfected with METTL4-WT and METTL4-MUT followed by ox-LDL stimulation. n=6 per group. D, ECAR and OCR of the METTL4-deficient HMDMs transfected with METTL4-WT and METTL4-MUT followed by ox-LDL stimulation were monitored using a Seahorse XFe24 analyzer. n=6 per group. We constructed mtDNA-depleted METTL4-deficient HMDMs (ρ0) using Etbr. Then, the ρ0 cells and METTL4-deficient HMDMs were transfected with METTL4-WT or METTL4-MUT, followed by ox-LDL stimulation. E, Transmission electron microscopy analysis of the ultrastructure of HMDMs. LD indicates lipid droplets; M, mitochondria; and N, nucleus. n=6 per group. F, Western blot analysis of inflammasome-associated proteins in HMDMs. n=6 per group. G, RT-qPCR (quantitative reverse transcription polymerase chain reaction) analysis of inflammatory factors in HMDMs. The results are presented as a heatmap. n=6 per group. H, Flow chart of experimental procedure for mitochondrial transplantation in HMDMs. I, Western blot analysis of the purity of extracted mitochondria. n=6 per group. J, Flow cytometry analysis of the internalization of MitoTracker Green–labeled mitochondria in HMDMs. n=3 per group. The mitochondria were extracted from HMDMs transfected with METTL4-WT followed by ox-LDL stimulation (MitWT+ox-LDL) or HMDMs transfected with METTL4-MUT followed by ox-LDL stimulation (MitMUT+ox-LDL). Then, the METTL4-deficient HMDMs were transfected with pcDNA followed by ox-LDL stimulation, which were then transplanted with MitWT+ox-LDL. The METTL4-deficient HMDMs were transfected with METTL4 overexpression plasmid followed by ox-LDL stimulation, which were then transplanted with MitMUT+ox-LDL. K, The effects of mitochondrial transplantation on ECAR and OCR in HMDMs were monitored using a Seahorse XFe24 analyzer. n=6 per group. L, TMRM fluorescence staining analysis showing the effects of mitochondrial transplantation on mitochondrial membrane potential. n=6 per group. M, MethylFlash m6A DNA Methylation ELISA Kit analysis of the effect of mitochondrial transplantation on mtDNA 6mA levels in HMDMs. n=6 per group. N, qPCR analysis of the effects of mitochondrial transplantation on the cytoplasmic mtDNA content in HMDMs. n=6 per group. O, RT-qPCR analysis of the effects of mitochondrial transplantation on expressions of inflammatory factors in HMDMs. n=6 per group. Data represent the mean±SEM. *P<0.05, **P<0.01, ***P<0.001 by 1-way ANOVA followed by Tukey multiple comparisons test (A, G, M, and O), and Brown-Forsythe and Welch ANOVA test followed by Dunnett T3 multiple comparisons test (B, L, N, and O).
Figure 5.
Figure 5.
METTL4-mediated MT-ATP6 6mA caused excess protons accumulated in the mitochondrial intermembrane space. A, Western blot analysis of mitochondrial respiratory chain complex I-V in HMDMs transfected with or without siMETTL4 followed by ox-LDL stimulation. n=6 per group. B, Mitochondrial respiration chain complex activity assay kit measures the activity of mitochondrial respiratory chain complex I-V in HMDMs transfected with or without siMETTL4 followed by ox-LDL stimulation. n=6 per group. C, RT-qPCR (quantitative reverse transcription polymerase chain reaction) analysis of mtDNA encoded genes in HMDMs transfected with or without siMETTL4 followed by ox-LDL stimulation, as shown in the heat map. n=6 per group. D, Western blot analysis of MT-ATP6 expression in HMDMs transfected with or without siMETTL4 followed by ox-LDL stimulation. n=6 per group. E, RT-qPCR analysis of MT-ATP6 in METTL4-deficient HMDMs transfected with pcDNA, METTL4-WT, or METTL4-MUT followed by ox-LDL stimulation. n=6 per group. F, Western blot analysis of MT-ATP6 in METTL4-deficient HMDMs transfected with pcDNA, METTL4-WT, or METTL4-MUT followed by ox-LDL stimulation. n=6 per group. G, The mtDNA 6mA motif of MT-ATP6 (left). Immunoprecipitation (IP) analysis of the binding of 6mA and MT-ATP6 in METTL4-deficient HMDMs transfected with pcDNA, METTL4-WT, or METTL4-MUT followed by ox-LDL stimulation (right). n=6 per group. H, IP analysis of the binding of TFAM and MT-ATP6 in METTL4-deficient HMDMs transfected with pcDNA, METTL4-WT, or METTL4-MUT followed by ox-LDL stimulation. n=6 per group. I through L, The analysis of the ECAR and OCR (I), cytoplasmic mtDNA content (J), the expression of inflammasome-associated proteins (K), and the inflammation (L) in METTL4-deficient HMDMs transfected with METTL4 or ATP6 overexpression plasmid followed by ox-LDL stimulation. n=6 per group. M, Fluorescence analysis of the submitochondrial localization of protons in METTL4-deficient HMDMs transfected with METTL4 or ATP6 overexpression plasmid followed by ox-LDL stimulation. Mitochondrial (TOMM20, green) and protons (red) are shown. n=6 per group. Data represent the mean±SEM. **P<0.01, ***P<0.001 by unpaired 2-sided Student t test (A through C), unpaired 2-sided Student t test with Welch correction (B), 1-way ANOVA followed by Tukey multiple comparisons test (E and H), Brown-Forsythe and Welch ANOVA test followed by Dunnett T3 multiple comparisons test (G, J, and L), and Kruskal-Wallis test followed by Dunn multiple comparisons test (M).
Figure 6.
Figure 6.
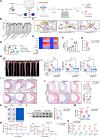
Myeloid-specific mutation in METTL4 methyltransferase active site reduced atherosclerosis. A, En face Oil Red O staining of the aortas of HFD-fed Mettl4WT-Apoe-/- and Mettl4MUT-Apoe-/- mice. n=6 per group. B, MethylFlash m6A DNA Methylation ELISA Kit analysis of mtDNA 6mA levels in TEPMs from HFD-fed Mettl4WT-Apoe-/- and Mettl4MUT-Apoe-/- mice. n=10 per group. C, Oil Red O and HE staining of aortic roots of HFD-fed Mettl4WT-Apoe-/- and Mettl4MUT-Apoe-/- mice. n=6 per group. D, Representative immunofluorescence staining images of macrophage (CD68, red) and DAPI staining (blue) in the aortic roots of HFD-fed Mettl4WT-Apoe-/- and Mettl4MUT-Apoe-/- mice. n=6 per group. E, Masson, Sirius red, and immunofluorescence staining images of smooth muscle cells (SMA, green) and DAPI (blue) in the aortic roots of HFD-fed Mettl4WT-Apoe-/- and Mettl4MUT-Apoe-/- mice. n=6 per group. F, RT-qPCR (quantitative polymerase chain reaction) analysis of inflammatory factors in plaque macrophages from HFD-fed Mettl4WT-Apoe-/- and Mettl4MUT-Apoe-/- mice. n=6 per group. G, IP analysis of 6mA and MT-ATP6 binding in TEPMs from HFD-fed Mettl4WT-Apoe-/- and Mettl4MUT-Apoe-/- mice. n=10 per group. H and I, RT-qPCR (quantitative reverse transcription polymerase chain reaction) and Western blot analysis of the expression of MT-ATP6 in TEPMs from HFD-fed Mettl4WT-Apoe-/- and Mettl4MUT-Apoe-/- mice. n=6–10 per group. J, Mitochondrial respiration chain complex activity assay kit analysis of the activity of mitochondrial respiratory chain complex I-V in TEPMs from HFD-fed Mettl4WT-Apoe-/- and Mettl4MUT-Apoe-/- mice. n=6 per group. K, ECAR and OCR in TEPMs from HFD-fed Mettl4WT-Apoe-/- and Mettl4MUT-Apoe-/- mice were monitored using a Seahorse XFe24 analyzer. n=6 per group. L, qPCR analysis of cytoplasmic mtDNA content in TEPMs from HFD-fed Mettl4WT-Apoe-/- mice and Mettl4MUT-Apoe-/- mice. n=10 per group. M, Western blot analysis of inflammasome-associated proteins in TEPMs from HFD-fed Mettl4WT-Apoe-/- and Mettl4MUT-Apoe-/- mice. n=6 per group. N, En face Oil Red O staining of the aorta of Mettl4Mac-KO-Apoe-/- mice received bone marrow from Mettl4Mac-KO-Apoe-/- (KO), Mettl4WT-Apoe-/- (WT), or Mettl4MUT-Apoe-/- (MUT) mice followed by a HFD. n=6 per group. O, RT-qPCR analysis of CD11b within the aortic root plaques from HFD-fed Mettl4Mac-KO-Apoe-/- mice receiving bone marrow cell transplantation treated as in N. n=10 per group. P, RT-qPCR analysis of inflammatory factors in plaque macrophages from Mettl4Mac-KO-Apoe-/- mice receiving bone marrow cell transplantation treated as in N. n=10 per group. Data represent the mean±SEM. **P<0.01, ***P<0.001 by unpaired 2-sided Student t test (A through D, F, H, and J), unpaired 2-sided Student t test with Welch correction (A, F, G, I, and L), Brown-Forsythe and Welch ANOVA test followed by Dunnett T3 multiple comparisons test (N), Kruskal-Wallis test followed by Dunn multiple comparisons test (O and P), and 1-way ANOVA followed by Tukey multiple comparisons test (P).
Figure 7.
Figure 7.
Pemetrexed (PEM) was identified as the first METTL4 antagonist effective in mitigating atherosclerosis progression. A, Procedure for 3D mathing and ensemble docking-based virtual screening to identify METTL4 inhibitors. B, Enzymatic inhibitory activity of the indicated compounds against purified METTL4 using a bioluminescence assay. n=6 per group. C, The molecular docking of Pemetrexed, Xanthinol Nicotinate, and Linagliptin with METTL4. D, RT-qPCR (quantitative reverse transcription polymerase chain reaction) analysis of MT-ATP6 expression in ox-LDL–stimulated HMDMs treated with PEM, Xanthinol Nicotinate (XN), and Linagliptin. n=6 per group. E, RT-qPCR analysis of inflammatory factors in ox-LDL–stimulated HMDMs treated with PEM, XN, and Linagliptin. The results are presented as a heatmap. n=6 per group. F, RT-qPCR analysis of MT-ATP6 in ox-LDL–stimulated HMDMs treated with different concentrations of PEM. n=6 per group. G, IP analysis of 6mA and MT-ATP6 binding in ox-LDL–stimulated HMDMs treated with or without PEM. n=6 per group. H, En face Oil Red O staining of the aortas of HFD-fed Apoe-/- mice treated with different dosages of PEM. n=6 per group. I, Oil Red O staining of the aortic roots of HFD-fed Apoe-/- mice treated with different dosages of PEM. n=6 per group. J, The HE, Masson, and Sirius red staining of the aortic roots of HFD-fed Apoe-/- mice with or without PEM. n=6 per group. K and L, Dot blot analysis of mtDNA 6mA levels (K) and Western blot analysis of MT-ATP6 expression (L) in TEPMs from HFD-fed Apoe-/- mice with or without PEM. n=6 per group. M, qPCR analysis of cytoplasmic mtDNA content in TEPMs from HFD-fed Apoe-/- mice with or without PEM.. n=10 per group. N, The ECAR and OCR in TEPMs from HFD-fed Apoe-/- mice with or without PEM were monitored using a Seahorse XFe24 analyzer. n=6 per group. O, RT-qPCR analysis of inflammatory factors in plaque macrophages from HFD-fed Apoe-/- mice with or without PEM. n=6 per group. Data represent the mean±SEM. *P<0.05, **P<0.01, ***P<0.001 by 1-way ANOVA followed by Tukey multiple comparisons test (B, D through F, and H), unpaired 2-sided Student t test (G, J, L, M, and O), and unpaired 2-sided Student t test with Welch correction (O).
Figure 8.
Figure 8.
PROTAC-PEM could effectively alleviate atherosclerosis. A, The preparation procedure for PROTAC-PEM targeting macrophages. B, Western blot analysis of METTL4 expression in HMDMs pretreated with MG132 (10 μM, 4 hours), followed by ox-LDL stimulation combining with PROTAC-PEM. n=6 per group. C, IP analysis of the binding of 6mA and MT-ATP6 in ox-LDL–stimulated HMDMs treated with or without PROTAC-PEM. n=10 per group. D, RT-qPCR (quantitative reverse transcription polymerase chain reaction) analysis of MT-ATP6 expression in ox-LDL–stimulated HMDMs treated with or without PROTAC-PEM. n=6 per group. E, ECAR and OCR in ox-LDL–stimulated HMDMs treated with or without PROTAC-PEM were monitored using a Seahorse XFe24 analyzer. n=6 per group. F and G, qPCR (quantitative polymerase chain reaction) analysis of cytoplasmic mtDNA content (F), RT-qPCR analysis of inflammatory factors (G) in ox-LDL–stimulated HMDMs treated with or without PROTAC-PEM. n=6 per group. H, En face Oil Red O staining of the aorta of NC or HFD-fed Apoe-/- mice treated with or without PROTAC-PEM. n=6 per group. I, RT-qPCR analysis of CD11b in aortic root plaques derived from NC or HFD-fed Apoe-/- mice treated with or without PROTAC-PEM. n=10 per group. J, RT-qPCR analysis of inflammatory factors in macrophages within atherosclerotic plaques of NC or HFD-fed Apoe-/- mice treated with or without PROTAC-PEM. n=6 per group. K, Dot blot analysis of mtDNA 6mA levels in TEPMs from NC or HFD-fed Apoe-/- mice treated with or without PROTAC-PEM. n=6 per group. L and M, RT-qPCR analysis of MT-ATP6 (L), and qPCR analysis of the cytoplasmic mtDNA content in TEPMs (M) from NC or HFD-fed Apoe-/- mice treated with or without PROTAC-PEM. n=10 per group. N, Representative immunofluorescence staining images of macrophage (CD68, red) and IL-1β (green) in the aortic root derived from HFD-fed Apoe-/- mice treated with or without PROTAC-PEM. n=6 per group. O, A mechanistic diagram of METTL4-mediated mtDNA 6mA modification in macrophage induced atherosclerosis development. Data represent the mean±SEM. *P<0.05, **P<0.01, ***P<0.001 by 2-way ANOVA followed by Tukey multiple comparisons test (B through D, F through J, and L and M).

Similar articles

Cited by

References

    1. Harrington JS, Ryter SW, Plataki M, Price DR, Choi AMK. Mitochondria in health, disease, and aging. Physiol Rev. 2023;103:2349–2422. doi: 10.1152/physrev.00058.2021 - PMC - PubMed
    1. Zhu D, Li X, Tian Y. Mitochondrial-to-nuclear communication in aging: an epigenetic perspective. Trends Biochem Sci. 2022;47:645–659. doi: 10.1016/j.tibs.2022.03.008 - PubMed
    1. Madamanchi NR, Runge MS. Mitochondrial dysfunction in atherosclerosis. Circ Res. 2007;100:460–473. doi: 10.1161/01.RES.0000258450.44413.96 - PubMed
    1. Dumont A, Lee M, Barouillet T, Murphy A, Yvan-Charvet L. Mitochondria orchestrate macrophage effector functions in atherosclerosis. Mol Aspects Med. 2021;77:100922. doi: 10.1016/j.mam.2020.100922 - PubMed
    1. Bravo-San Pedro JM, Kroemer G, Galluzzi L. Autophagy and mitophagy in cardiovascular disease. Circ Res. 2017;120:1812–1824. doi: 10.1161/CIRCRESAHA.117.311082 - PubMed

MeSH terms