. 2025 Apr;24(4):e14452.
doi: 10.1111/acel.14452. Epub 2024 Dec 17.

Role of PI3K/AKT/MAOA in glucocorticoid-induced oxidative stress and associated premature senescence of the trabecular meshwork

Affiliations

Role of PI3K/AKT/MAOA in glucocorticoid-induced oxidative stress and associated premature senescence of the trabecular meshwork

Pengyu Zhang et al. Aging Cell. 2025 Apr.

Abstract

The oxidative stress-induced premature senescence of trabecular meshwork (TM) represents a pivotal risk factor for the development of glucocorticoid-induced glaucoma (GIG). This study aimed to elucidate the pathogenesis of TM senescence in GIG. MethodsIntraocular pressure (IOP), transmission electron microscopy and senescence-associated protein expression in TM were evaluated in GIG mice. Protein expression of phosphoinositide-3-kinase regulatory subunit 1 (PIK3R1) and monoamine oxidase A (MAOA), phosphorylation of AKT were quantified. ROS and mitochondrial superoxide levels were measured to evaluate cellular oxidative stress. Cell cycle analysis, β-galactosidase staining, senescence-associated protein expression were employed to assess the aging status of primary human trabecular meshwork cells (pHTMs). ResultsmRNA-seq and KEGG analysis indicating PI3K/AKT pathway as a key regulator in TM of GIG. PI3K inhibitor significantly prevented IOP elevation and abnormal mitochondrial morphology of TM in the GIG mouse model. PI3K inhibitor or selective silencing of PIK3R1 alleviated dexamethasone (DEX)-induced oxidative stress, also mitochondrial dysfunction, inhibiting MAOA expression in pHTMs. The same phenomenon was observed in the GIG models with inhibition of MAOA. Further KEGG analysis indicates that cellular senescence is the key factor in the pathogenesis of GIG. TM senescence was observed in both GIG mouse and cell models. Inhibition of the PI3K/AKT/MAOA pathway significantly alleviated DEX-induced premature cellular senescence of TM in GIG models. Glucocorticoids activated the PI3K/AKT/MAOA pathway, leading to mitochondrial dysfunction, oxidative stress, and premature aging in TM, elevating IOP. This mechanism could be associated with the onset and progression of GIG, providing a potential approach for its treatment.

Keywords: PI3K/AKT/MAOA; cell aging; glaucoma; glucocorticoid; mitochondria; oxidative stress; trabecular meshwork.


Conflict of interest statement

The authors declare that they do not have financial or other conflicts of interest.

Figures
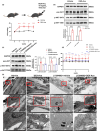
FIGURE 1
FIGURE 1
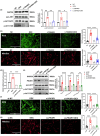
Effect of inhibition of the PI3K‐AKT pathway on GIG progression in the GIG mouse model. (a) Schematic diagram depicting the construction of the GIG mouse model and the IOP elevation in GIG mice (red asterisk: Vehicle vs. DEX‐Ace; n = 10 mouse eyes). (b) Protein expression levels of pan‐AKT, p‐AKT‐S473, and p‐AKT‐T308 in TM of vehicle and DEX‐Ace groups (n = 3 mouse eyes). (c) Protein expression levels of pan‐AKT, p‐AKT‐S473, and p‐AKT‐T308 in TM of vehicle, DEX‐Ace, LY294002 + vehicle, and LY294002 + DEX‐Ace groups (n = 3 mouse eyes). (d) LY294002 (PI3K inhibitor; 50 mg/kg, once weekly for 8 weeks) reduced IOP in the GIG mouse model (red asterisk: Vehicle vs. DEX‐Ace; blue asterisk: DEX‐Ace vs. LY294002 + DEX‐Ace; n = 10 mouse eyes). (e) Representative images of mitochondrial morphology in the TM region from each group captured by electron microscopy. White arrows: Damaged mitochondria in the DEX‐Ace‐treated group (n = 3 mouse eyes). Scale bar = 10 μm (upper images)/2 μm (middle images)/1 μm (lower images). CB, ciliary body; S, Sclera; SC, Schlemm's canal; TM, Trabecular meshwork. Data are presented as mean ± SD. Unpaired t‐test (a, b). One‐way ANOVA followed by Tukey's test (c, d). *p < 0.5, **p < 0.01, ***p < 0.001, ****p < 0.0001. All experiments were biologically replicated at least three times.
FIGURE 2
FIGURE 2
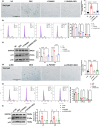
PI3K/AKT pathway inhibition alleviated DEX‐induced oxidative stress in pHTMs. (a) LY294002 (50 μM, 72 h) inhibited DEX‐induced PI3K/AKT pathway activation in pHTMs. (b) ROS levels (n ≥ 13 fields per group). Scale bar = 500 μm. (c) Mitochondrial superoxide levels (n ≥ 15 fields per group). Scale bar = 200 μm. (d) PIK3R1 mRNA expression levels. (e) Protein levels of PIK3R1 and phosphorylation of AKT. (f) Representative ROS staining images (n ≥ 14 fields per group). Scale bar = 500 μm. (g) Representative mitochondrial superoxide staining images (n ≥ 9 fields per group). Scale bar = 200 μm. The experiments were conducted using cell strains cultured from three separate donors. Data are presented as mean ± SD. One‐way ANOVA followed by Tukey's test. *p < 0.05, **p < 0.01, ***p < 0.001, ****p < 0.0001.
FIGURE 3
FIGURE 3
Effect of inhibiting MAOA on GIG progression in the GIG mouse model. (a) Protein expression levels of MAOA in TM of vehicle, DEX‐Ace, LY294002 + vehicle, and LY294002 + DEX‐Ace groups (n = 3 mouse eyes). (b) Effect of Moclobemide (Moc; MAOA inhibitor; 40 mg/kg, once every 2 days for 8 weeks) on IOP elevation in the GIG mouse model (red asterisk: Vehicle vs. DEX‐Ace; orange asterisk: DEX‐Ace vs. Moc + DEX‐Ace; n = 10 mouse eyes). (c) Representative images of mitochondrial morphology in the TM region from each group captured by electron microscopy. White arrows: Damaged mitochondria (n = 3 mouse eyes). Scale bar = 10 μm (upper images)/2 μm (upper images)/1 μm (lower images). CB, ciliary body; SC, Schlemm's canal; S, sclera; TM, trabecular meshwork. Data are presented as mean ± SD. One‐way ANOVA followed by Tukey's test. *p < 0.05, **p < 0.01, ***p < 0.001, ****p < 0.0001. All experiments were biologically replicated at least three times.
FIGURE 4
FIGURE 4
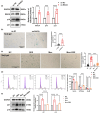
PI3K/AKT pathway regulates mitochondrial membrane enzyme MAOA, impacting pHTMs oxidative stress. (a) The effect of PI3K inhibition on MAOA overexpression in pHTMs. (b) The effect of PIK3R1 downregulation on MAOA expression in pHTMs. (c) Expression of MAOA protein in pHTMs after overexpression of MAOA by transient transfection of plasmids. (d) Representative ROS staining images (n = 10 fields per group). Scale bar = 200 μm. (e) Mitochondrial membrane potential by TMRE staining (n = 12 fields per group). Scale bar = 500 μm. (f) Representative ROS images after Moclobemide (50 μM, 72 h) processing of pHTMs (n ≥ 9 fields per group). Scale bar = 500 μm. (g) Mitochondrial superoxide levels detected using MitoSOX Red (n ≥ 13 fields per group). Scale bar = 500 μm. The experiments were conducted using cell strains cultured from three separate donors. Data are presented as mean ± SD. Unpaired t‐test (c, d, e). One‐way ANOVA followed by Tukey's test (a, b, f, g). **p < 0.01, ***p < 0.001, ****p < 0.0001.
FIGURE 5
FIGURE 5
PI3K/AKT/MAOA pathway modulates TM aging in the GIG mouse model. (a) KEGG analysis of DEGs between the DEX and si‐PIK3R1 + DEX groups. (b) Representative immunofluorescence images of anterior chamber angle from the vehicle and the DEX‐Ace group after 8 weeks of DEX‐Ace treatment, p21 was stained as a senescence marker, TM region was labeled using α‐smooth muscle actin (α‐SMA), and the nuclei were stained with DAPI (n = 3 mouse eyes). Scale bar = 200 μm. (c) LY294002 (PI3K inhibitor; 50 mg/kg, once weekly for 8 weeks) inhibited the protein expression levels of aging markers p16 and p21 in TM of GIG mice (n = 3 mouse eyes). (d) Representative immunofluorescence images. LY294002 reversed the DEX‐Ace‐induced increase of p21 expression in TM. The TM region was labeled using α‐SMA, and the nuclei were stained with DAPI. Scale bar = 200 μm. (e) Moclobemide (Moc; MAOA inhibitor; 40 mg/kg, once every 2 days for 8 weeks) inhibited the protein expression levels of aging markers p16 and p21 in TM of GIG mice (n = 3 mouse eyes). CB, Ciliary body. Data are presented as mean ± SD. One‐way ANOVA followed by the Tukey's test. **p < 0.01, ***p < 0.001, ****p < 0.0001. All experiments were biologically replicated at least three times.
FIGURE 6
FIGURE 6
PI3K/AKT pathway inhibition prevented DEX‐induced pHTMs premature senescence. (a) Percentage of senescent cells assessed using Sa‐β‐galactosidase staining after LY294002 (50 μM, 72 h) treatment (n ≥ 10 fields per group). Scale bar = 200 μm. (b) Cell cycle changes detected by flow cytometry with PI staining. (c) Expression of p21 and p16 at the protein level. (d) Percentage of senescent cells assessed using Sa‐β‐galactosidase staining after knocking down PIK3R1 (n ≥ 10 fields per group). Scale bar = 200 μm. (e) Cell cycle changes detected by flow cytometry with PI staining. (f) Expression of p21 and p16 at the protein level. The experiments were conducted using cell strains cultured from three separate donors. Data are presented as mean ± SD. One‐way ANOVA followed by Tukey's test. *p < 0.05, **p < 0.01, ****p < 0.0001.
FIGURE 7
FIGURE 7
Inhibition of MAOA attenuates DEX‐induced premature senescence in pHTMs. (a) MAOA overexpression increased the protein expression of p21 and p16. (b) The percentage of β‐galactosidase positive cells quantified using Sa‐β‐gal staining (n ≥ 10 fields per group). Scale bar = 200 μm. (c) Representative images for Sa‐β‐gal staining after Moclobemide (50 μM, 72 h) treatment (n = 16 fields per group). Scale bar = 200 μm. (d) Cell cycle changes of pHTMs detected by flow cytometry with PI staining. (e) Effect of Moc‐induced inhibition of MAOA on p21 and p16 levels in DEX‐treated pHTMs. The experiments were conducted using cell strains cultured from three separate donors. Data are presented as mean ± SD. Unpaired t‐test (a, b). One‐way ANOVA followed by the Tukey's test (c, d, e). *p < 0.05, **p < 0.01, ***p < 0.001, ****p < 0.0001.

References

    1. Antonucci, S. , Di Sante, M. , Tonolo, F. , Pontarollo, L. , Scalcon, V. , Alanova, P. , Menabo, R. , Carpi, A. , Bindoli, A. , Rigobello, M. P. , Giorgio, M. , Kaludercic, N. , & Di Lisa, F. (2021). The determining role of mitochondrial reactive oxygen species generation and monoamine oxidase activity in doxorubicin‐induced cardiotoxicity. Antioxidants & Redox Signaling, 34, 531–550. - PMC - PubMed
    1. Artzatbanov, V. , Muller, M. , & Azzi, A. (1987). Isolation and partial characterization of the cytochrome c oxidase of Micrococcus luteus (lysodeikticus). Archives of Biochemistry and Biophysics, 257, 476–480. - PubMed
    1. Caplan, A. , Fett, N. , Rosenbach, M. , Werth, V. P. , & Micheletti, R. G. (2017). Prevention and management of glucocorticoid‐induced side effects: A comprehensive review: A review of glucocorticoid pharmacology and bone health. Journal of the American Academy of Dermatology, 76, 1–9. - PubMed
    1. Chen, C. H. , & Wu, B. J. (2023). Monoamine oxidase a: An emerging therapeutic target in prostate cancer. Frontiers in Oncology, 13, 1137050. - PMC - PubMed
    1. Chhunchha, B. , Singh, P. , Stamer, W. D. , & Singh, D. P. (2017). Prdx6 retards senescence and restores trabecular meshwork cell health by regulating reactive oxygen species. Cell Death Discovery, 3, 17060. - PMC - PubMed

MeSH terms

LinkOut - more resources