. 2025 Apr;73(4):857-872.
doi: 10.1002/glia.24659. Epub 2024 Dec 17.

Alzheimer's Disease Risk Gene SORL1 Promotes Receptiveness of Human Microglia to Pro-Inflammatory Stimuli

Affiliations

Alzheimer's Disease Risk Gene SORL1 Promotes Receptiveness of Human Microglia to Pro-Inflammatory Stimuli

Peter Lund Ovesen et al. Glia. 2025 Apr.

Abstract

Sorting protein-related receptor containing class A repeats (SORLA) is an intracellular trafficking receptor encoded by the Alzheimer's disease (AD) gene SORL1 (sortilin-related receptor 1). Recent findings argue that altered expression in microglia may underlie the genome-wide risk of AD seen with some SORL1 gene variants, however, the functional significance of the receptor in microglia remains poorly explained. Using unbiased omics and targeted functional analyses in iPSC-based human microglia, we identified a crucial role for SORLA in sensitizing microglia to pro-inflammatory stimuli. We show that SORLA acts as a sorting factor for the pattern recognition receptor CD14, directing CD14 exposure on the cell surface and priming microglia to stimulation by pro-inflammatory factors. Loss of SORLA in gene-targeted microglia impairs proper CD14 sorting and blunts pro-inflammatory responses. Our studies indicate an important role for SORLA in shaping the inflammatory brain milieu, a biological process important to local immune responses in AD.

Keywords: Alzheimer's disease; SORLA; VPS10P domain receptors; brain inflammation; microglia.


Conflict of interest statement

The authors declare no conflicts of interest.

Figures
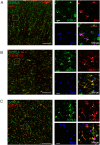
FIGURE 1
FIGURE 1
Expression of SORLA in microglia of the human brain. Immunohistochemical staining of SORLA (green) in human cortical brain tissue from two individual donors are shown. Sections from one donor were co‐stained for microglial marker IBA1 (red, A). Sections from a second donor were co‐stained for microglial marker TMEM119 (red, B) or P2RY12 (red, C). Nuclei were counterstained with DAPI (blue). White boxes in the overview images mark the higher magnification areas shown in the right panels. Arrowheads indicate SORLA immunoreactivity in IBA1+, TMEM119+, or P2RY12+ cells. Scale bars: 200 μm (overview images), 20 μm (magnified images).
FIGURE 2
FIGURE 2
Differentiation of WT and KO‐B1 iPSCs into human microglia. (A) Protocol used for differentiation of iPSCs into microglia (iMG) (for details, see Methods). (B) Phase contrast images of iPSCs, hematopoietic progenitors (HP), and iMG at different stages of microglia differentiation of WT and KO‐B1. For Day 38 of differentiation, overview as well as higher magnification images are given. Scale bars: 1000 μm (Day 0 and Day 3), 200 μm (Day 12 and Day 38), 20 μm (Day 38 zoom‐in). (C) Quantitative RT‐PCR of SORL1 transcript levels in WT iPSCs (Day 0), HP (Day 12), and iMG (Day 38). Relative quantification (RQ) fold changes represent 2−ddCt relative to iPSC. GAPDH and TBP were used as reference genes (n = 5 biological replicates). (D) Quantitative RT‐PCR of pluripotency markers NANOG, OCT4 as well as microglia markers IBA1, P2RY12, CX3CR1, and TREM2 in WT and KO‐B1 iPSCs (Day 0), HPs (Day 12), and iMG (Day 38). Relative quantification (RQ) fold changes represent 2−ddCt relative to iPSC. GAPDH and TBP were used as reference genes (WT n = 5, KO‐B1 n = 5 biological replicates of all conditions). (E) Immunofluorescence detection of IBA1 (red) and P2RY12 (green) demonstrates comparable homogeneity of iMG cell preparations from WT and SORLA KO‐B1 iPSCs. Nuclei were counterstained with DAPI (blue). Scale bars: 50 μm.
FIGURE 3
FIGURE 3
SORLA deficiency in iMG induces transcriptome changes associated with intracellular vesicle biology and immune cell activation. (A) Principal component analysis of bulk RNA sequencing data from WT and KO‐B1 iMG, documents separation of samples into the two genotype groups (n = 6 biological replicates). (B) Volcano plot based on comparative bulk RNAseq showing fold change of differential gene expression in WT versus KO‐B1 iMG as red dots (adjusted p‐value < 0.05). The 20 most significantly expressed genes are listed in the volcano plot. (C, D) Gene ontology (GO) analyses of differentially expressed genes (DEGs) in WT versus KO‐B1 iMG performed using R. (C) Cellular components enriched in KO iMG are associated with vesicular trafficking in endo‐lysosomal compartments. (D) Biological processes enriched in KO iMG are linked to immune cell activation, phagocytosis, and cell migration. Fold enrichment is calculated by dividing the percentage of DEGs in the respective GO term by the corresponding percentage in the background gene list. Size of the dots represents the number of DEGs in the respective GO term. Color (blue‐to‐red) indicates the level of significance, by adjusted p‐value, of the respective GO term. (E) Localization of SORLA to the indicated subcellular compartments in WT iMG. The extent of localization was determined by Pearson's correlation coefficient of immunostainings exemplified in Figure S2 (n = 60–100 cells per condition). (F, G) Total cell area (left panel) and average vesicle size (right panel) of endosomal (F) and lysosomal compartments (G) in WT as compared to KO‐B1 and KO‐F2 iMG lines. Data were obtained by ImageJ particle analysis of immunostainings for EEA1 (F) and LAMP1 (G) exemplified in Figure S3. (n = 15–24 cells per marker). Statistical significance of data was determined using one‐way ANOVA corrected for multiple testing by Dunnett.
FIGURE 4
FIGURE 4
SORLA deficiency does not impact motility or phagocytic properties of human iMG. (A, B) Motility of WT and KO (B1 and F2 clones) iMG was tested using the scratch‐wound assay. Phase contrast images of WT iMG at 0‐ and 24‐h post‐scratch are given in A. White lines mark the scratch area. Scale bar: 500 μm. Quantifications of relative wound densities in WT and KO iMG cell layers based on cell confluency in scratched versus nonwounded areas at the indicated time points post‐scratch are given in B (WT n = 4, KO‐B1 n = 3, KO‐F2 n = 4 independent experiments). (C, D) Phagocytosis of Zymosan Green pHrodo particles by WT and KO‐B1 and KO‐F2 iMG as analyzed by live fluorescence imaging using Incucyte SX5. Phase contrast images of cells documenting Zymosan uptake (green fluorescence signal) at 0 and 24 h after particle addition to WT and KO iMGs are shown in C. Scale bar: 200 μm. Quantification of particle uptake as ratio of Zymosan signal normalized to cell area over time are shown in D (WT n = 5, KO‐B1 n = 5, KO‐F2 n = 3 independent experiments). (E, F) Phagocytosis of E. coli Red pHrodo particles in WT and KO‐B1 and KO‐F2 iMG as analyzed by live fluorescence imaging using Incucyte SX5. Phase contrast images of cells highlighting E. coli uptake (red fluorescence signal) at 0 and 24 h after particle addition are shown in E. Scale bar: 200 μm. Quantification of E. coli Red pHrodo particle uptake in WT and KO iMG over time, determined as the ratio of E. coli red signal normalized to cell area, are given in F (WT n = 3, KO‐B1 n = 3, KO‐F2 n = 3 independent experiments). (G, H) Phagocytosis of oligomeric (G) or fibrillary (H) forms of Fluor 488‐labeled amyloid‐β particles (HiLyte Aβ) in WT and KO iMG. Uptake was quantified as cellular fluorescence of HiLyte Aβ normalized to the cell area. (WT n = 4, KO‐B1 n = 4, KO‐F2 n = 4 independent experiments). Statistical significance of data was determined by two‐way ANOVA with repeated measures (G, H) or by mixed‐effect model (B, D, F).
FIGURE 5
FIGURE 5
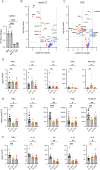
SORLA deficiency impairs the pro‐inflammatory response of human iMG. (A) Quantification of SORL1 transcript levels in WT iMG stimulated with IL4 (anti‐inflammatory), LPS (pro‐inflammatory), or poly(I:C) (pro‐inflammatory). Relative quantification (RQ) fold changes represent 2−ddCt relative to unstimulated control (PBS). GAPDH, TBP, and HPRT1 were used as reference genes (PBS n = 5, IL4 n = 6, poly(I:C) n = 6, LPS n = 6 biological replicates). (B, C) Multiplex immunoassays of 92 inflammatory biomarkers (Olink inflammation panel) were performed on media samples from WT and KO‐B1 iMG treated with 10 μg/mL poly(I:C) (B), or 100 ng/mL LPS (C) for 24 h. Differential expression levels of tested markers are given as Volcano plots with log2(fold change) and −log10(p‐value). Red and blue dots indicate molecules that are downregulated or upregulated in KO media samples, respectively. Gray horizontal and vertical lines represent nonadjusted p values equal to 0.05 and log2(fold change) of −1 and 1, corresponding to a halving or doubling in protein expression, respectively. Proteins with a p‐value < 0.05 are listed in the plot. Proteins with p‐value < 0.05 and log2(fold change) less than −1 and above 1 are highlighted and labeled in bold font. (D, E) Multiplex ELISA of TNFα, IL1β, IL6, IFNβ, and RANTES levels in media samples from unstimulated control (PBS) (D) or poly(I:C) (E) treated WT as well as KO‐B1 and KO‐F2 iMG (n = 8–12 biological replicates for all conditions and genotypes). (F) Multiplex ELISA of TNFα, IL1β, IL6, IL10, and IL18 levels in media samples from WT as well as KO‐B1 and KO‐F2 iMG treated with LPS (n = 9 for all conditions and genotypes). Statistical significance of data was determined using one‐way ANOVA (A) with repeated measures (F) or mixed‐effect model (D, E) and corrected for multiple testing by Dunnett.
FIGURE 6
FIGURE 6
SORLA is a sorting receptor for CD14 in human iMG. (A) ELISA of soluble CD14 (sCD14) levels in media samples from PBS or LPS stimulated WT, KO‐B1, and KO‐F2 iMG (n = 8–10 biological replicates for all conditions and genotypes). (B, C) Flow cytometry‐based analysis of CD14 expression at the cell surface of PBS or LPS stimulated WT, KO‐B1, and KO‐F2 iMG. In panel B, gating of cells for the analysis by forward‐side scatter (upper left panel) followed by live–dead (BV450) and CD14 (PE) stains are shown. Panel C depicts quantification of CD14 signals in the indicated iMG lines as analyzed by mean fluorescence intensity (n = 6 biological replicates for all conditions and genotypes). (D) Immunofluorescence detection of CD14 (green) and markers of subcellular compartments in WT and KO‐F2 iMG. White arrowheads exemplify colocalization of CD14 with LAMP1 or TGN46 in the respective merged images. Scale bars: 10 μm. (E) Analysis of CD14 localization to LAMP1+ or TGN46+ cell areas determined by Mander's correlation coefficient of immunostainings exemplified in D (n = 100 cells per condition from two independent experiments). (F) Co‐immunoprecipitation of SORLA and CD14 from transfected HEK293 cells. Immunoprecipitation of CD14 (IP (CD14)) co‐precipitates SORLA in co‐transfected cells, but not in cells transfected with CD14 or SORLA expression constructs only (left panel). Immunoprecipitation of SORLA (IP (SORLA)) co‐precipitates CD14 in co‐transfected cells (right panel). GAPDH was not co‐precipitated in any of the experiments. The migration of protein marker bands of the indicated molecular weights (in kDa) are given. Statistical significance of data was determined using Student's t‐test (E), two‐way ANOVA with repeated measures (C), or the mixed‐effect model (A) and corrected for multiple testing by Dunnett.
FIGURE 7
FIGURE 7
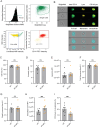
SORLA regulates the intracellular distribution of CD14 in iMG. Intracellular distribution of CD14 in WT and KO‐B1 iMG was analyzed by imaging flow cytometry (n = 7 biological replicates from five independent experiments, each replicate represents an average of 5000–10,000 cells tested). (A) Gating of cell populations for analysis by focus (upper left), single cells (upper right), viability (lower left), or CD14/Lysotracker positive cells (lower right panel) are shown. (B) Brightfield images as well as images of immunosignals for intracellular CD14, Lysotracker, as well as CD14 and Lysotracker overlays in three representative WT cells. Full cell masks generated from the brightfield images were used to separate membrane and intracellular compartments. The cell membrane compartment was defined as the three outmost pixels (300 × 300 nm/pixel) of the full cell mask around the entire circumference of the cell as indicated by teal coloring. The intracellular compartment includes the total mask with the subtraction of the membrane mask. (C, D) Quantification of cell size (C; in arbitrary units, A.U.) and shape (D; circularity index) in WT and KO‐B1 iMG based on the full cell mask. (E–G) Quantification of intracellular Lysotracker signal was used to determine total mean fluorescence intensity of lysosomes (MFI; E), total lysosomal area (F), as well as single lysosome vesicle size (G). (H) Quantification of intracellular CD14 signal, measured by MFI. (I) Quantification of co‐localization between intracellular CD14 and Lysotracker, analyzed as percentage of CD14 signal located in Lysotracker positive areas. Statistical significance of data was determined by paired Student's t‐test.

References

    1. Andersen, M. N. , Al‐Karradi S. N. H., Kragstrup T. W., and Hokland M.. 2016. “Elimination of Erroneous Results in Flow Cytometry Caused by Antibody Binding to Fc Receptors on Human Monocytes and Macrophages.” Cytometry, Part A: Journal of the International Society for Analytical Cytology 89, no. 11: 1001–1009. 10.1002/cyto.a.22995. - DOI - PubMed
    1. Andersen, O. M. , Reiche J., Schmidt V., et al. 2005. “Neuronal Sorting Protein‐Related Receptor sorLA/LR11 Regulates Processing of the Amyloid Precursor Protein.” Proceedings of the National Academy of Sciences of the United States of America 102, no. 38: 13461–13466. 10.1073/pnas.0503689102. - DOI - PMC - PubMed
    1. Andersen, O. M. , Rudolph I.‐M., and Willnow T. E.. 2016. “Risk Factor SORL1: From Genetic Association to Functional Validation in Alzheimer's Disease.” Acta Neuropathologica 132, no. 5: 653–665. 10.1007/s00401-016-1615-4. - DOI - PMC - PubMed
    1. Baumann, C. L. , Aspalter I. M., Sharif O., et al. 2010. “CD14 Is a Coreceptor of Toll‐Like Receptors 7 and 9.” Journal of Experimental Medicine 207, no. 12: 2689–2701. 10.1084/jem.20101111. - DOI - PMC - PubMed
    1. Bellenguez, C. , Küçükali F., Jansen I. E., et al. 2022. “New Insights Into the Genetic Etiology of Alzheimer's Disease and Related Dementias.” Nature Genetics 54, no. 4: 412–436. 10.1038/s41588-022-01024-z. - DOI - PMC - PubMed

MeSH terms

Substances