. 2024 Dec 17;19(12):e0314520.
doi: 10.1371/journal.pone.0314520. eCollection 2024.

Development of a new methodology for the determination of PET microplastics in sediment, based on microwave-assisted acid digestion

Affiliations

Development of a new methodology for the determination of PET microplastics in sediment, based on microwave-assisted acid digestion

Marco Perez et al. PLoS One. .

Abstract

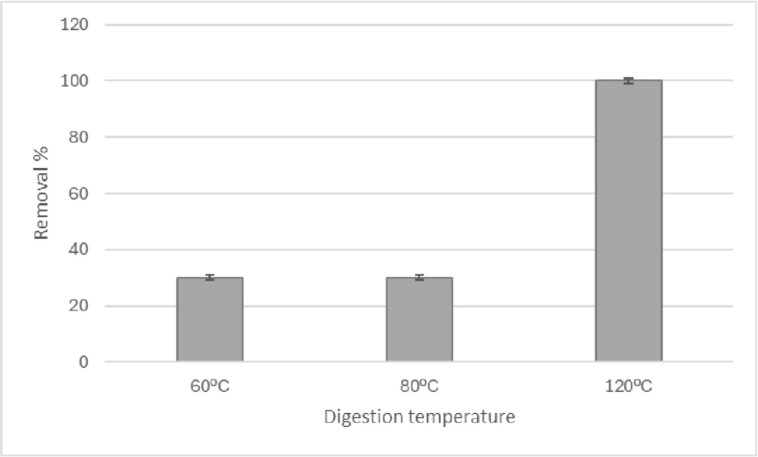
Analytical methods for the determination of microplastics in sediments typically involve matrix drying, sieving, grinding, and flotation as part of the sample treatment. However, the real need for these steps and analytical validation studies are scarce. This work proposes a method that avoids the drying, sieving, and flotation procedures by using a direct acid attack of HNO₃/HCl (3:1) on wet sediment samples, assisted by microwave digestion. For detection, induced fluorescence using a UV camera, with Nile Red (NR) as the fluorophore and a cell phone camera for image capture were used. The results showed that when the digestion temperature was raised to 120°C, PET recovery decreased due to plastic particle fusion. However, at 60°C, microwave digestion resulted in a 97% recovery of PET particles, eliminating chitin interference and canceling cellulose fluorescence without the need for flotation. This method proved effective for monitoring plastic microparticles in sediments from the Loa River, Chile, revealing that the river is predominantly contaminated with PET microparticles, particularly upstream in the Taira area.


Conflict of interest statement

The authors have declared that no competing interests exist.

Figures

Fig 1
Fig 1. Sampling sites for sediment collection along the Loa River, Chile.
Figure adapted from OpenStreetMap.
Fig 2
Fig 2. Flowchart of the method for determining PET MPs in sediment samples.
The red arrows indicate the analytical purpose of each stage.
Fig 3
Fig 3
Results of staining of a) pre-digestion cellulose and b) post-digestion cellulose. Photographed at the excitation wavelength of 254 nm.
Fig 4
Fig 4
Results of the staining of the MPs used in this study, pre- digestion 254 nm a1) PET, b1) LDPE, c1) PP and d1) PS; post-digestion 254 nm a2) PET, b2) LDPE, c2) PP and d2) PS; post-digestion 365 nm a3) PET, b3) LDPE, c3) PP and d3) PS.
Fig 5
Fig 5. Results of the mass percentage recovery of microplastics at different temperatures of Microwave-assisted digestion, using HNO3/HCl mixture 3:1 v/v, for a time of 1 hour.
Fig 6
Fig 6. Melted LDPE microparticles, because of microwave-assisted acid digestion, for one hour at 120°C.
Fig 7
Fig 7. Removal of cellulose, in the digestion stage, at three different temperatures.
Fig 8
Fig 8. Spike and recovery of PET microplastics (MPs) was conducted under the following digestion conditions: Isolated PET microplastic particles (MPs PET), PET microplastics spiked into marine sediments (MPs PET with sediments), and a mixture of microplastic polymers (MPs Mix).
Fig 9
Fig 9. Spike and recovery results at different levels of MPs PET masses.
Fig 10
Fig 10
Identification of fluorescent emission colors for post-digestion microplastics standards of PET (a), PE (b), and PP (c) by using ChatGPT-4.0 artificial intelligence. The upper section provides the minimum and maximum RGB color range from IA color recognition for each plastic. To test the color range, images of fluorescent particles from each standard (1) were analyzed separately as samples using the same color range and each identified particle was marked in white (2).
Fig 11
Fig 11. Detection of PET, PE, and PP microplastic particles in a sediment sample from the Loa River using the RGB ranges proposed by the ChatGPT-4.0 artificial intelligence.
Fig 12
Fig 12. Determination of PET microplastic particles in sediment samples from the Loa River in Chile (n = 3).

References

    1. Lu HC, Ziajahromi S, Neale PA, Leusch FDL. A systematic review of freshwater microplastics in water and sediments: Recommendations for harmonisation to enhance future study comparisons. Science of the Total Environment. 2021;781. doi: 10.1016/j.scitotenv.2021.146693 - DOI
    1. Hidalgo-Ruz V, Gutow L, Thompson RC, Thiel M. Microplastics in the marine environment: A review of the methods used for identification and quantification. Environmental Science and Technology. 2012;46(6):3060–75. doi: 10.1021/es2031505 - DOI - PubMed
    1. Phuong NN, Fauvelle V, Grenz C, Ourgaud M, Schmidt N, Strady E, et al.. Highlights from a review of microplastics in marine sediments. Science of the Total Environment. 2021;777. doi: 10.1016/j.scitotenv.2021.146225 - DOI
    1. Lorenz C, Roscher L, Meyer MS, Hildebrandt L, Prume J, Löder MGJ, et al.. Spatial distribution of microplastics in sediments and surface waters of the southern North Sea. Environmental Pollution. 2019;252:1719–29. doi: 10.1016/j.envpol.2019.06.093 - DOI - PubMed
    1. Curren E, Kuwahara VS, Yoshida T, Leong SCY. Marine microplastics in the ASEAN region: A review of the current state of knowledge. Environmental Pollution. 2021;288. doi: 10.1016/j.envpol.2021.117776 - DOI - PubMed

LinkOut - more resources