. 2024 Dec 17;18(12):e0012716.
doi: 10.1371/journal.pntd.0012716. eCollection 2024 Dec.

Genome alteration of Leishmania orientalis under Amphotericin B inhibiting conditions

Affiliations

Genome alteration of Leishmania orientalis under Amphotericin B inhibiting conditions

Pornchai Anuntasomboon et al. PLoS Negl Trop Dis. .

Abstract

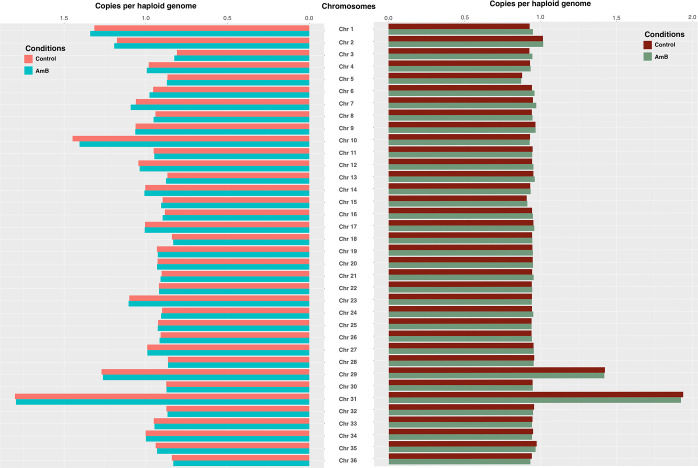
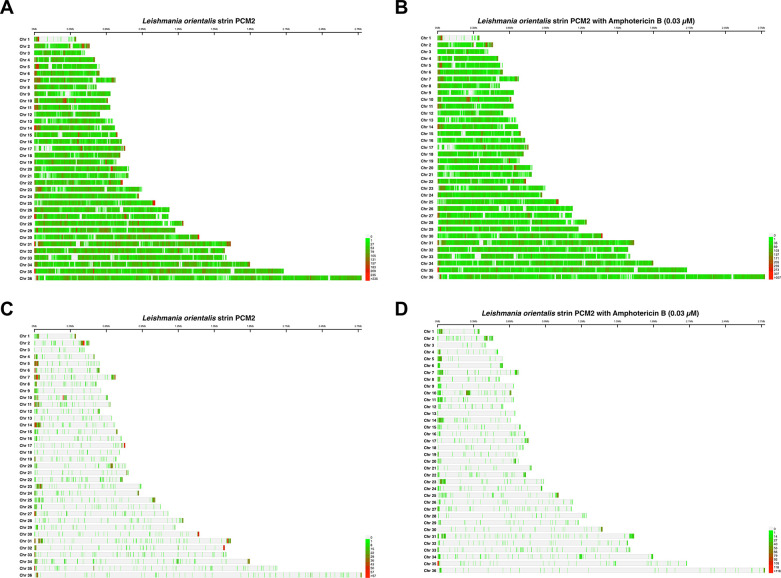
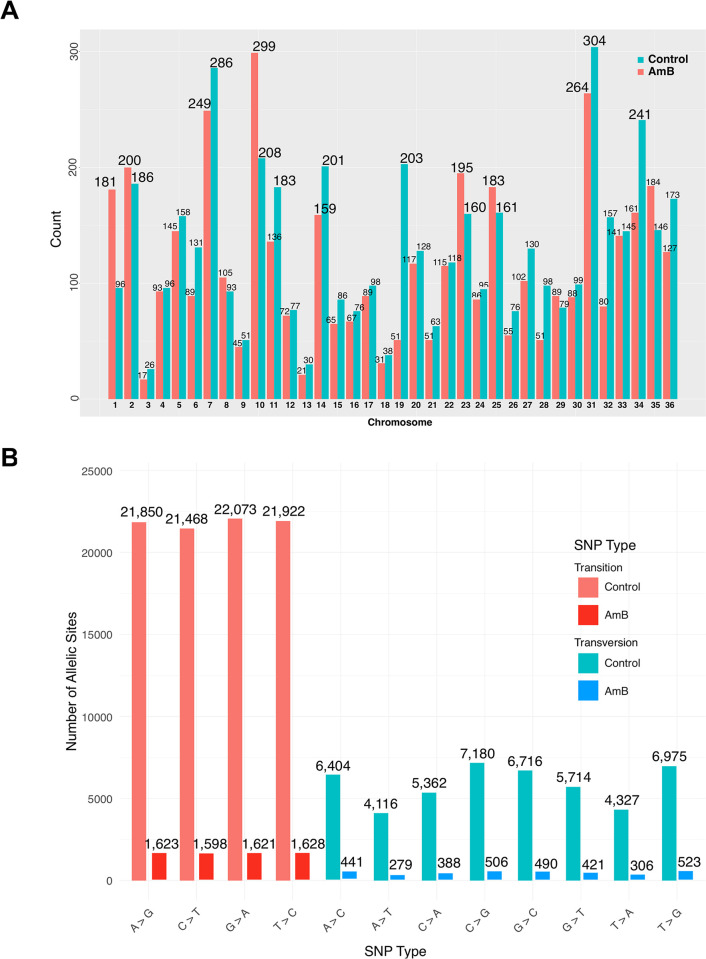
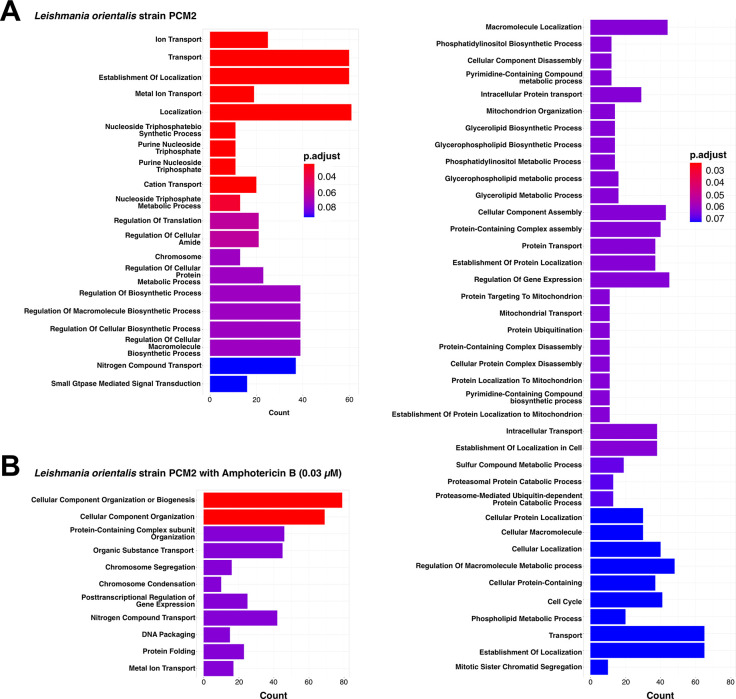
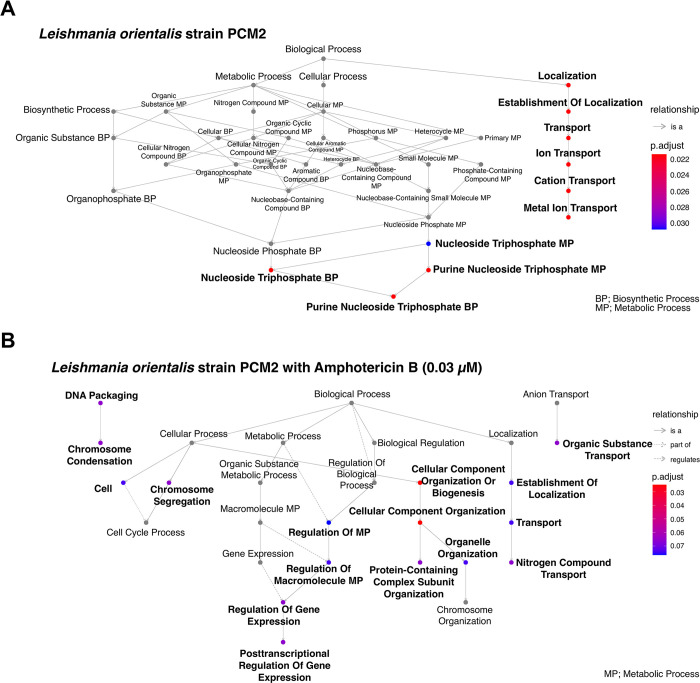
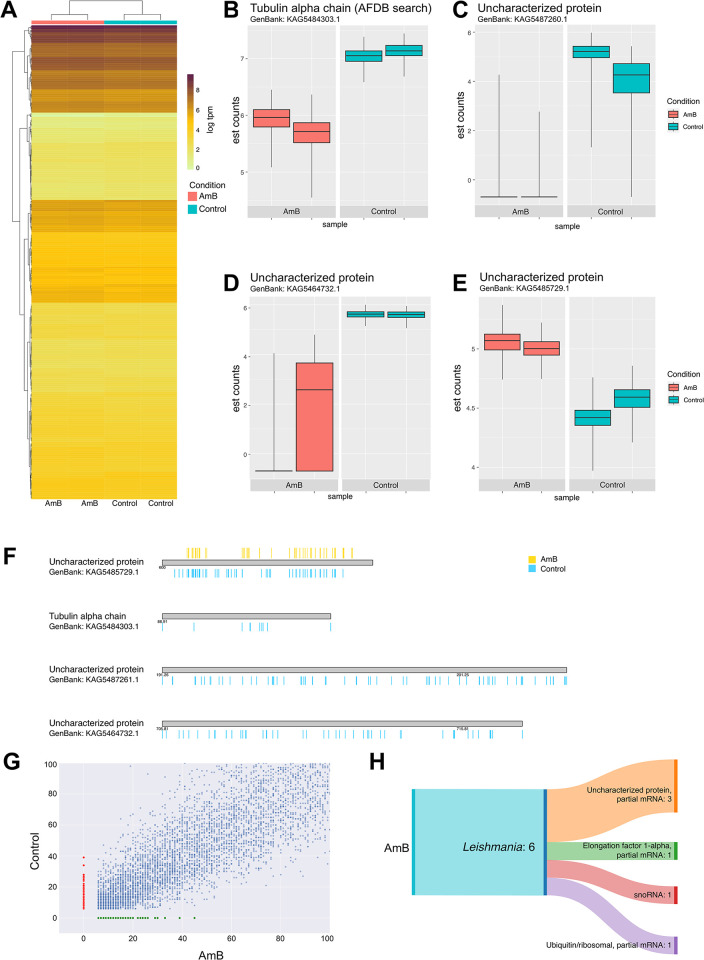
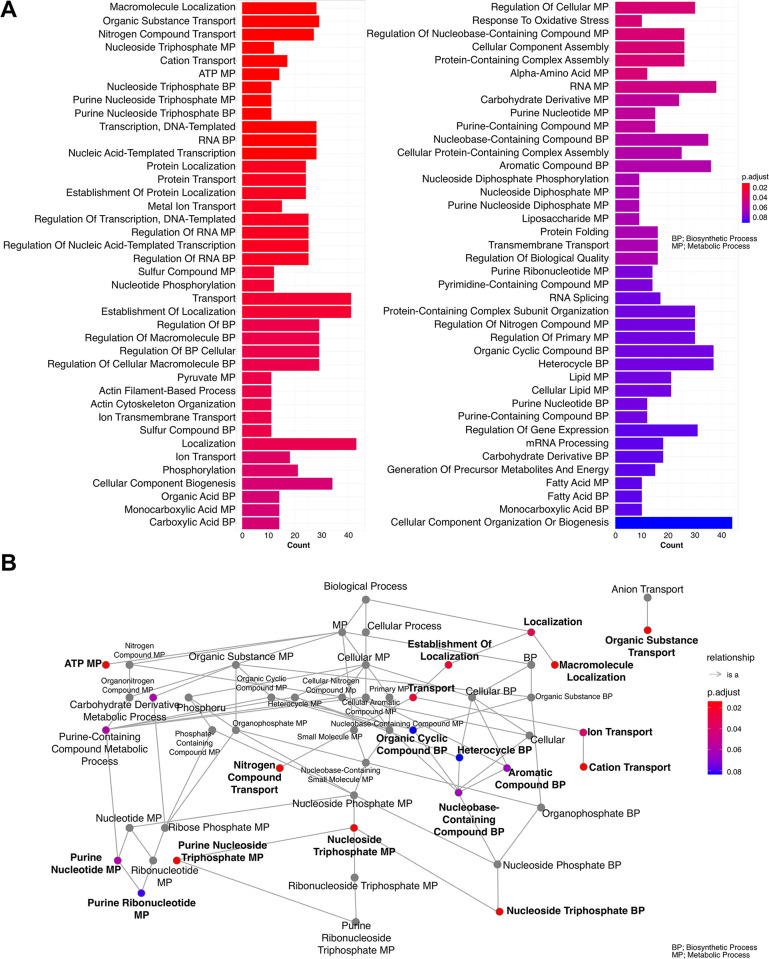
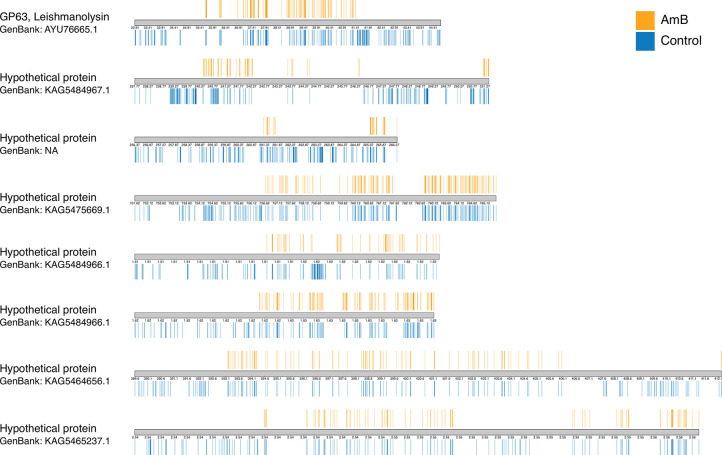
Amphotericin B (AmB) is a potent antifungal and antiparasitic medication that exerts its action by disrupting the cell membrane of the leishmanial parasite, leading to its death. Understanding the genetic alterations induced by Amphotericin B is crucial for gaining insights into drug resistance mechanisms and developing more effective treatments against Leishmania infections. As a new Leishmania species, the molecular response of Leishmania orientalis to anti-leishmanial drugs has not been fully explored. In this study, Leishmania orientalis strain PCM2 culture was subjected to AmB exposure at a concentration of 0.03 uM over 72 hours compared to the control. The genomic alteration and transcriptomic changes were investigated by utilising the whole genome and RNA sequencing methods, followed by the analysis of single nucleotide polymorphisms (SNPs), differential gene expression, and chromosomal copy number variations (CNVs) assessed using read depth coverage (RDC) values across the entire genome. The chromosomal CNV analysis showed no significant difference between L. orientalis from the control and AmB-treated groups. The distribution of SNPs displayed notable variability, with higher SNP incidence in the control group compared to the AmB-treated group. Gene ontology analysis unveiled functions of the SNPs -associated genes involved in transporter function, genetic precursor synthesis, and purine nucleotide metabolism. Notably, the impact of AmB treatment on the L. orientalis gene expression profiles exhibited diverse expressional alterations, particularly the downregulation of pivotal genes such as the tubulin alpha chain gene. The intricate interplay between SNPs and gene expression alterations might underscore the complex regulatory networks underlying the AmB resistance of L. orientalis strain PCM2.


Conflict of interest statement

The authors have declared that no competing interests exist.

Figures

Fig 1
Fig 1. The graphs represented the estimation of the chromosome number and number of chromosomal copies of Leishmania orientalis strain PCM2 from the genomic reads based on the read depth coverage (RDC) per haploid genome compared between the L. orientalis growth under the 0.03 μm AmB-treated (AmB) and AmB-free (control) conditions in triplicates.
The RDC values were calculated from the whole genome in triplicates (left panel) and from only the coding sequences (right panel). The x-axis showed the number of chromosomal copies per haploid genome, and the y-axis showed the L. orientalis chromosomes.
Fig 2
Fig 2
Comparative analysis of single nucleotide polymorphisms (SNPs) distribution across the chromosomes of L. orientalis strain PCM2 cultured in the Amphotericin B-free control (A) and the Amphotericin B-treated group (B). Unique SNPs emerging solely within the control (C) or treatment (D) groups were selectively presented. The x-axis showed nucleotide positions summarised as the bin size of 10,000 bp, and the y-axis represented the L. orientalis chromosomes. The colour scale indicated the graph’s SNP density per bin size: red for the high number of SNPs and green for the low number of SNPs per bin.
Fig 3
Fig 3
Comparison of the single nucleotide polymorphism (SNPs) number across the chromosomal landscape of L. orientalis strain PCM2 under the Amphotericin B-treated (red) and control (green) groups. The x-axis indicated the chromosome number, and the y-axis showed the number of SNPs. The SNP number of each chromosome was labelled on the bar graph (A). The altered distribution of SNPs across the genome was categorised by types of base substitutions (transition and transversion) on the Y-axis. Each point on the X-axis represented the count of base substitutions at specific allelic sites. Different colours indicated distinct allelic types or categories, visually representing the frequency and distribution of SNPs (B).
Fig 4
Fig 4. Enrichment analysis of distinct single nucleotide polymorphisms (SNPs) categorised according to the gene ontology’s biological process (BP) in L. orientalis strain PCM2.
The analysis encompassed both the normal condition (A) and the condition treated with Amphotericin B (AmB) (B lower left and right graphs). The colouration of enriched terms corresponded to their adjusted p-values, thereby delineating their statistical significance.
Fig 5
Fig 5. Enrichment map analysis of distinct single nucleotide polymorphisms (SNPs) categorised according to the gene ontology’s biological process (BP) in L. orientalis strain PCM2.
The analysis included SNP sets unique to the normal condition (A) and those exclusive to the Amphotericin B-treated condition (B). The colour gradient from blue to red indicates the significance of the enriched terms, and the connections illustrate the relationships between gene sets in each condition.
Fig 6
Fig 6. Comparative transcriptome analysis of differential gene expression of L. orientalis strain PCM2 under the Amphotericin B-free control (depicted in blue) and Amphotericin B-treated (depicted in red) conditions.
The differential expression of genes was evaluated through the Wald test and subjected to a q-value threshold of ≤ 0.5 (A). The colour gradient reflected the logarithmic mean of transcripts per million (TPM). Genes counts were estimated and compared between the two conditions, including tubulin alpha chain (B) and three uncharacterised proteins (C-E). The x-axis of the box plots showed experimental conditions, and the y-axis indicated estimated counts (est count). (F) The figure illustrated the distribution of single nucleotide polymorphisms (SNPs) within four specific genes in the AmB-treated group. The x-axis represented nucleotide positions aggregated into bins of 100 base pairs. The colour scale on the graph indicated the SNP density per bin size, with red indicating a high density of SNPs within a bin and green indicating a low density of SNPs within a bin. The scatter plot from the k-mer analysis identified unique read sequences exclusive to either the control (red dot) or AmB treatment (green dot) groups, highlighting potential control or AmB-specific transcripts or regulatory elements (G). Annotation of specific genes related to the AmB treatment condition using BLASTn classified into six candidate genes and represented in SankeyMATIC illustrator, highlighting potential cooperative role contributing to the observed response to AmB treatment (H).
Fig 7
Fig 7
Functional enrichment of gene ontology (GO) in the biological process (BP) category assigned to the differentially expressed genes from the comparison between L. orientalis strain PCM2 growth in the control and the AmB-treated conditions (A). The colour gradient represented the adjusted p-values. Hierarchical clustering employed Jaccard’s similarity index (J.C.) and Ward’s method to enrich the GO terms and labelled them with high-frequency similarity (B). An enrichment map presented enriched terms as a network by interconnecting overlapping gene sets. This visualisation enhanced the identification of functional modules arising from mutual gene sets.
Fig 8
Fig 8. The hierarchical clustering of the enriched GO terms derived from significant differential expressed genes of L. orientalis strain PCM2 under the growth in the AmB-treated and control conditions.
The clustering was based on pairwise similarities of enriched terms calculated using the Jaccard’s similarity index (JC). The function segmented the tree into five subtrees and labelled these subtrees with high-frequency words, and the radius of circular dots represented the gene number. The p-values were adjusted and classified from low (red) to high (blue), providing a visual representation of the significance of each term.
Fig 9
Fig 9. SNPs distribution and density changes of selected regions in the L. orientalis strain PCM2 genome.
This karyotype plot illustrated the distribution and density of SNPs in the upstream regions of the first eight genes with the highest SNP density. The plot compared SNPs between two conditions: normal (bottom panel, blue) and Amphotericin B-treated (top panel, orange).

Similar articles

References

    1. Handman E. Leishmaniasis: current status of vaccine development. Clinical microbiology reviews. 2001;14(2):229–43. doi: 10.1128/CMR.14.2.229-243.2001 - DOI - PMC - PubMed
    1. Cantacessi C, Dantas-Torres F, Nolan MJ, Otranto D. The past, present, and future of Leishmania genomics and transcriptomics. Trends in Parasitology. 2015;31(3):100–8. - PMC - PubMed
    1. Kazemi B. Genomic organization of Leishmania species. Iranian Journal of Parasitology. 2011;6(3):1. - PMC - PubMed
    1. Ivens AC, Peacock CS, Worthey EA, Murphy L, Aggarwal G, Berriman M, et al.. The genome of the kinetoplastid parasite, Leishmania major. Science. 2005;309(5733):436–42. - PMC - PubMed
    1. Beverley SM. Gene amplification in Leishmania. Annual review of microbiology. 1991;45(1):417–44. - PubMed

MeSH terms

LinkOut - more resources