. 2024 Dec 24;121(52):e2407517121.
doi: 10.1073/pnas.2407517121. Epub 2024 Dec 17.

Internal feedback circuits among MEX-5, MEX-6, and PLK-1 maintain faithful patterning in the Caenorhabditis elegans embryo

Affiliations

Internal feedback circuits among MEX-5, MEX-6, and PLK-1 maintain faithful patterning in the Caenorhabditis elegans embryo

Alexandre Pierre Vaudano et al. Proc Natl Acad Sci U S A. .

Abstract

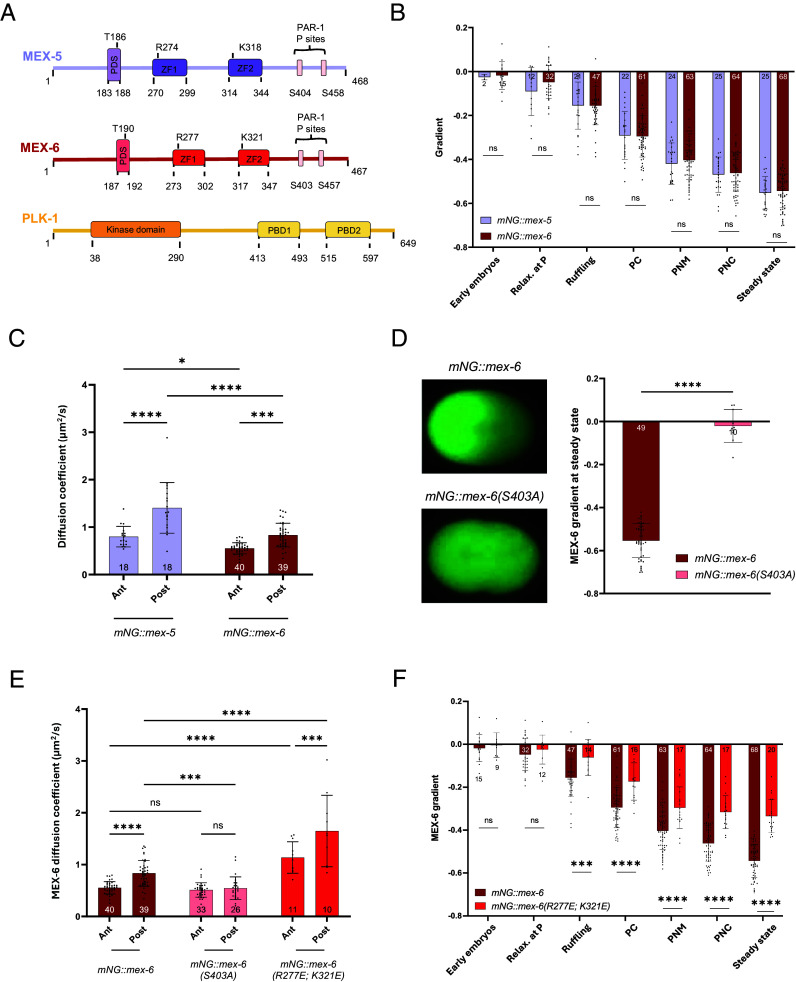
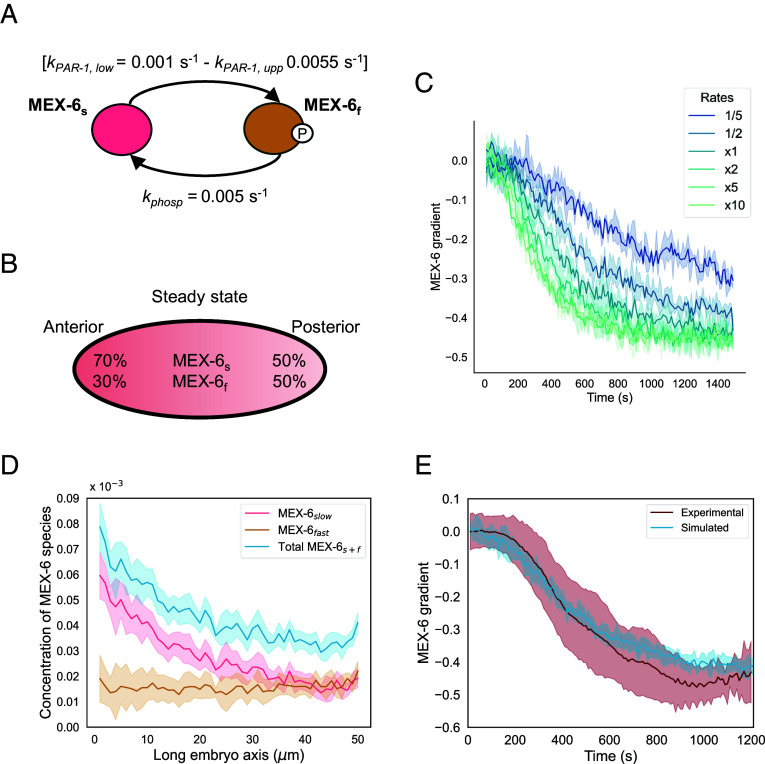
Proteins become asymmetrically distributed in the one-cell Caenorhabditis elegans embryo thanks to reaction-diffusion mechanisms that are often entangled in complex feedback loops. Cortical polarity drives the enrichment of the RNA-binding proteins MEX-5 and MEX-6 in the anterior cytoplasm through concentration gradients. MEX-5 and MEX-6 promote the patterning of other cytoplasmic factors, including that of the anteriorly enriched mitotic polo-like kinase PLK-1, but also contribute to proper cortical polarity. The gradient of MEX-5 forms through a differential-diffusion mechanism. How MEX-6 establishes a gradient and how MEX-5 and MEX-6 regulate cortical polarity is not known. Here, we reveal that the two MEX proteins develop concentration asymmetries via similar mechanisms, but despite their strong sequence homology, they differ in terms of how their concentration gradients are regulated. We find that PLK-1 promotes the enrichment of MEX-5 and MEX-6 at the anterior through different circuits: PLK-1 influences the MEX-5 gradient indirectly by regulating cortical polarity while it modulates the formation of the gradient of MEX-6 through its physical interaction with the protein. We thus propose a model in which PLK-1 mediates protein circuitries between MEX-5, MEX-6, and cortical proteins to faithfully establish and maintain polarity.

Keywords: MEX-5, MEX-6, PLK-1; Monte Carlo simulations; RNA binding proteins; polarity feedback loops; reaction–diffusion.


Conflict of interest statement

Competing interests statement:The authors declare no competing interest.

Figures

Fig. 1.
Fig. 1.
MEX-6 forms a gradient through a reaction–diffusion mechanism but diffuses slower than MEX-5. (A) Scheme of the MEX-5, MEX-6, and PLK-1 protein structures, showing the main interaction domains and the amino acids mutagenized in vivo by CRISPR. (B) mNG::MEX-5 and mNG::MEX-6 gradients as a function of time, shown for relevant timepoints during the first cell division (see legend below). The gradient is quantified as the slope of the linear fit of the signal along the anterior–posterior axis (Intensity/x). For simplicity, it will be referred to as “Gradient” or “Protein gradient” (e.g., MEX-6 gradient) in all the subsequent graphs. (C) Comparison of mNG::MEX-5 and mNG::MEX-6 diffusivity at both the anterior and posterior poles of one-cell embryos, at steady state. (D) Left, images of one-cell embryos showing the steady-state localization of mNG::MEX-6 and mNG::MEX-6(S403A); Right, quantification of their gradients at steady state. (E) Quantification of MEX-6 diffusion coefficient in the parental mNG::mex-6 strain and in the mNG::mex-6(S403A) and mNG::mex-6(R277E; K321E) mutants, measured at the anterior and posterior poles of embryos at steady state. (F) Comparison of mNG::MEX-6 and mNG::MEX-6(R277E; K321E) gradients as a function time. In (BF), the bars represent the average values of different measurements, and the error bars the SD. The number N of analyzed embryos is reported for each condition. Embryos from different experiments were pooled together and, for (B) and (C), these bar plots were used as control conditions in the following experiments. In (B, D, and F), the statistical analysis was performed, for each stage separately, using the two-tailed unpaired t test. In (C) and (E), the statistical analysis was done using the two-way ANOVA test, with Tukey’s multiple comparison. Legend: Relax. at P = relaxation at posterior; PC = pseudocleavage; PNM = pronuclear meeting; PNC = pronuclear centration. Ant = anterior; Post = posterior. For the statistics: ns: P > 0.5, *P < 0.05, **P < 0.01, ***P < 0.001, ****P < 0.0001. These conventions are kept in all figures.
Fig. 2.
Fig. 2.
MEX-6 slow diffusivity allows the formation of a gradient through differential diffusion. (A) Summary of the interconversion rates between slow (dephosphorylated) MEX-6s and fast (phosphorylated) MEX-6f. The phosphorylation rate by PAR-1 (kPAR-1) has an anterior lower value of kPAR-1,low and a posterior value of kPAR-1,upp. The PP2 phosphatase rate (kphosp) is constant throughout the embryo. The scheme reports the final values chosen for the simulation of MEX-6 gradient. (B) Scheme of a one-cell embryo showing the relative percentages of MEX-6s and MEX-6f, at the anterior and posterior sides and at steady state. (C) Simulation of the dynamics of the MEX-6 gradient in scenarios where the values of three reaction rates shown in (A) are multiplied or divided by constant factors (as in the legend). The steady-state gradient is not impacted within the tested range, but only the dynamics of the process. (D) Concentrations of slow (pink), fast (orange), and total (blue) MEX-6 as a function of space along the embryo axis at steady state (t = 20 min). The concentrations were calculated in a central, 5-µm thick slice of a 3D ellipsoidal model of the one-cell embryo, by dividing the number of molecules of each MEX-6 species in each voxel by the total number of simulated particles. (E) Comparison of the kinetics of gradient formation of mNG::MEX-6 from the experimental results (bordeaux) and the simulations (blue). In (CE), the solid lines represent the simulation results and are average values from at least five different simulation runs. For the experimental curve in (E), the curve is the average of 10 embryos. The shaded areas represent the SD.
Fig. 3.
Fig. 3.
Replacing the ZF domains between MEX-5 and MEX-6 does not change their diffusivity but results in a less steep gradient. (A) Alignment of the first (Top) and second (Bottom) ZF domains of MEX-5 and MEX-6. It shows in black the identical amino acids, in blue the similar amino acids, and in red the amino acids that are not conserved. (B) Scheme of the design of the mex-5(MEX-6 ZF) and mex-6(MEX-5 ZF) mutant strains obtained by CRISPR. (C) Comparison of the diffusivity of mNG::MEX-5(MEX-6 ZF) with mNG::MEX-5 and of mNG::MEX-6(MEX-5 ZF) with mNG::MEX-6. The diffusivity was measured at anterior and posterior sides of steady-state embryos. The statistical analysis was performed using the two-way ANOVA test, with Tukey’s multiple comparison, independently for the two chimeric strains and their controls. (D and E) Comparison of the gradient of mNG::MEX-5(MEX-6 ZF) with that of mNG::MEX-5 (D) and of mNG::MEX-6(MEX-5 ZF) gradient with the mNG::MEX-6 gradient (E), as a function of time. The statistical analysis was performed, for each stage separately, using the two-tailed unpaired t test. (F) Images showing 4-cell stage embryos expressing mNG::MEX-5, mNG::MEX-6, mNG::MEX-5(MEX-6 ZF), and mNG::MEX-6(MEX-5 ZF) protein localization. The different daughter cells (ABa, ABp, P2, and EMS) are labeled in white. In (CE), the bars represent the average values of the different measurements and the error bars the SD. The number N of analyzed embryos is reported for each condition.
Fig. 4.
Fig. 4.
PLK-1 regulates MEX-5 and MEX-6 gradients and their interaction. Comparison of the dynamics of (A) MEX-5 gradient after treatment with ctrl(RNAi) and mex-6(RNAi) in the mNG::mex-5 strain; (B) MEX-6 gradient after treatment with ctrl(RNAi) and mex-5(RNAi) in the mNG::mex-6 strain; (C) MEX-5 gradient in the mNG::mex-5(T186A) mutant compared to the parental mNG::mex-5 strain; (D) MEX-6 gradient in the mNG::mex-6(T190A) mutant compared to the parental mNG::mex-6 strain. (E) Results of the yeast two-hybrid assay with the Gal4-DBD domain bound to the sequence of wild-type MEX-5 or MEX-5(T186A) and the Gal4-AD domain bound to wild-type MEX-6 or MEX-6(T190A), in both selective and nonselective medium. The empty vector containing the Gal4-AD domain only (V) was used as negative control. In (AD), the statistical analysis was performed, for each stage separately, using the two-tailed unpaired t test. The bars represent the average values of the different measurements and the error bars the SD. The number N of analyzed embryos is reported for each condition.
Fig. 5.
Fig. 5.
The mex-5(T186A) mutation influences cortical pPAR polarity. Quantification of (A) PAR-2 domain length in embryos of the GFP::par-2, mex-6(T190A); GFP::par-2 and GFP::par-2; mex-5(T186A) strains; (B) PAR-1 domain length and (C) PAR-1 cytoplasmic gradient in embryos of the par-1::GFP, mex-6(T190A); par-1::GFP and mex-5(T186A); par-1::GFP strains. The domain length was calculated as the percentage of the total cortical length that is occupied by the domain. The quantifications were performed at stages after NEBD. (D) Plot of the different distributions of kPAR-1 that were tested to reproduce a longer PAR-1 domain toward the anterior. The upper value kPAR-1.upp was kept fixed to 0.0055 s−1, while the value of kPAR-1.low was changed as reported in the legend. (E) Comparison of the simulated MEX-5 gradients as a function of time, for the different conditions of kPAR-1,low shown in (D). (F) Steady-state concentrations of slow (shades of orange), fast (shades of violet), and total [shades of viridis as in panel (E)] MEX-5 along the embryo axis, simulated for the values of kPAR-1.low specified above the graphs. The concentrations were calculated in a central 5-µm thick slice of a 3D ellipsoidal model of the one-cell embryo by dividing the number of molecules of each MEX-5 species in each voxel over the total number of simulated particles. (G) Model of the feedback circuits involving MEX-5, MEX-6, and PLK-1. PLK-1 regulates the gradient of MEX-6 directly, while it modulates MEX-5 gradient formation through a feedback loop involving cortical polarity. The interaction between MEX-5 and MEX-6 (dashed line) was shown in ref. and in this work, but the reciprocal effect on their gradients could be indirectly regulated by PLK-1. In (A and B), the violin plots report the median (dashed line) and the quartiles (dotted lines) of the distributions. The individual dots are also displayed and the number N of analyzed embryos is reported for each condition. The statistical analysis was performed using the Kruskal–Wallis test, with Dunn’s multiple comparison. In (C), the bars represent the average values of the different measurements and the error bars the SD. The number N of analyzed embryos is reported for each condition. The statistical analysis was performed using the one-way ANOVA test, with Tukey’s multiple comparison. In (E and F), the solid curves represent the simulation results and are the average values from five different simulation runs. The shaded area represents the SD.

Similar articles

Cited by

References

    1. Brown G. C., Kholodenko B. N., Spatial gradients of cellular phospho-proteins. FEBS Lett. 457, 452–454 (1999). - PubMed
    1. Lipkow K., Odde D. J., Model for protein concentration gradients in the cytoplasm. Cell Mol. Bioeng. 1, 84–92 (2008). - PMC - PubMed
    1. Cheeks R. J., et al. , C. elegans PAR proteins function by mobilizing and stabilizing asymmetrically localized protein complexes. Curr. Biol. 14, 851–862 (2004). - PubMed
    1. Munro E., Nance J., Priess J. R., Cortical flows powered by asymmetrical contraction transport PAR proteins to establish and maintain anterior–posterior polarity in the early C. elegans embryo. Dev. Cell 7, 413–424 (2004). - PubMed
    1. Motegi F., et al. , Microtubules induce self-organization of polarized PAR domains in Caenorhabditis elegans zygotes. Nat. Cell Biol. 13, 1361–1367 (2011). - PMC - PubMed

MeSH terms

LinkOut - more resources