. 2024 Dec 24;121(52):e2409656121.
doi: 10.1073/pnas.2409656121. Epub 2024 Dec 17.

Histone methyltransferase SETDB1 safeguards mouse fetal hematopoiesis by suppressing activation of cryptic enhancers

Affiliations

Histone methyltransferase SETDB1 safeguards mouse fetal hematopoiesis by suppressing activation of cryptic enhancers

Maryam Kazerani et al. Proc Natl Acad Sci U S A. .

Abstract

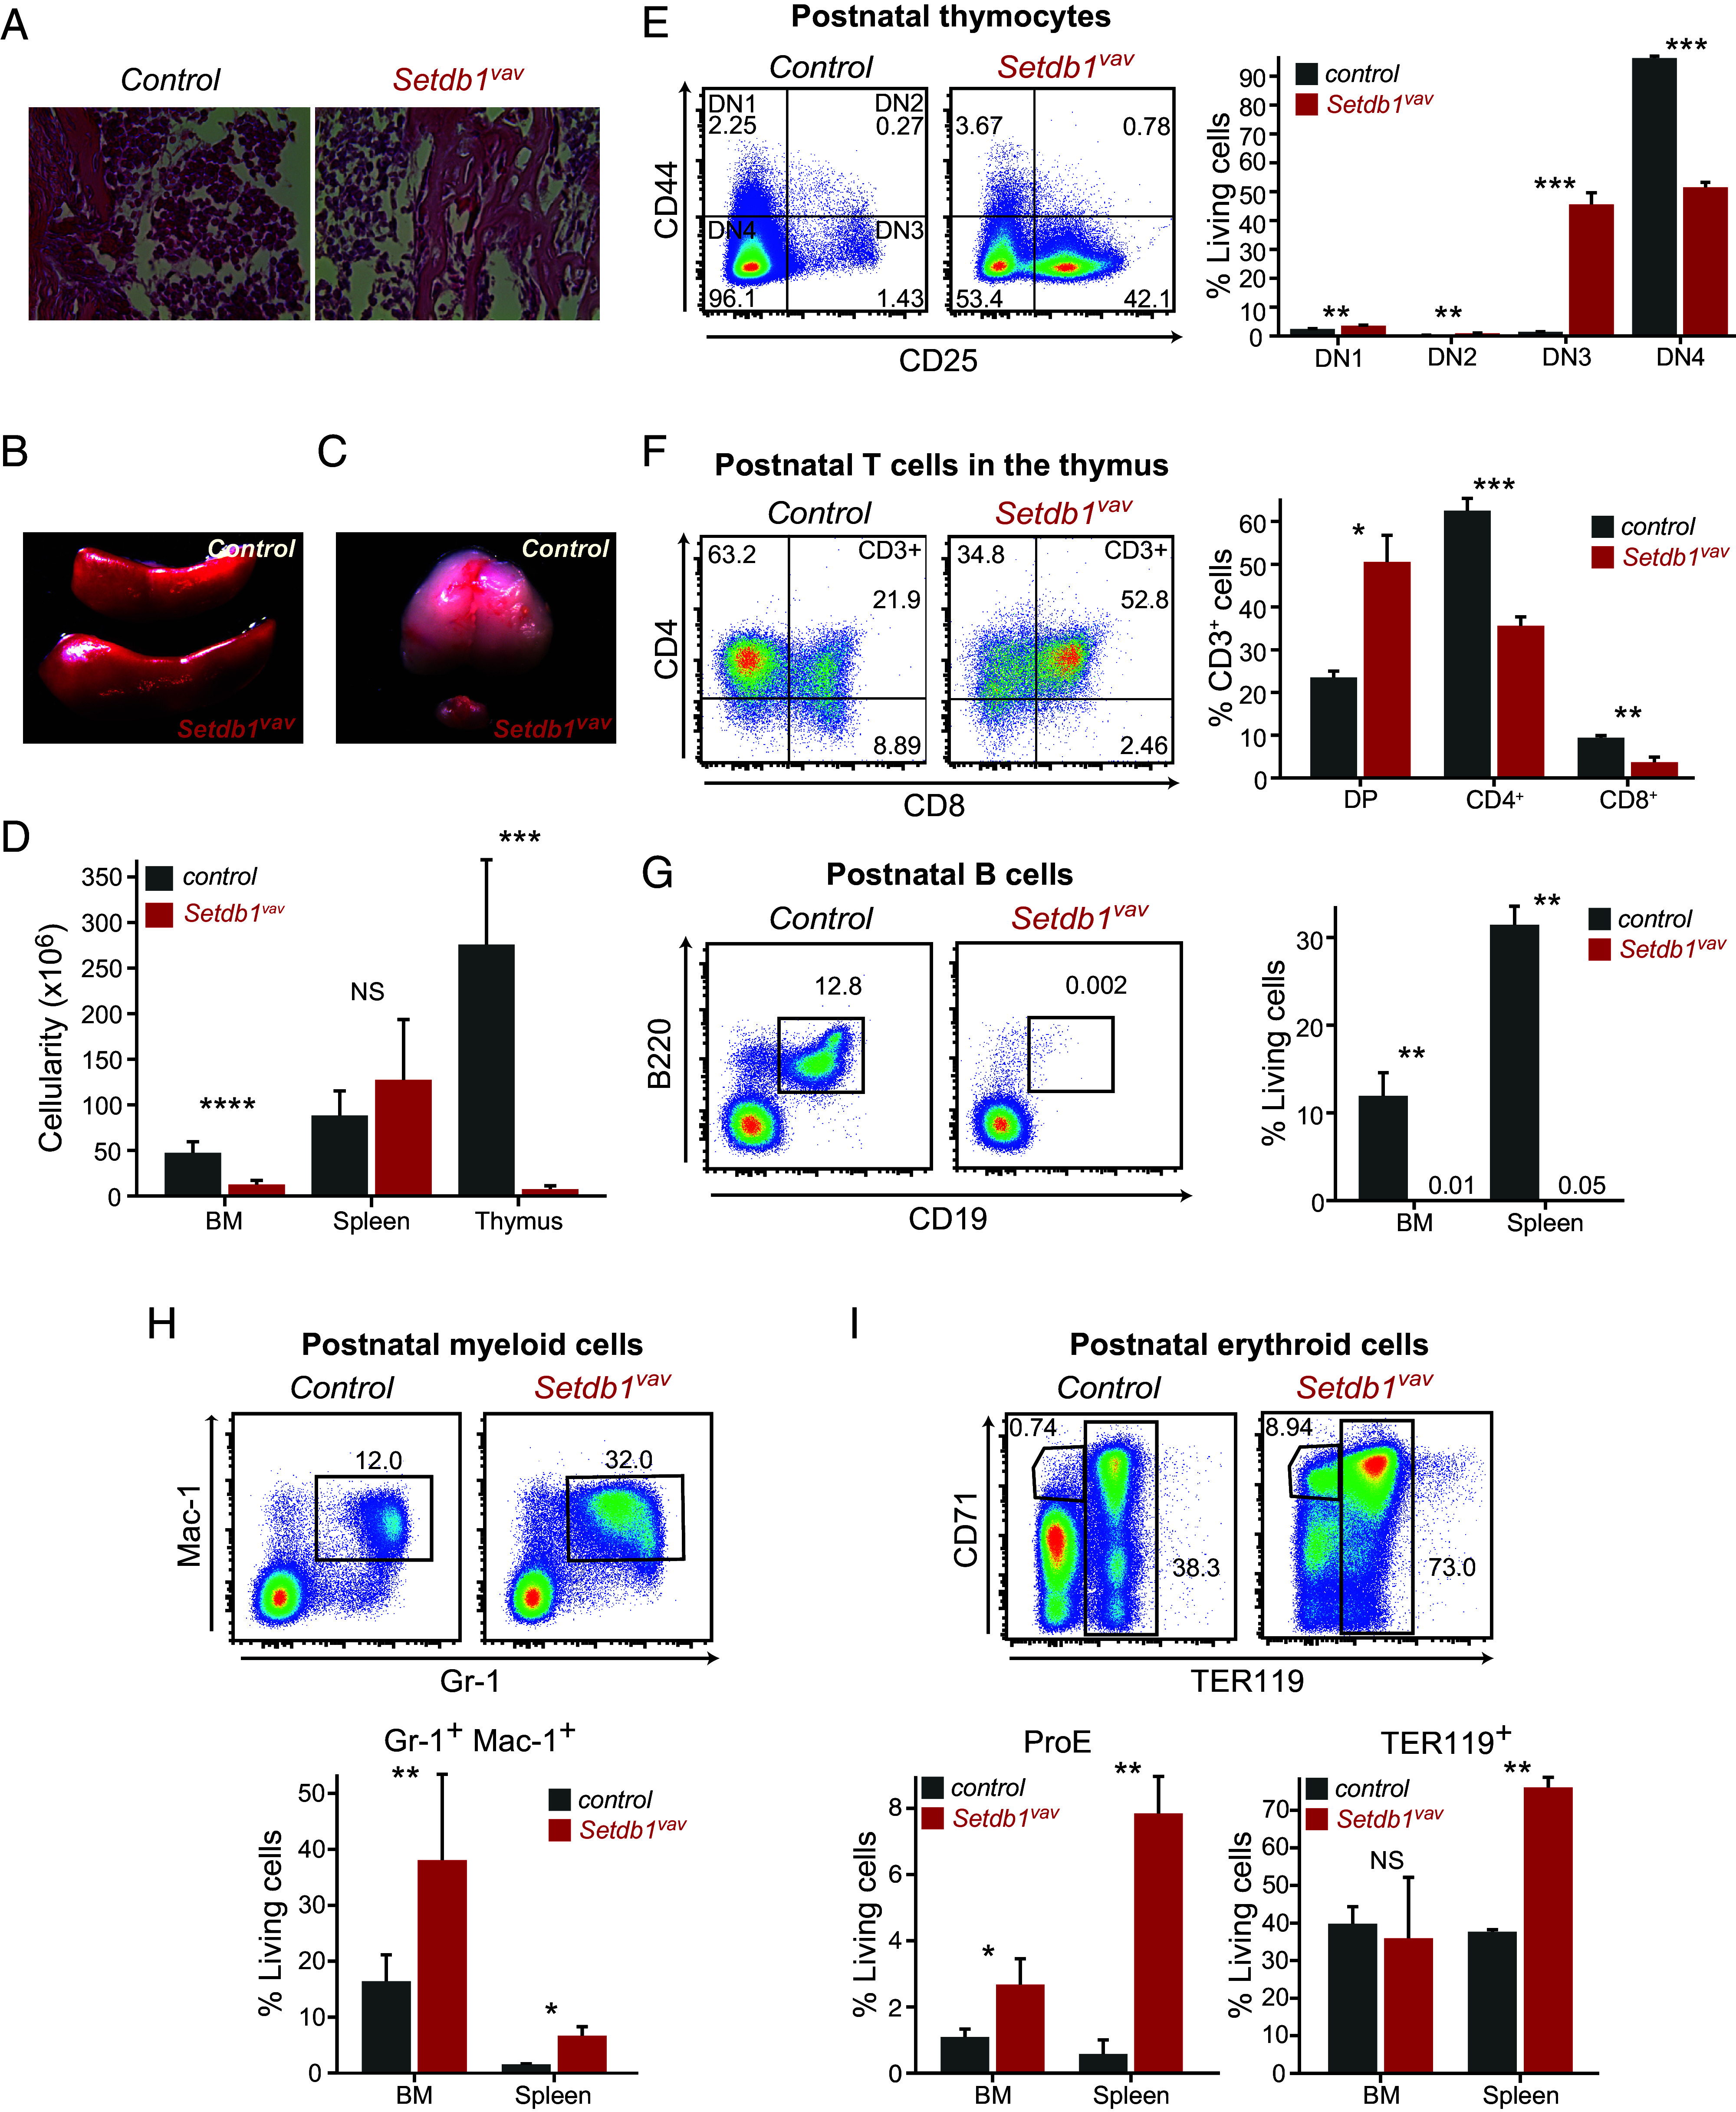
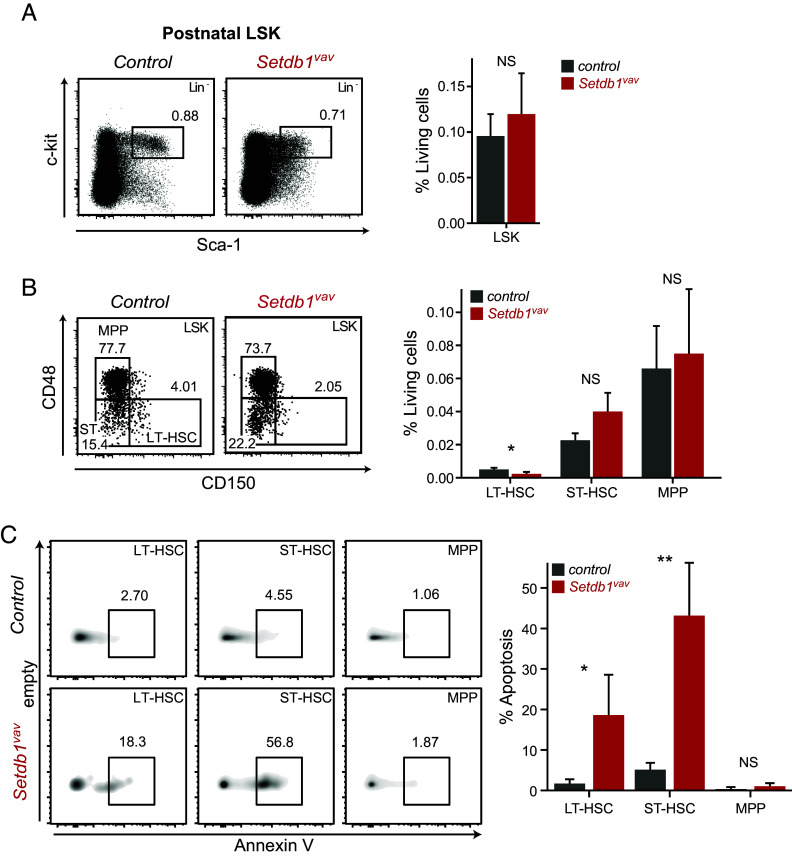
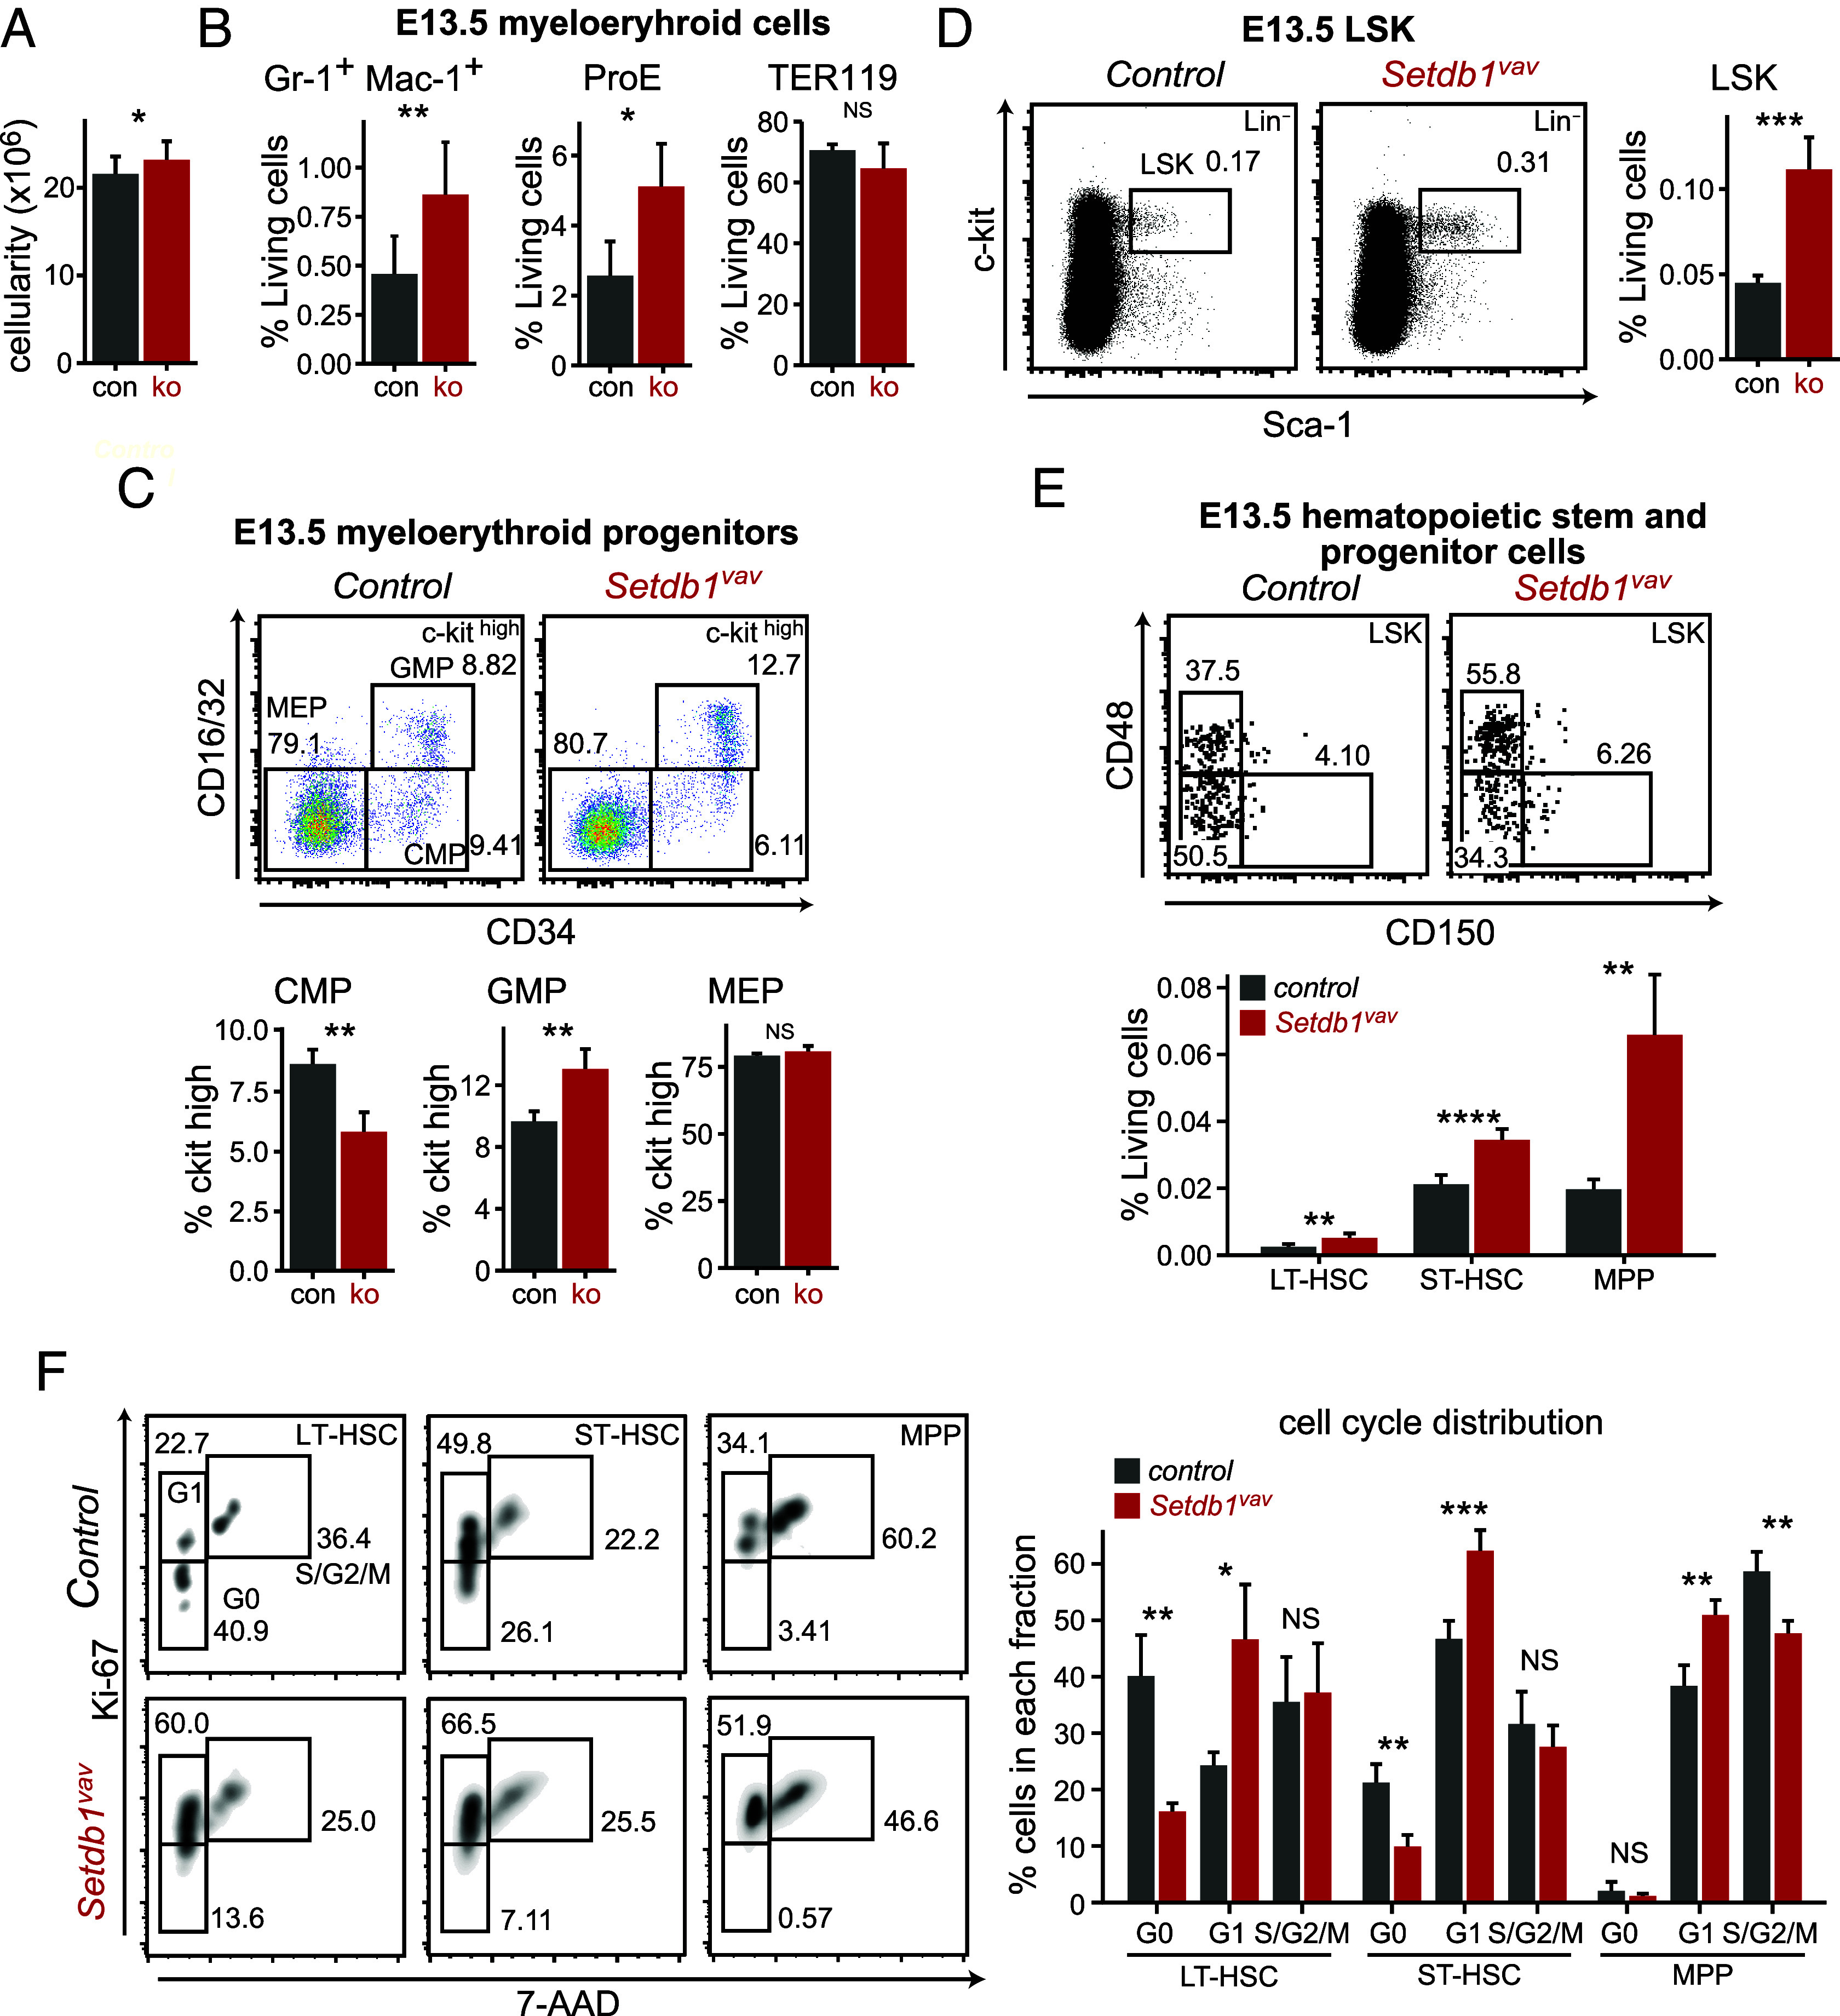
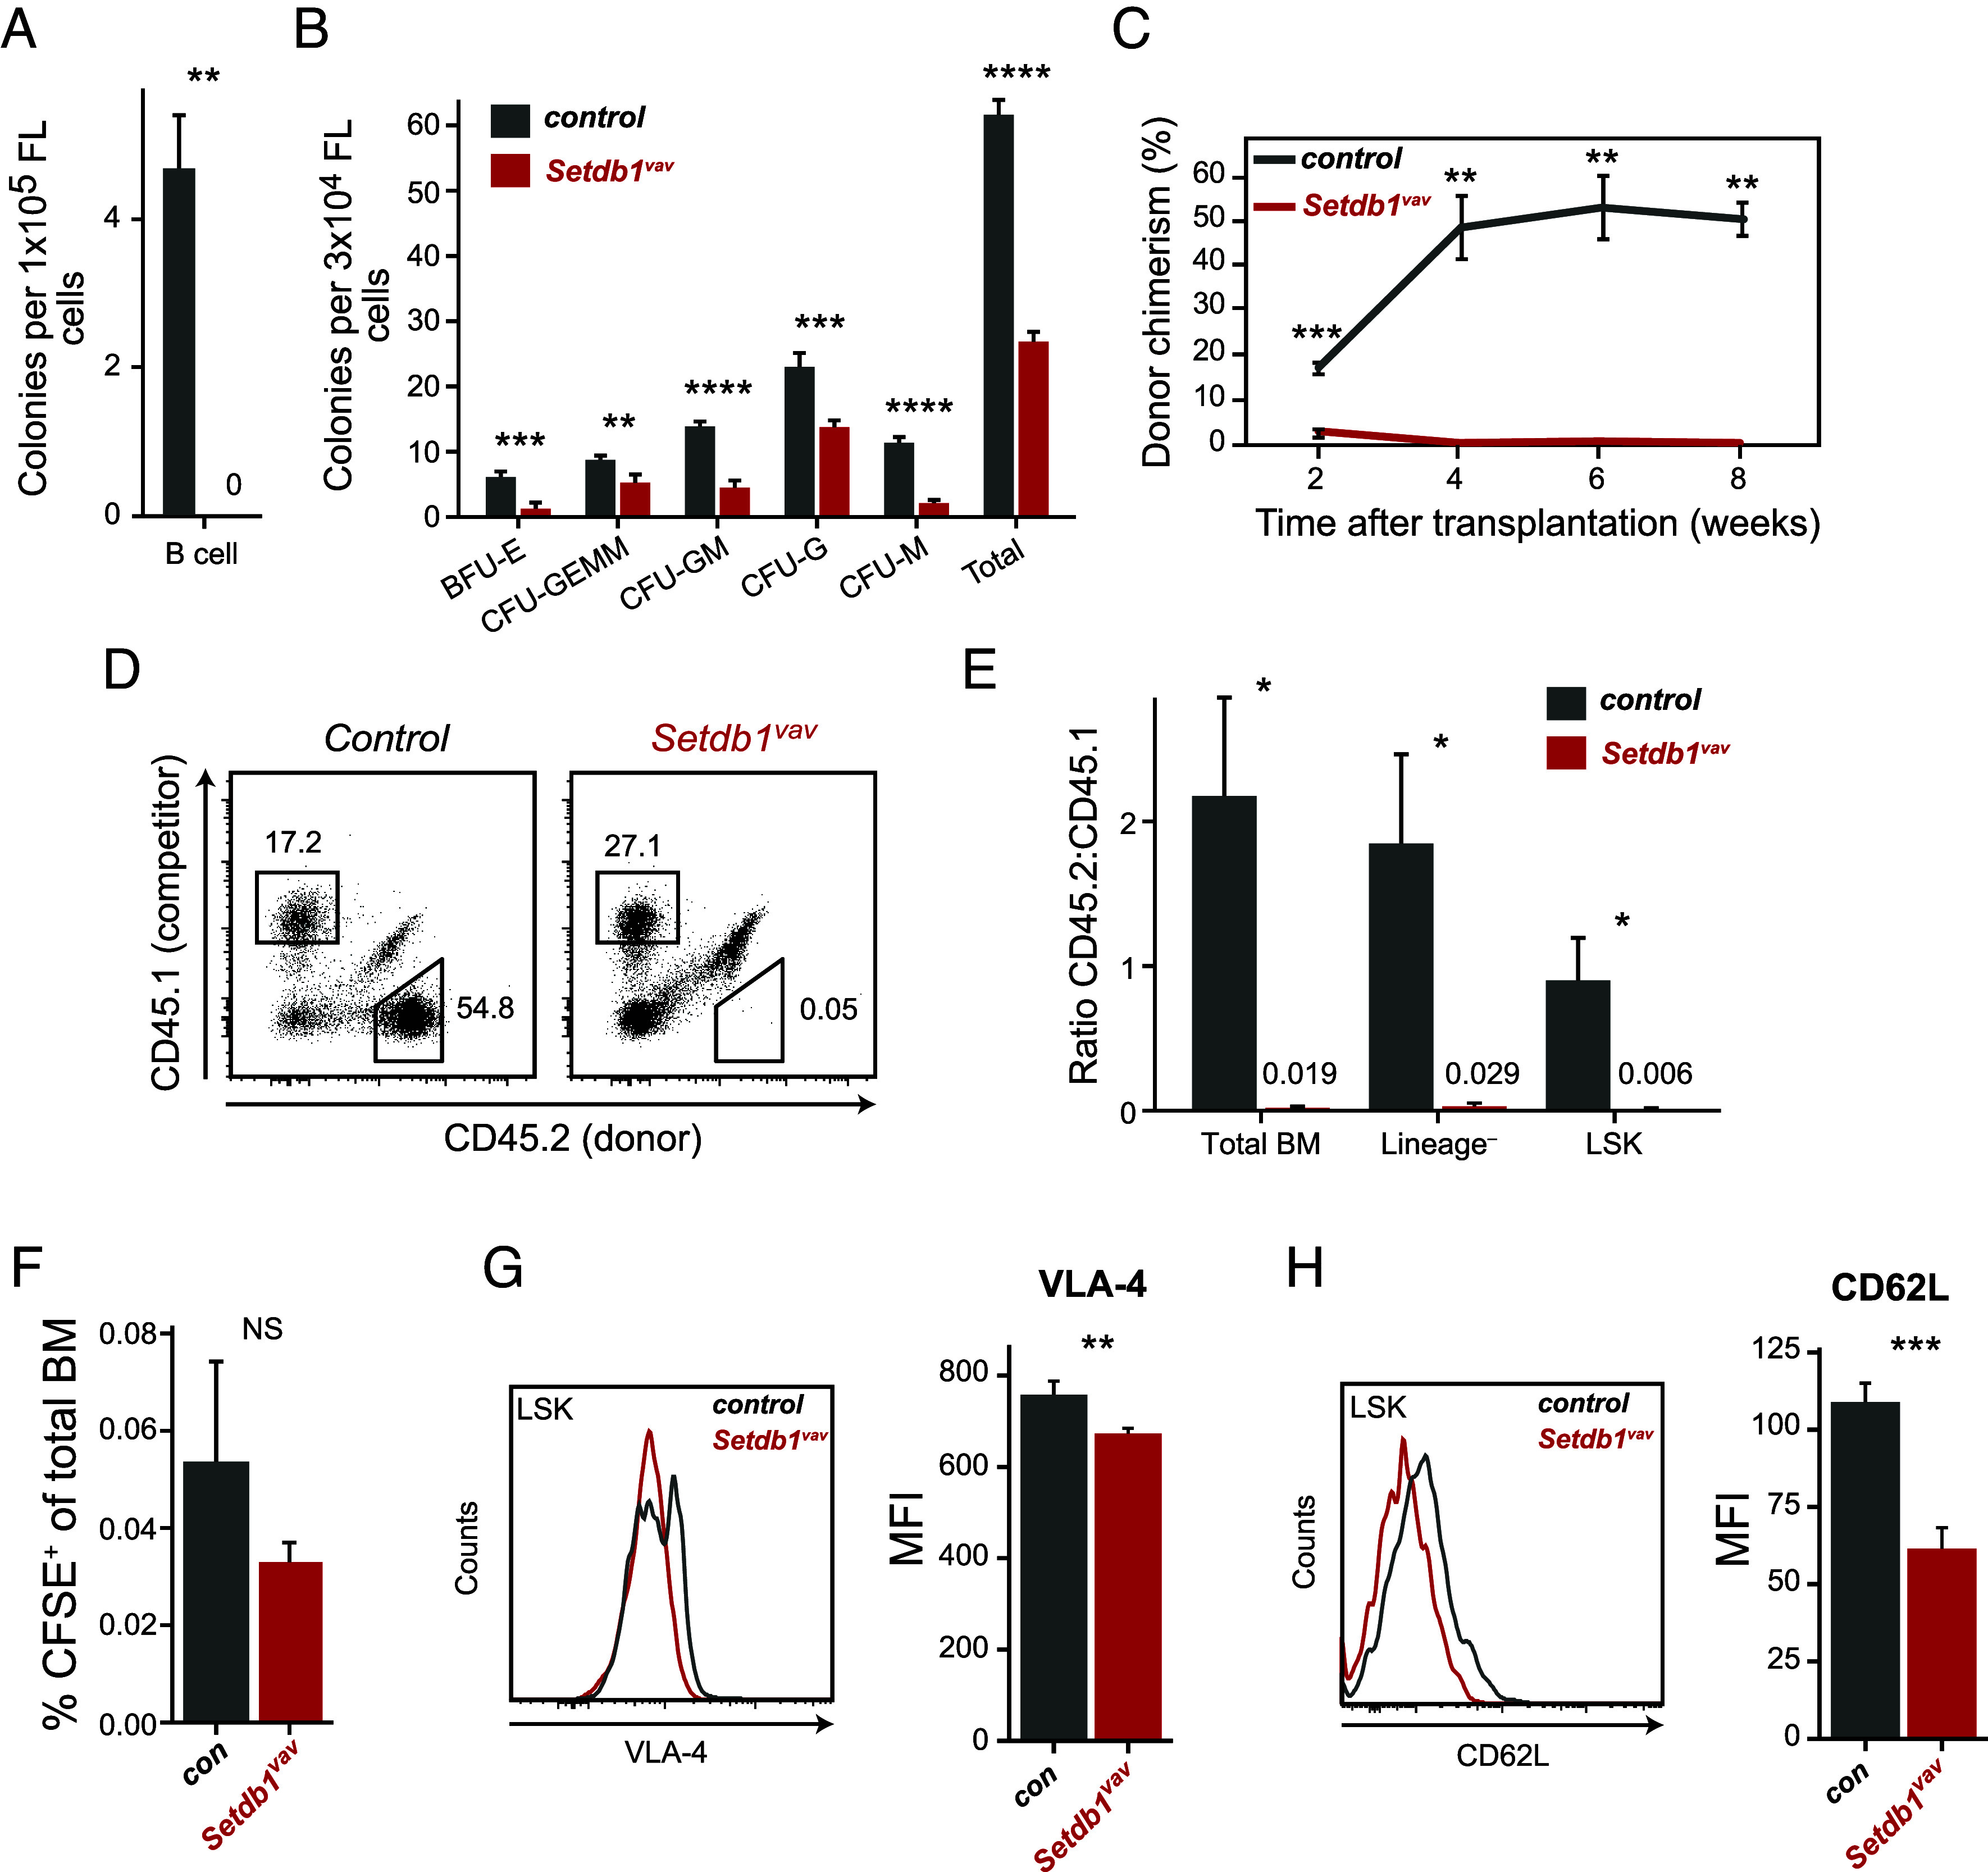
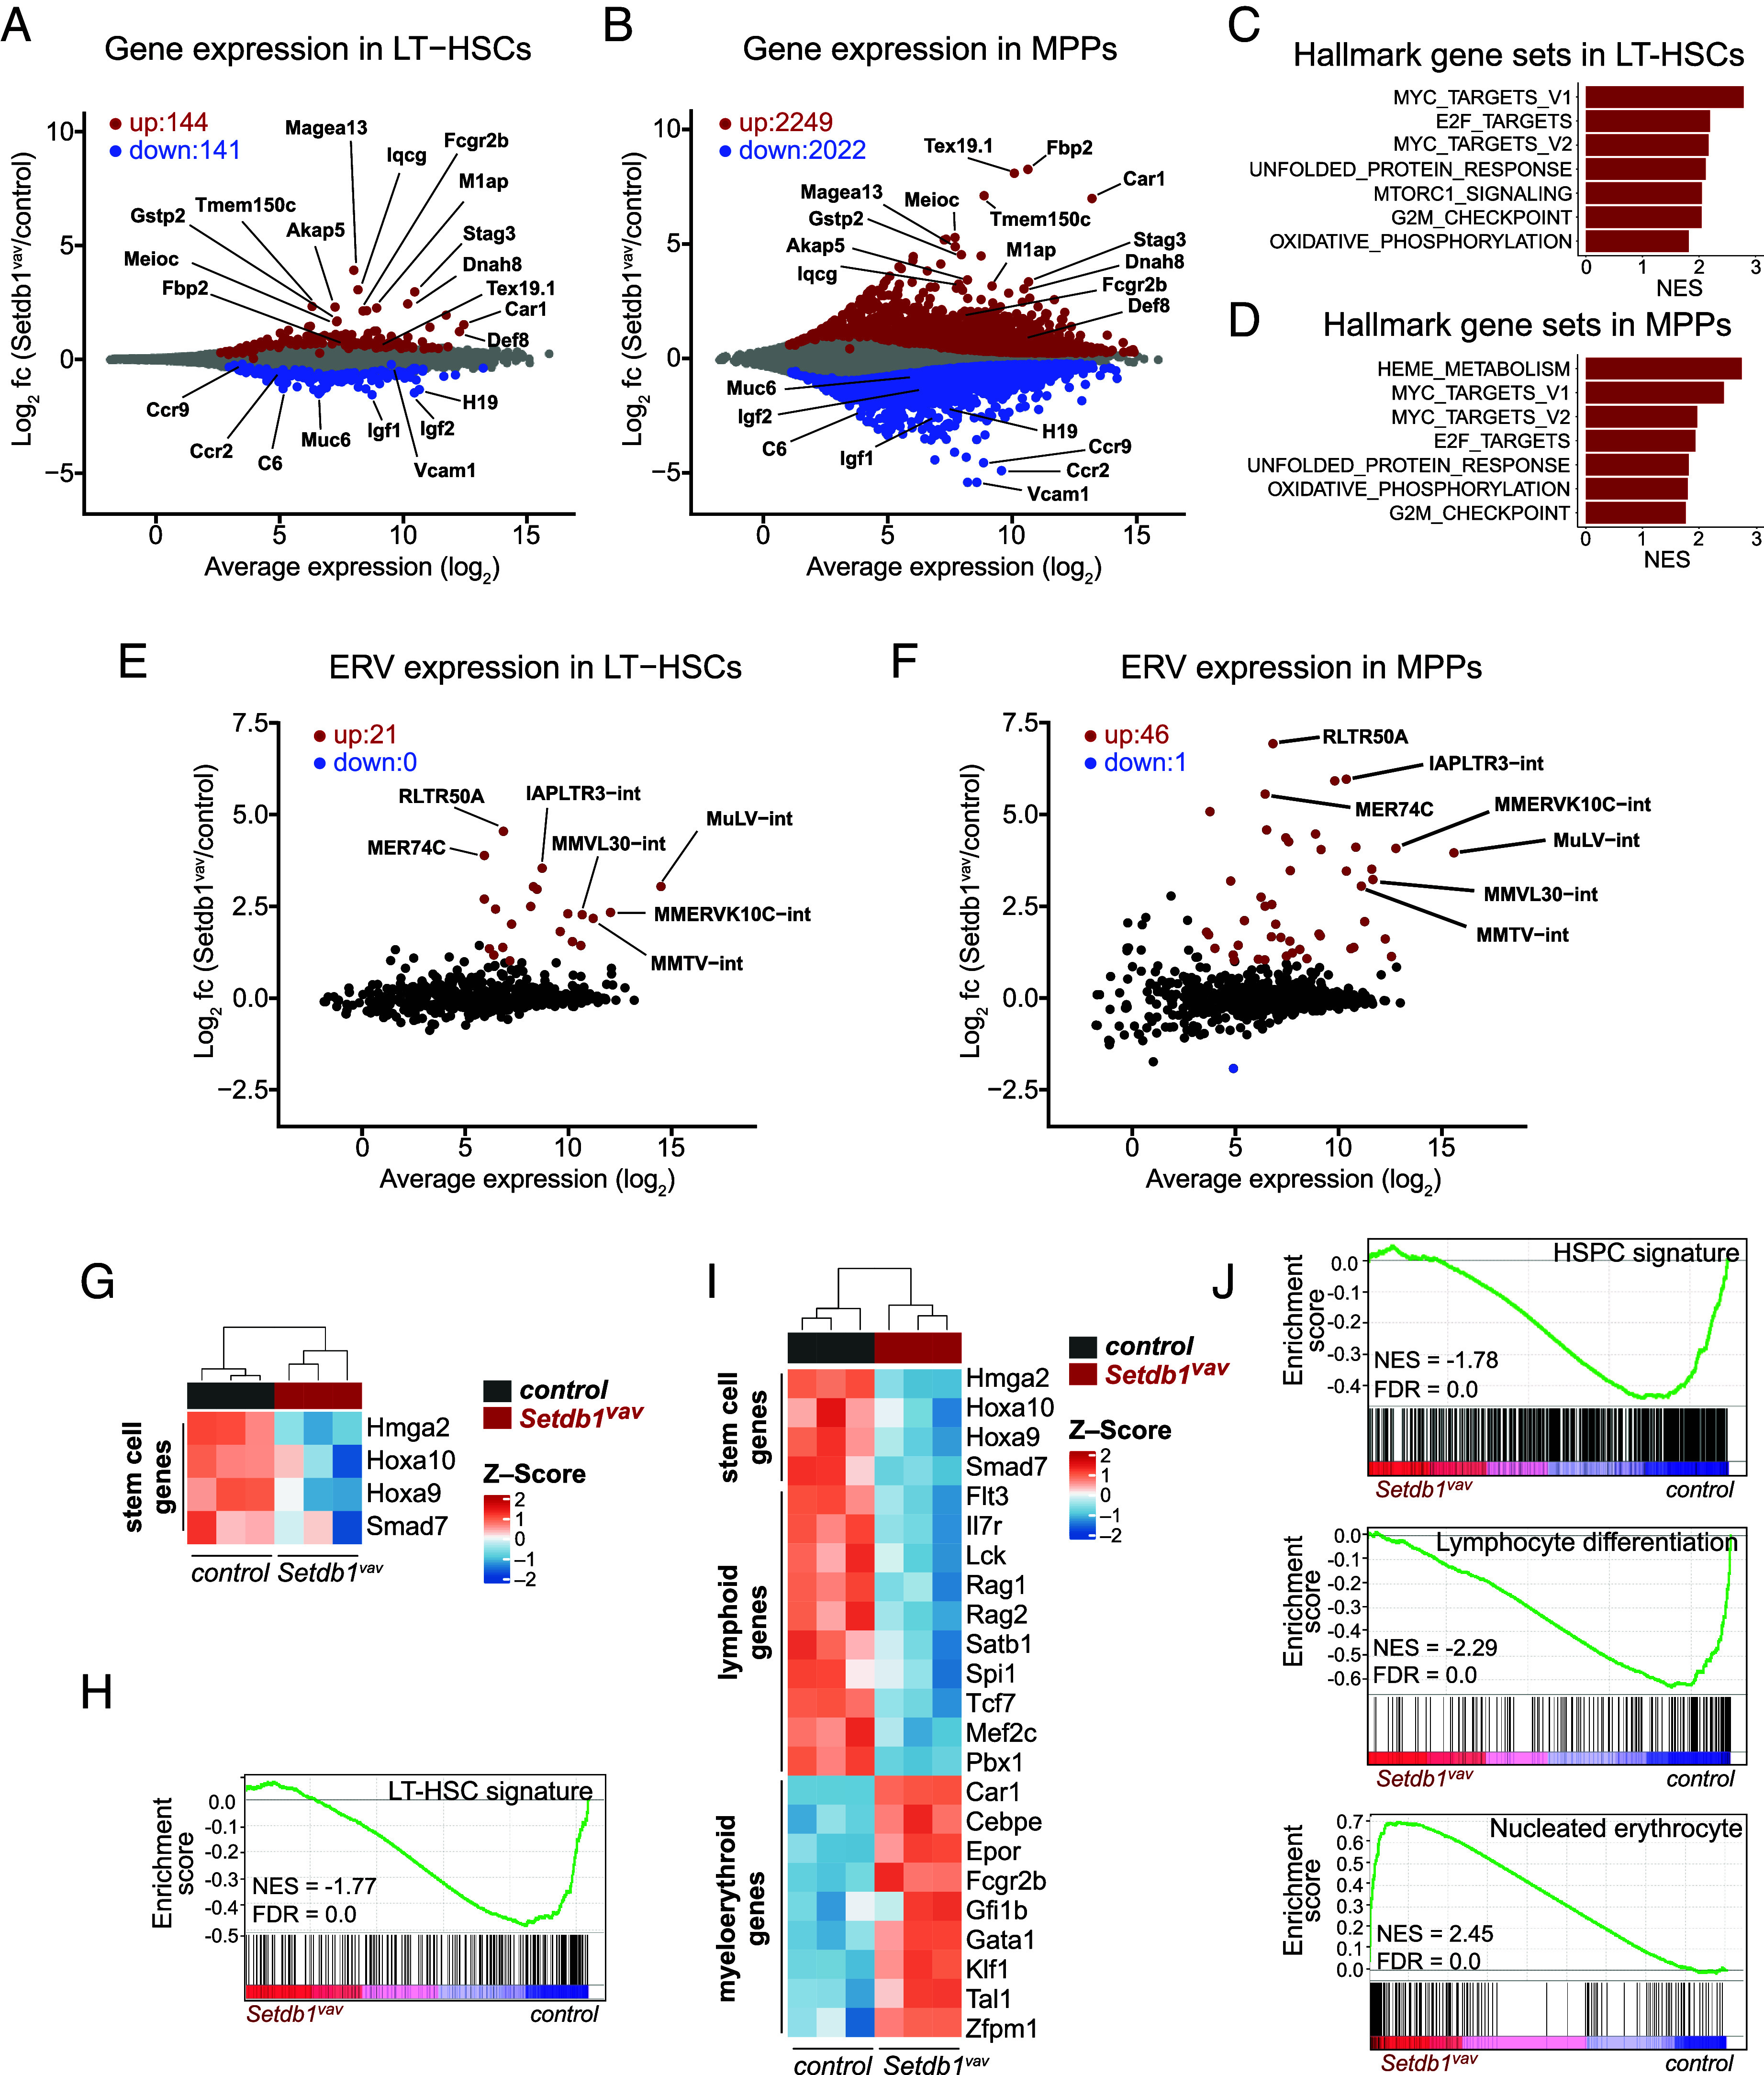
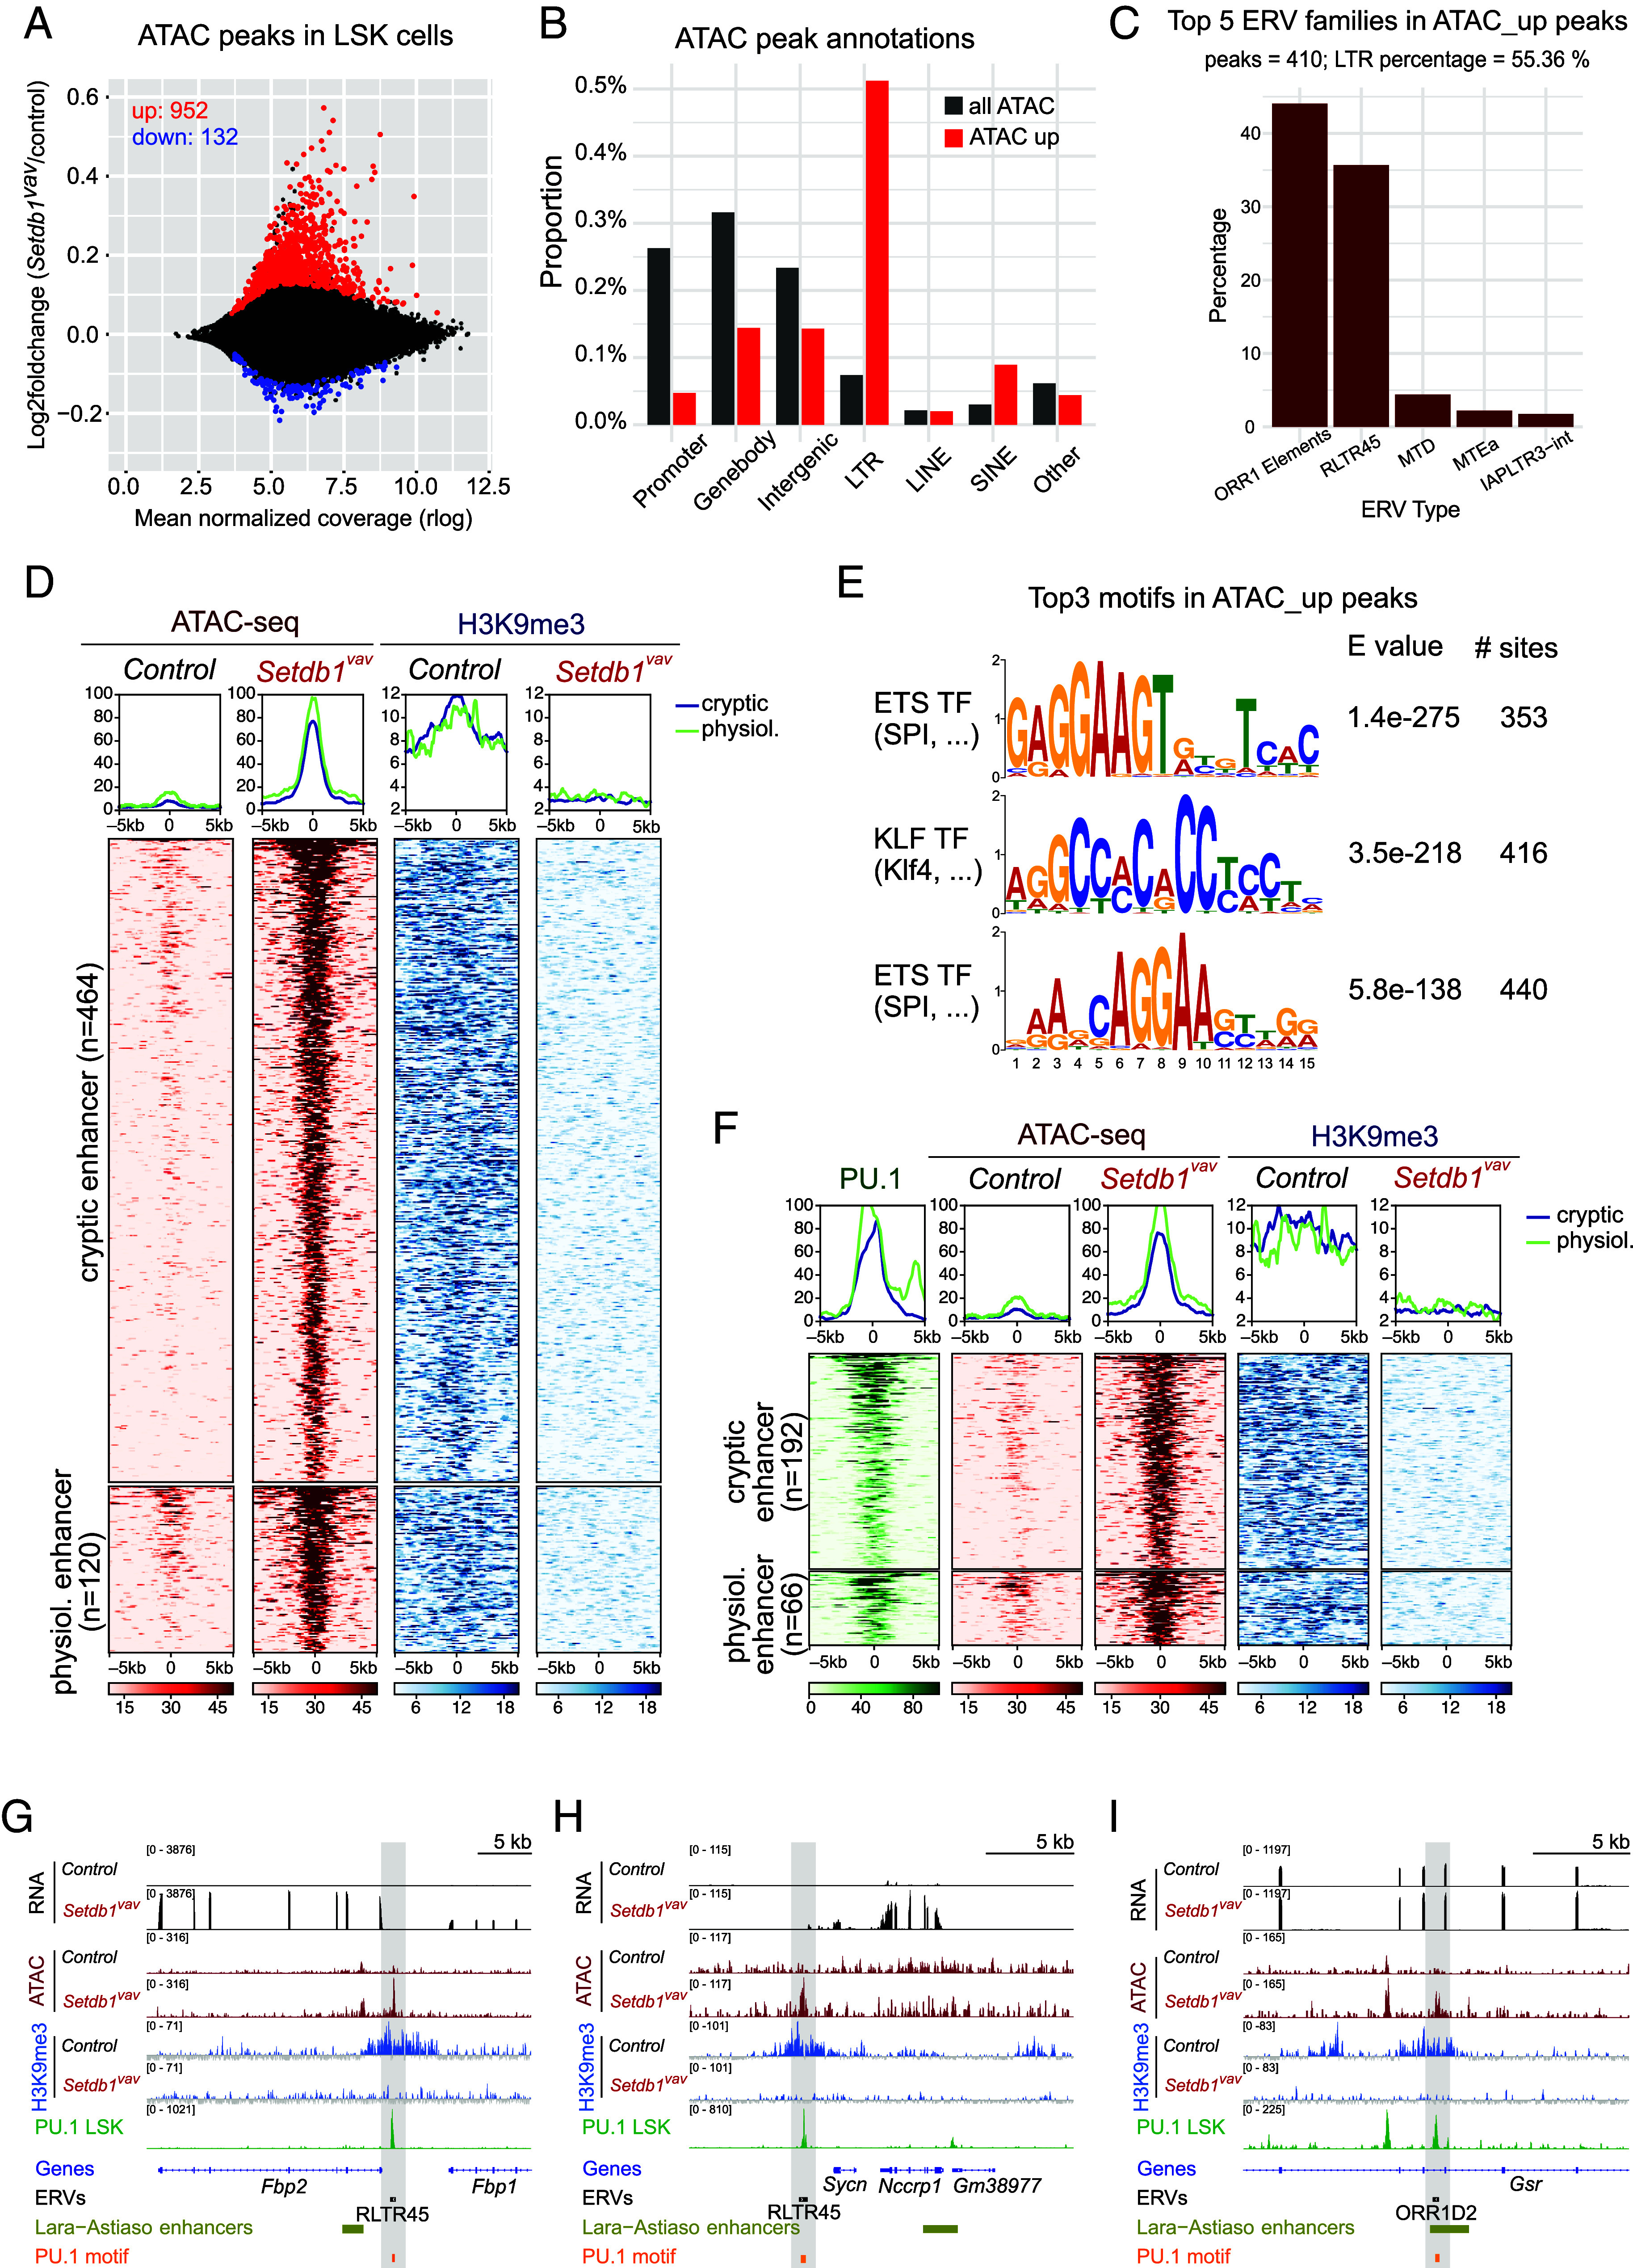
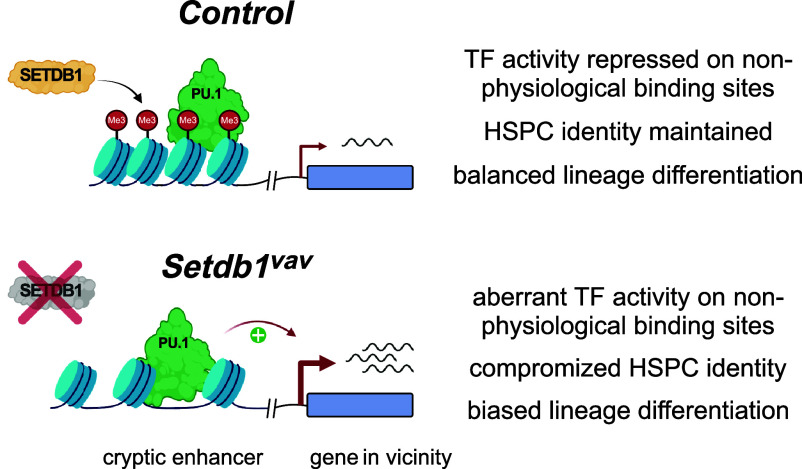
The H3K9me3-specific histone methyltransferase SETDB1 is critical for proper regulation of developmental processes, but the underlying mechanisms are only partially understood. Here, we show that deletion of Setdb1 in mouse fetal liver hematopoietic stem and progenitor cells (HSPCs) results in compromised stem cell function, enhanced myeloerythroid differentiation, and impaired lymphoid development. Notably, Setdb1-deficient HSPCs exhibit reduced quiescence and increased proliferation, accompanied by the acquisition of a lineage-biased transcriptional program. In Setdb1-deficient HSPCs, we identify genomic regions that are characterized by loss of H3K9me3 and increased chromatin accessibility, suggesting enhanced transcription factor (TF) activity. Interestingly, hematopoietic TFs like PU.1 bind these cryptic enhancers in wild-type HSPCs, despite the H3K9me3 status. Thus, our data indicate that SETDB1 restricts activation of nonphysiological TF binding sites which helps to ensure proper maintenance and differentiation of fetal liver HSPCs.

Keywords: ERV; H3K9me3; epigenetics; hematopoietic stem cells; heterochromatin.


Conflict of interest statement

Competing interests statement:The authors declare no competing interest.

Figures

Fig. 1.
Fig. 1.
Setdb1 loss leads to postnatal lethality and impaired hematopoietic lineage differentiation. (A) H&E staining of decalcified bone marrow sections from 2-wk-old control and Setdb1vav mice. (B) Spleen, and (C) thymus of 2-wk-old control and Setdb1vav mice. (D) Total cell number of bone marrow (n = 12), spleen (n = 9), and thymus (n = 9) from 2-wk-old control and Setdb1vav mice. (E) Representative FACS plots and bar graphs showing percentages of T cell progenitors (DN1-4) and (F) DP, CD4+, and CD8+ thymocytes in the thymus of control and Setdb1vav mice (n = 3). (G) Representative FACS plots and bar graphs showing percentages of B cells in the bone marrow (n = 4) and spleen of control and Setdb1vav mice (n = 3). (H) Representative FACS plots and bar graphs showing percentages of Gr-1+ Mac-1+ and (I) ProE and TER119+ cells in the bone marrow (n = 8) and spleen (n = 3) of control and Setdb1vav mice. Data are shown as mean ± SD. *P < 0.05, **P < 0.01, ***P < 0.001, and ****P < 0.0001 (unpaired two-tailed Student’s t test); DN, double negative; DP, double positive; NS, not significant.
Fig. 2.
Fig. 2.
Depletion of LT-HSCs and enhanced apoptosis in the BM of Setdb1vav mice. (A) Representative FACS plots and bar graphs showing percentages of LSK cells and (B) LT-HSCs, ST-HSCs, and MPPs in the bone marrow of control and Setdb1vav 2-wk-old mice (n = 4). (C) Representative FACS plots and bar graphs showing percentages of apoptotic cells (Annexin V+) in LT-HSCs, ST-HSCs, and MPPs in 2-wk-old control and Setdb1vav mice (n = 4). Data are shown as mean ± SD. *P < 0.05 and **P < 0.01 (unpaired two-tailed Student’s t test); NS, not significant.
Fig. 3.
Fig. 3.
Expansion of myeloerythroid cells and HSPCs in the fetal liver of Setdb1vav. (A) Bar plot showing total cell numbers for control and Setdb1vav E13.5 fetal livers (n = 10). (B) Bar plots showing frequencies of Gr-1+ Mac-1+, ProE, and TER119+ erythroblasts in control and Setdb1vav E13.5 fetal livers (n = 4). (C) Representative FACS plots and bar graphs showing percentages of CMP, GMP, and MEP populations in control and Setdb1vav E13.5 fetal livers (n = 4). (D) Representative FACS plots and bar graphs showing percentages of LSK and (E) LT-HSC, ST-HSC, and MPP populations in control and Setdb1vav E13.5 fetal livers (n = 4). (F) Representative FACS plots and bar graphs showing percentages of LT-HSCs, ST-HSCs, and MPPs in distinct cell cycle phases in control and Setdb1vav E13.5 fetal livers (n = 4). Data are shown as mean ± SD. *P < 0.05, **P < 0.01, ***P < 0.001, and ****P < 0.0001 (unpaired two-tailed Student’s t test); NS, not significant.
Fig. 4.
Fig. 4.
Compromised function of Setdb1vav FL HSPCs. (A) Bar plots showing numbers of B cell and (B) myeloerythroid colonies from control and Setdb1vav FLs in methylcellulose colony-forming assays performed in MethoCult M3630 and MethoCult M3434, respectively (n = 4). (C) Percentages of CD45.2+ donor cells in the peripheral blood of recipient mice at different time points after transplantation (n = 3). (D) Representative FACS plots showing the contribution of CD45.1+ (competitor) and CD45.2+ (donor) cells in the bone marrow of recipient mice, 8 wk after transplantation. (E) Bar plots showing the ratio between control or Setdb1vav and competitor cell frequencies in total BM, lineage, and LSK cells in the bone marrow of recipient mice, 8 wk after transplantation (n = 3). (F) Frequencies of control and Setdb1vav CFSE+ cells in the BM of lethally irradiated recipient mice 16 h after injection (n = 3). (G) Histogram indicating the expression of VLA-4 homing marker and the comparison of the mean fluorescence intensity (MFI) of VLA-4 expression on control and Setdb1vav fetal liver LSKs (n = 4). (H) Histogram indicating the expression of CD62L homing marker and the comparison of the MFI of CD62L expression on control and Setdb1vav FL LSKs (n = 4). Data are shown as mean ± SD. *P < 0.05, **P < 0.01, ***P < 0.001, and ****P < 0.0001 (unpaired two-tailed Student’s t test); NS, not significant.
Fig. 5.
Fig. 5.
Loss of transcriptional identity and deregulated lineage-specific genes in Setdb1vav FL HSPCs. (A) Average expression of protein-coding genes versus log2 fold change in control compared to Setdb1vav LT-HSCs. Significantly up- (red) and down-regulated (blue) genes are highlighted (Padj < 0.05, n = 3 for each group). (B) Average expression of protein-coding genes versus log2 fold change in control compared to Setdb1vav MPPs (Padj < 0.05, n = 3 for each group). (C) Gene set enrichment analysis (GSEA) of RNA-seq data for hallmark gene sets enriched in Setdb1vav LT-HSCs and (D) MPPs. (E) Scatter plot showing average expression versus log2 fold change of ERV families in control vs. Setdb1vav LT-HSCs, and (F) MPPs. Highlighted are significantly up- (red) and down-regulated (blue) ERVs (Padj < 0.01, log2 fold change > 1, n = 3 for each group). (G) Heatmap showing the expression of selected hematopoietic stem cell-related genes in control and Setdb1vav FL LT-HSCs (Padj < 0.05). (H) GSEA using LT-HSC gene signature (21) on RNA-seq data from control and Setdb1vav FL LT-HSCs. (I) Heatmap showing the expression of selected hematopoietic stem cell-, lymphoid-, and myeloerythroid-associated genes in control and Setdb1vav FL MPPs (Padj < 0.05, log2 fold change > 0.5 or < –0.5). (J) GSEA with HSPC gene signature (21), GO lymphocyte differentiation gene signature, and nucleated erythrocyte gene signature (22) for RNA-seq data from control and Setdb1vav FL MPPs. FL, fetal liver; FDR, false discovery rate; NES, normalized enrichment score.
Fig. 6.
Fig. 6.
SETDB1 loss alters chromatic landscape at ERVs-overlapping enhancers in FL HSPCs. (A) Scatter plot showing mean normalized coverage vs. log2 fold change of ATAC-seq peaks in Setdb1vav vs. control LSK cells. Significantly up (red) or down-regulated (blue) ATAC peaks (Padj < 0.05, n = 2) in Setdb1vav LSK cells are indicated. (B) Genomic features associated with Setdb1vav up-regulated ATAC peaks in LSK cells. (C) Association of Setdb1vav up-regulated ATAC peaks with ERV families. The bar plot shows the proportion of ATAC_up peaks overlapping with ERVs. (D) Heatmap and cumulative coverage plots showing ATAC and H3K9me3 coverage for H3K9me3 enriched ATAC_up peaks corresponding to cryptic and physiological enhancers. Distance from the peak center is given in bp. (E) MEME motif analysis of Setdb1vav up-regulated ATAC peaks. Top three motif logos are shown. (F) Heatmap and cumulative coverage plots of H3K9me3 enriched ATAC_up peaks overlapping with PU.1 peaks in LSK cells (32) showing PU.1 binding, ATAC-seq, and H3K9me3 ChIP-seq coverage. Distance from the peak center is given in bp. (GI) Genome browser views of selected Setdb1vav up-regulated ATAC peaks overlapping with PU.1 binding and connected with transcriptional changes of genes in the vicinity.
Fig. 7.
Fig. 7.
SETDB1 mediates repression of transcription factor activity on nonphysiological binding sites. In HSPCs, SETDB1 establishes H3K9me3 on diverse classes of retroelements, cryptic enhancers, and promoter regions of genes. A subset of SETDB1 target sites can be bound by hematopoietic transcription factors, for example, PU.1. However, SETDB1 prevents the activity of such transcription factors which is critical to maintain HSPC identity and differentiation. In Setdb1-deficient HSPCs, TF activity on aberrant binding sites is not limited, indicated by increased chromatin accessibility on their binding sites and enhanced transcription of neighboring genes. This contributes to impaired HSPC identity and biased lineage differentiation.

References

    1. Becker J. S., Nicetto D., Zaret K. S., H3K9me3-dependent heterochromatin: Barrier to cell fate changes. Trends Genet. 32, 29–41 (2016). - PMC - PubMed
    1. Matsui T., et al. , Proviral silencing in embryonic stem cells requires the histone methyltransferase ESET. Nature 464, 927–931 (2010). - PubMed
    1. Bilodeau S., Kagey M. H., Frampton G. M., Rahl P. B., Young R. A., SetDB1 contributes to repression of genes encoding developmental regulators and maintenance of ES cell state. Genes Dev. 23, 2484–2489 (2009). - PMC - PubMed
    1. Schultz D. C., Ayyanathan K., Negorev D., Maul G. G., Rauscher F. J., SETDB1: A novel KAP-1-associated histone H3, lysine 9-specific methyltransferase that contributes to HP1-mediated silencing of euchromatic genes by KRAB zinc-finger proteins. Genes. Dev. 16, 919–932 (2002). - PMC - PubMed
    1. Ecco G., Imbeault M., Trono D., KRAB zinc finger proteins. Development 144, 2719–2729 (2017). - PMC - PubMed