. 2024 Dec 17;17(867):eado6057.
doi: 10.1126/scisignal.ado6057. Epub 2024 Dec 17.

AXL-TBK1 driven AKT3 activation promotes metastasis

Affiliations

AXL-TBK1 driven AKT3 activation promotes metastasis

Emily N Arner et al. Sci Signal. .

Abstract

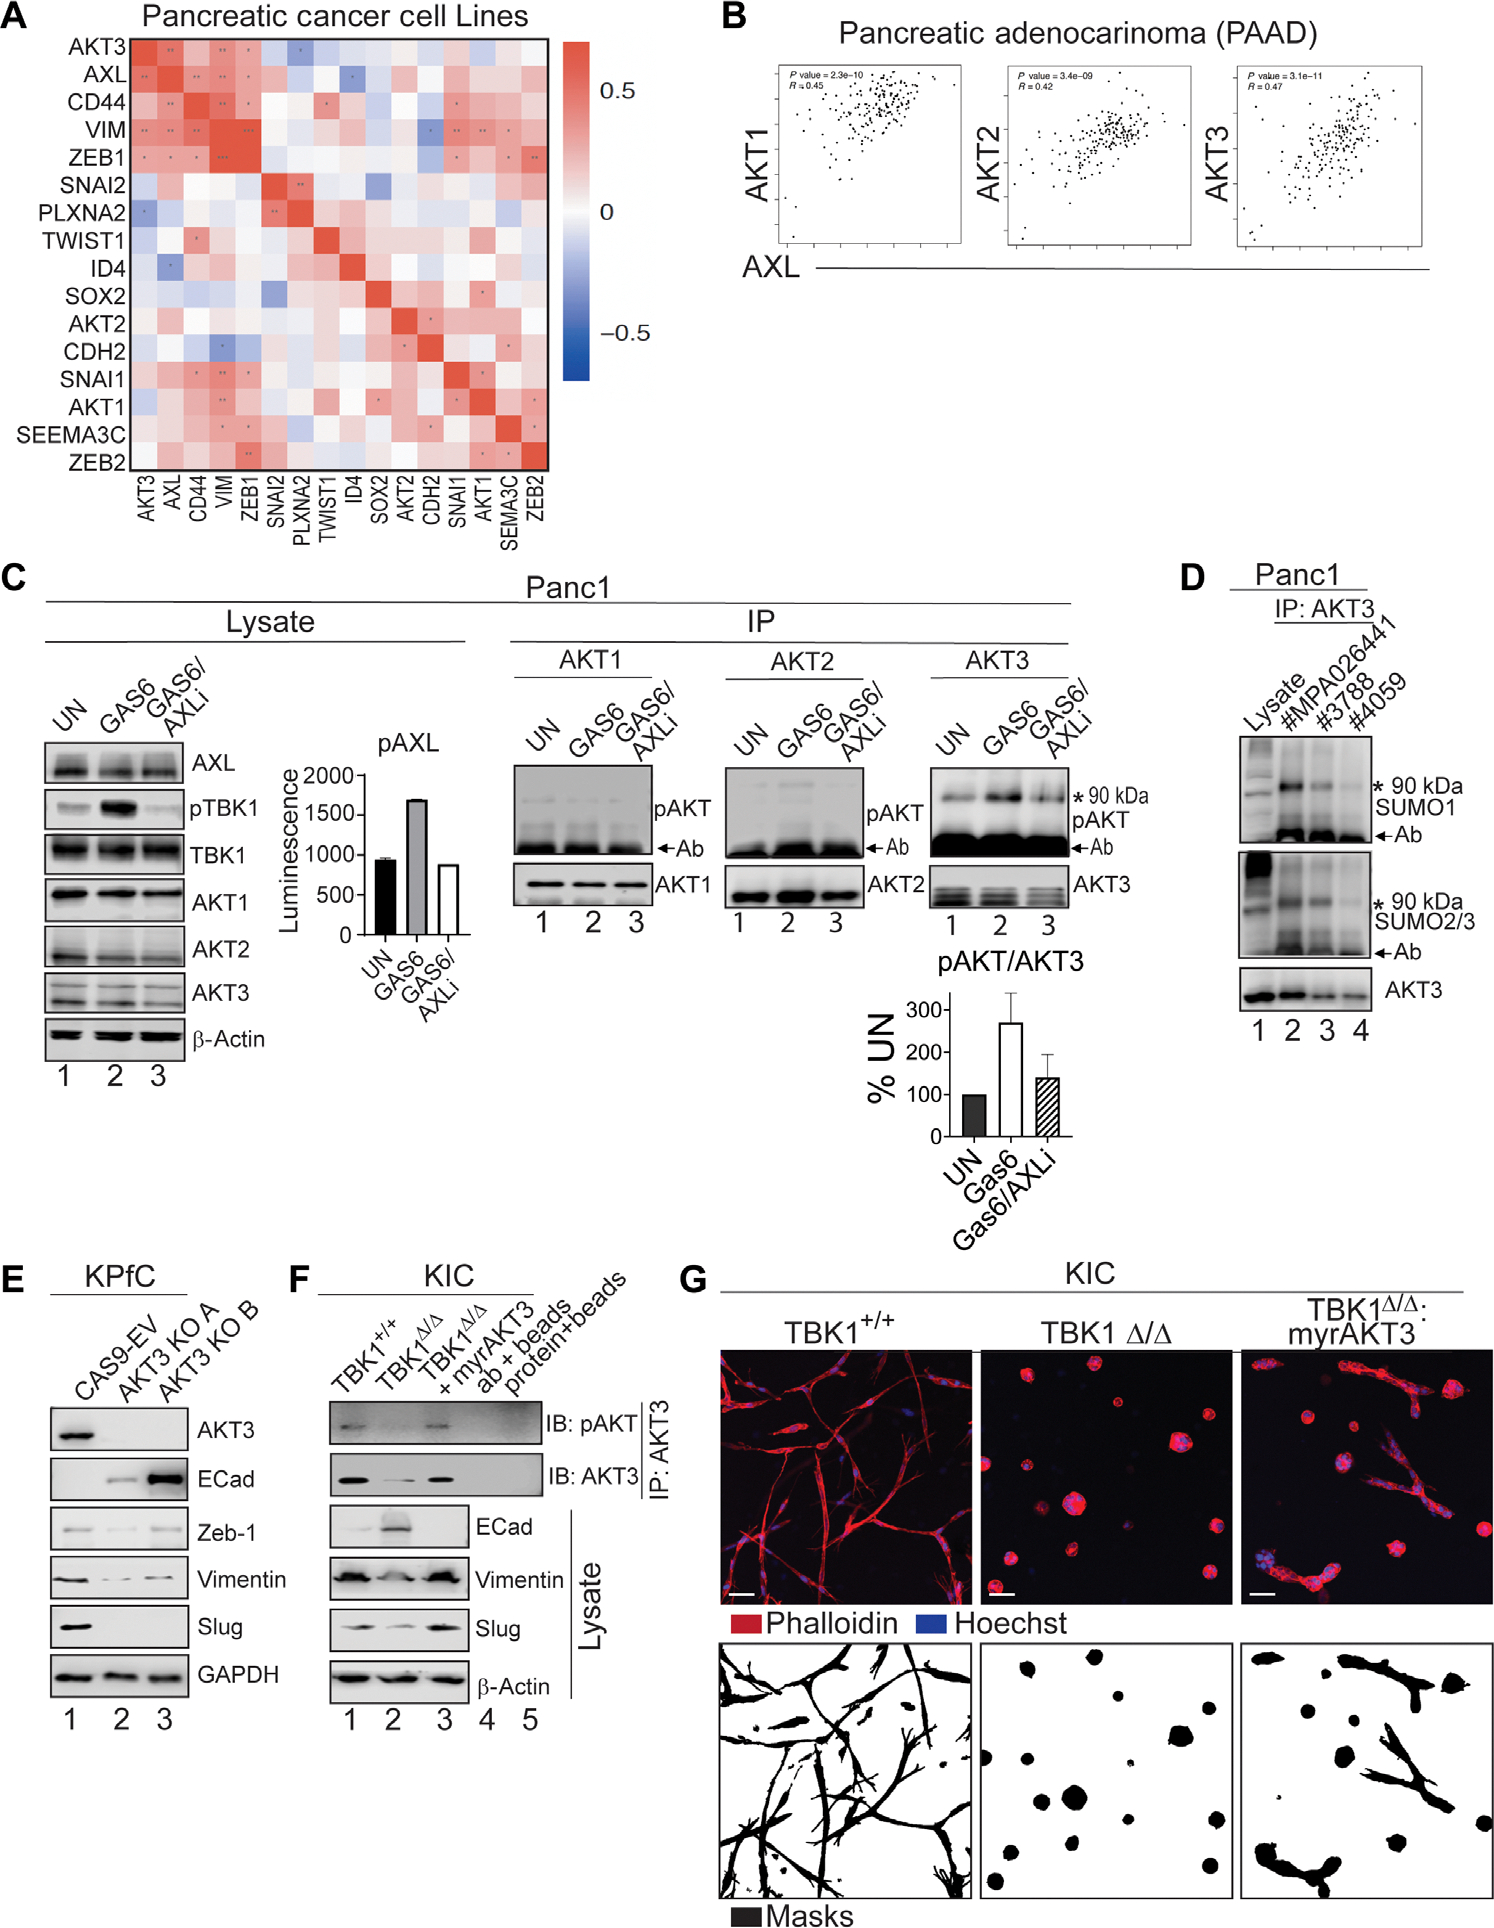
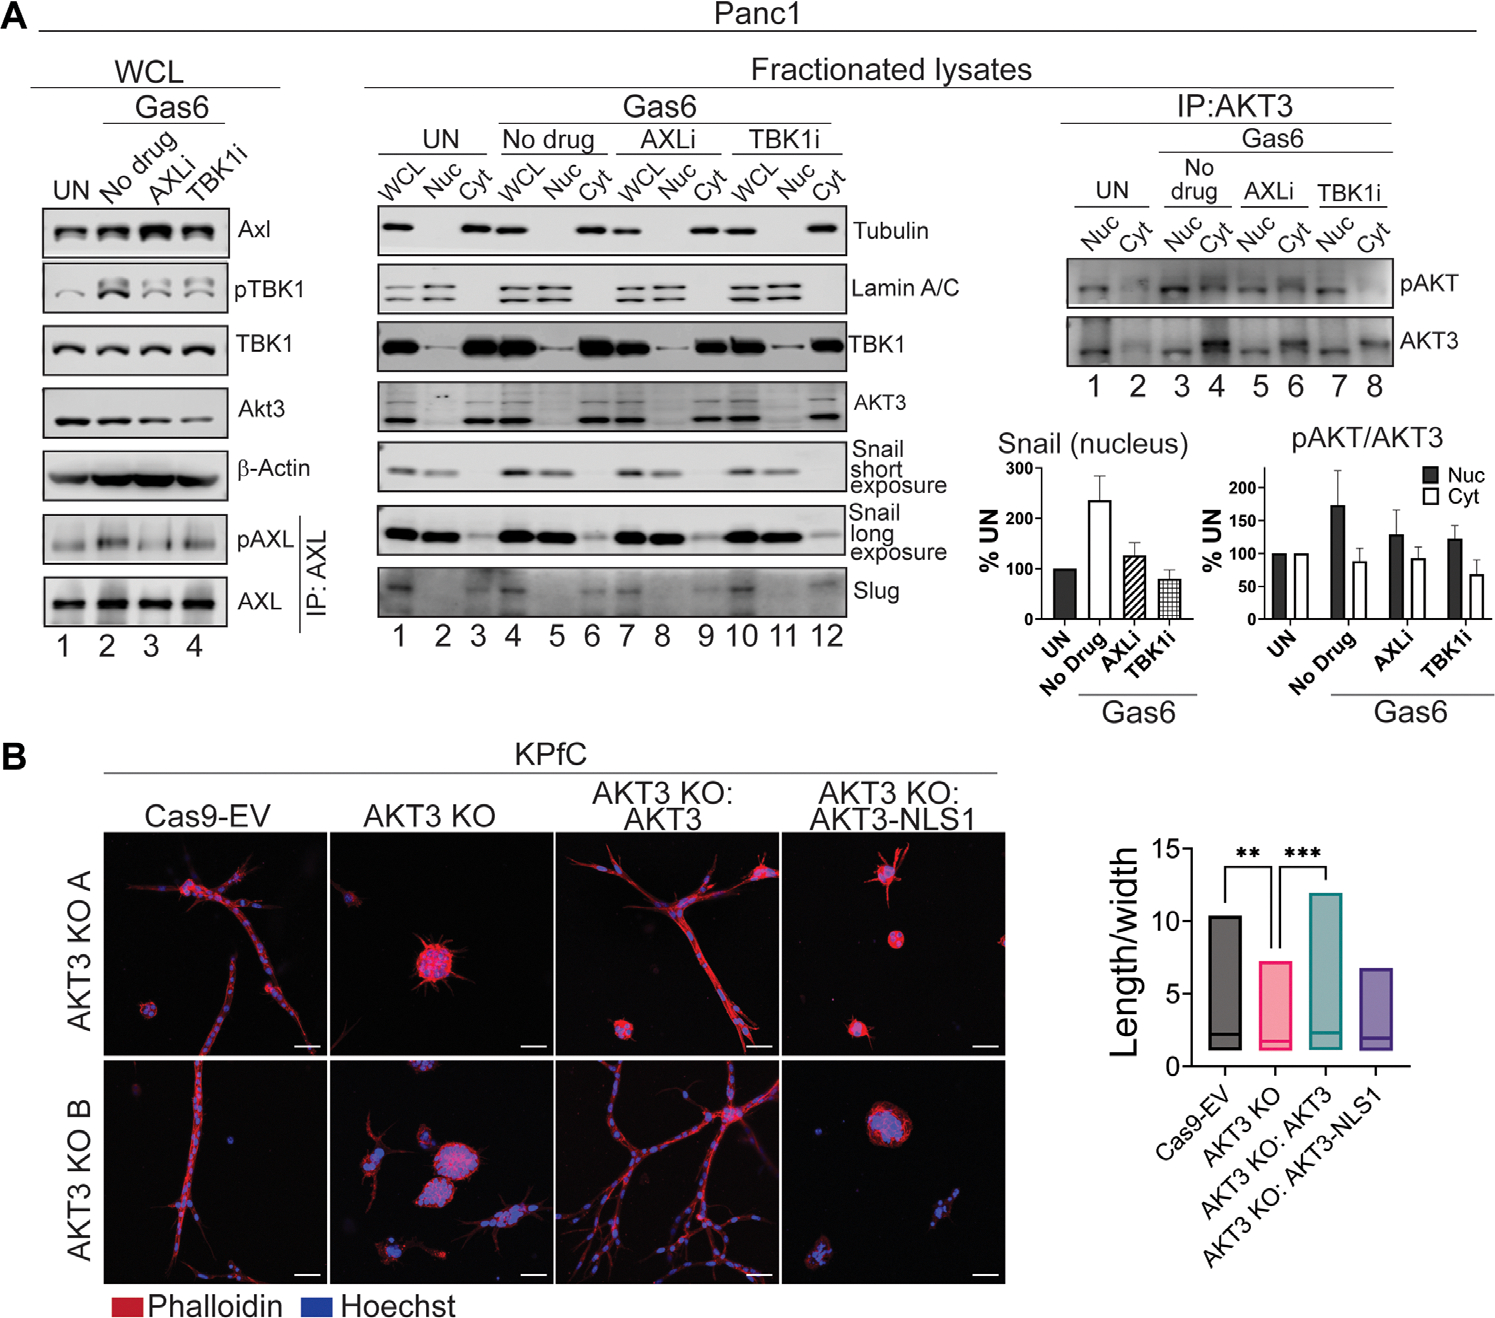
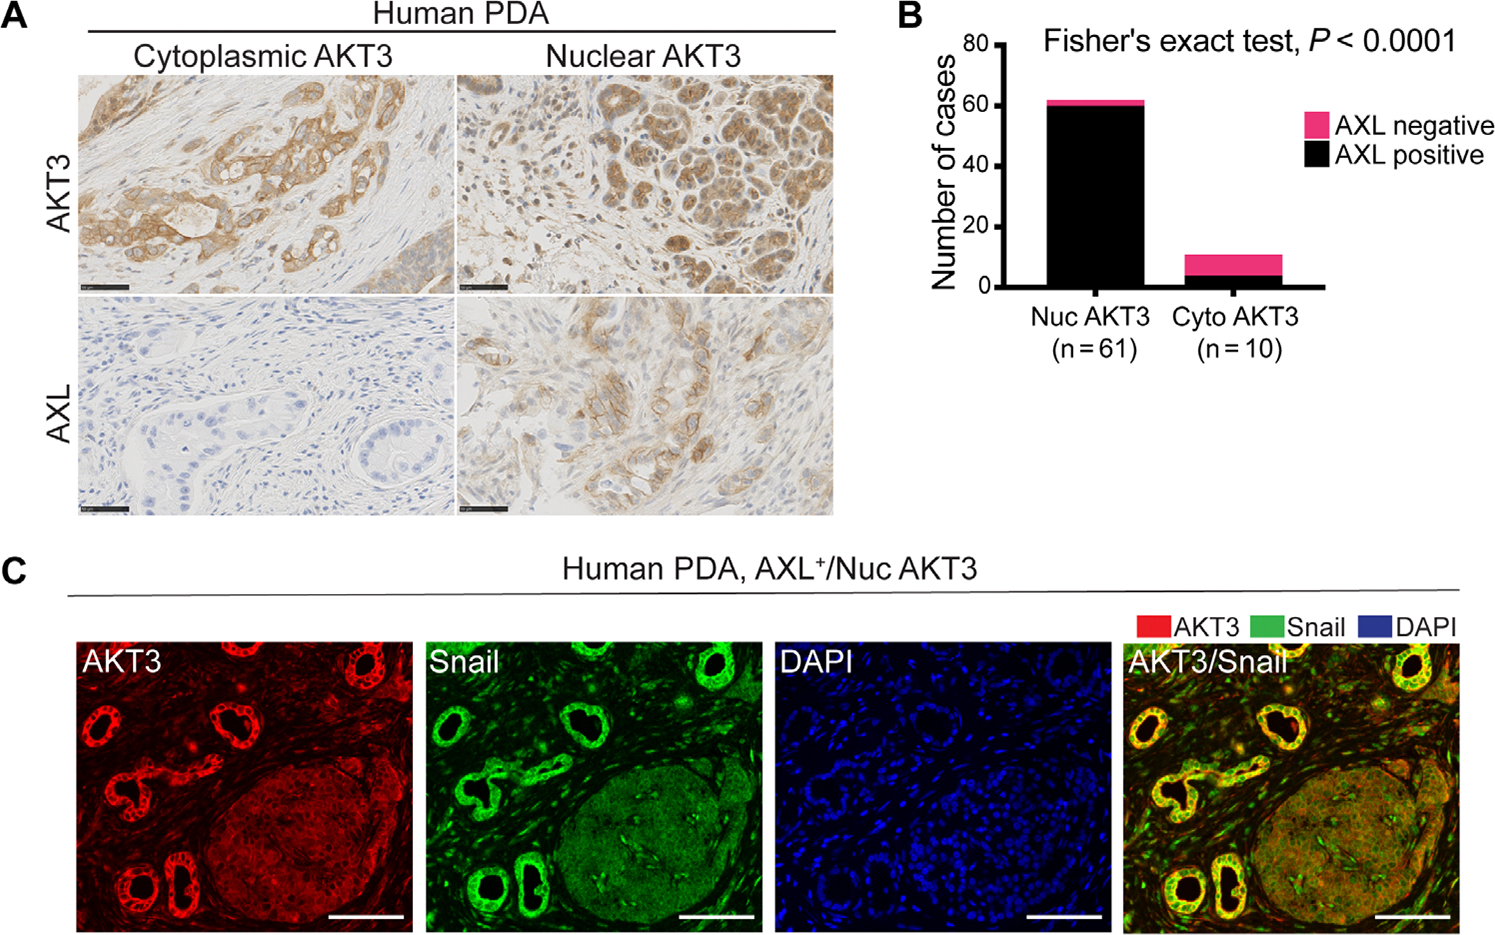
The receptor tyrosine kinase AXL promotes tumor progression, metastasis, and therapy resistance through the induction of epithelial-mesenchymal transition (EMT). Here, we found that activation of AXL resulted in the phosphorylation of TANK-binding kinase 1 (TBK1) and the downstream activation of AKT3 and Snail, a transcription factor critical for EMT. Mechanistically, we showed that TBK1 directly bound to and phosphorylated AKT3 in a manner dependent on the multiprotein complex mTORC1. Upon activation, AKT3 interacted with and promoted the nuclear accumulation of Snail, which led to increased EMT as assessed by marker abundance. In human pancreatic ductal adenocarcinoma tissue, nuclear AKT3 colocalized with Snail and correlated with worse clinical outcomes. Primary mouse pancreatic cancer cells deficient in AKT3 showed reduced metastatic spread in vivo, suggesting selective AKT3 inhibition as a potential therapeutic avenue for targeting EMT in aggressive cancers.


Conflict of interest statement

Competing interests: R.A.B. received research support from BerGenBio ASA for unrelated work; S.H., A.M., K.Y.A., G.G., D.M., M.B., and J.B.L. are or were employees of BerGenBio ASA. J.B.L. and D.M. have ownership interest in BerGenBio ASA. R.V. is a current employee at Orion Corporation. The other authors declare that they have no competing interests.

Figures

Fig. 1.
Fig. 1.. AKT isoforms in AXL-TBK1 signaling.
(A) Gene coexpression analysis for AKT isoforms and EMT and stem cell–associated genes in pancreas cancer cell lines. Red and blue show positive and negative correlation for mRNA levels, respectively. (B) Gene coexpression analysis for AKT isoforms and AXL using GEPIA in PAAD tumors from TCGA and GTEx databases. X and Y axes show relative expression levels of AXL and an individual AKT isoforms, respectively. AXL:AKT1, P = 2.3 × 10⁻¹⁰, R = 0.45; AXL:AKT2, P = 3.4 × 10⁻⁹, R = 0.42; AXL:AKT3, P = 3.1 × 10⁻¹¹, P = 0.47. (C) Phosphorylation status of TBK1 and AKT isoforms upon Gas6 stimulation of AXL in Panc1 cells by immunoblotting (n = 3 over three independent experiments). The cells were pretreated with AXLi and stimulated with Gas6 in the presence or absence of the inhibitor or left unstimulated (Control/UN). AKT1, AKT2, and AKT3 were immunoprecipitated with α-AKT1, α-AKT2, and α-AKT3 Ab, respectively, and blotted with α-pAKT (S473) Ab. Total protein levels were tested with α-AKT1, α-AKT2, and α-AKT3 Ab, respectively. Phosphorylation of AXL was tested by sandwich ELISA using α-AXL and α-pAXL (Tyr866) Ab. Means ± SEM pAKT/AKT3 is shown. (D) Modification of AKT3 by SUMO in Panc1 cells determined by immunoblotting (n = 2 over two independent experiments). Untreated Panc1 cells were immunoprecipitated with indicated α-AKT3 Ab and blotted with α-SUMO1 or α-Sumo2/3 Ab or α-AKT3 Ab. (E) Expression of indicated genes in the empty vector control KPfC CAS9-EV or AKT3 KO cell lines (AKT3 KO A, AKT3 KO B) by immunoblotting (n = 3 over three independent experiments). (F) Accumulation of indicated proteins and phosphorylation of AKT3 was tested in TBK1+/+, TBK1Δ/Δ, and TBK1Δ/Δ KIC PDA cells transduced with myrAKT3 (TBK1Δ/Δ-myrAKT3), n = 3 over three independent experiments. AKT3 was immunoprecipitated and blotted with α-pAKT (S473) and AKT3 Ab. (G) In vitro cell migration and invasion assay of TBK1+/+, TBK1Δ/Δ, and TBK1Δ/Δ-myrAKT3 cell lines (n = 3 over three independent experiments). The cells were stained with phalloidin (red) and Hoechst (blue). Scale bar, 50 μm.
Fig. 2.
Fig. 2.. TBK1 and AKT3 interaction and AKT3 activation.
(A) Subcellular localization of TBK1 and AKT3 in Panc1 cells by confocal microscopy. Representative images shown (n = 3 over three independent experiments). Scale bar, 20 μm. (B and C) Endogenous AKT3 or TBK1 pull-down with epitope-tagged TBK1 or AKT3, respectively (n = 2 over two independent experiments). HEK293 cells (B) were transfected with constructs expressing either MFlag-TBK1, MFlag-AKT3, or MHA-AKT3 or left untransfected (UN). Panc1 cells were transfected with a construct expressing HA-AKT3 or left untransfected (UN). Immunoprecipitation was performed with α-Flag or α-HA Ab. The lysates and immunoprecipitants were blotted with α-AKT3 or α-TBK1 Ab. (D) Pull-down of endogenous AKT3:TBK1 complexes with α-AKT3 or α-TBK1 Ab from unstimulated (UN) or Gas6-stimulated cell lysates (n = 2 over two independent experiments). The lysates and immunoprecipitants were probed with α-TBK1 and α-AKT3 Ab. Ag, agarose-only control. (E) In vitro kinase activity assay was done using recombinant TBK1 and AKT3 proteins and cold ATP. AKT3 phosphorylation sites were identified by MS (n = 1 over two experiments).
Fig. 3.
Fig. 3.. Subcellular localization of activated AKT3 after Gas6 stimulation and AKT3 in cell invasion.
(A) Protein subcellular localization and accumulation in Panc1 cells before and after AXL stimulation (n = 3 over three independent experiments). Panc1 cells pretreated with indicated inhibitors and stimulated with Gas6 in the presence or absence of the inhibitors or left untreated (UN), lysed, and fractionated. Whole cell lysate (WCL), nuclear (Nuc), or cytoplasmic (Cyt) fractions were probed with indicated Abs. To determine Akt3 phosphorylation status, AKT3 was immunoprecipitated with α-AKT3 Abs and blotted with α-pAKT (S473) Ab. Total protein level of AKT3 are shown. AXL was immunoprecipitated with α-AXL Ab and blotted with α-pAXL (Tyr702) or α-AXL Ab. Means ± SEM nuclear Snail and mean ± SEM pAKT/AKT3 is shown. (B) In vitro cell migration and invasion assay for KPfC AKT3 KO A and AKT3 KO B and their derivative cell lines, WT AKT3 rescue AKT3 KO: AKT3 and mutant AKT3-NLS1 rescue AKT3 KO: AKT3-NLS1 cells. Representative images shown (n = 3 over three independent experiments). All cells including empty vector control CAS9-EV were stained for phalloidin (red) and Hoechst (blue). Scale bar, 50 μm. **P < 0.01; ***P < 0.005. Adjusted P values were calculated using Dunn’s multiple comparison test.
Fig. 4.
Fig. 4.. Subcellular localization of Snail and half-life after Gas6 stimulation.
(A) Subcellular localization of Snail in Gas6-stimulated Panc1 cells. Representative images shown (n = 3 over three independent experiments). Panc1 cells were pretreated with AXLi and stimulated with Gas6 in the presence or absence of the inhibitor or left unstimulated (UN). Scale bar, 25 μm. (B) Localization of Snail and AKT3 in Panc1 cells. Representative images shown (n = 3 over three independent experiments). Scale bar, 20 μm. (C) Pull-down of endogenous TBK1:AKT3:Snail complexes with α-AKT3 Ab from untreated Panc1 cell lysates (n = 2 over two independent experiments). WCL or fractionated cell lysates and the immunoprecipitants were probed with α-Snail, α-TBK1, and α-AKT3 Ab. Ag, agarose only. Asterisks (*) show protein bands of the predicted molecular weights. (D) AKT3 accumulation in parental and shAKT3 transduced Panc1 cells (n = 3 over three independent experiments). (E) Parental or AKT3 shRNA (shAKT3) transduced Panc1 cells were treated with CHX in the presence or absence of Gas6 and harvested at indicated time points (n = 3 over three independent experiments). The lysates were probed with α-Snail and α–β-actin or α–glyceraldehyde-3-phosphate dehydrogenase Ab. Means ± SEM. Snail expression was normalized against β-actin and shown as % CHX 0-hour chase.
Fig. 5.
Fig. 5.. Effect of AKT3 inhibitor BGB214 (AKT3i) on Snail accumulation.
(A) Differences in sequence between AKT1, AKT2, and AKT3 around the allosteric site include a deletion in AKT2 and AKT3 compared with AKT1. (B) Surface view of the front of the allosteric binding site of AKT3, including bound allosteric inhibitor AKT VIII (green). Homology model of AKT3 based on crystal structures of AKT1 bound to AKT VIII (PDB 3o96) and AKT2 kinase domain (PDB 1o6k). Side chains from the AKT1 crystal structure (Lys268, yellow) and the AKT2 crystal structure (Arg269, magenta) are superimposed. A molecule with similar structure to BGB214 (pink) docked at the allosteric site clashes with Lys268 of AKT1 (yellow). (C) Structure of BGB214. (D) Inhibition of AKT1, AKT2, and AKT3 enzymatic activity on GSK3α-derived Ultra U lightTM-labeled crosstide substrate (n = 3 over three independent experiments). (E) The effect of BGB214 (AKT3i) on Panc1 viability in vitro (n = 4 over four independent experiments). Eight different drug concentrations were tested with eight replicates per concentration. Relative cell number was determined by MTS assay. (F) Protein accumulation in Panc1 cells stimulated with Gas6 in the presence or absence of AXLi, TBK1i, and AKT3i were tested by immunoblotting (n = 3 over three independent experiments). Panc1 cells were pretreated with indicated inhibitors and stimulated with Gas6 in the presence or absence of the inhibitors or left unstimulated (UN). AKT3 was immunoprecipitated with α-AKT3 Ab and blotted with α-pAKT (S473) or α-AKT3 Ab. AXL was immunoprecipitated with α-AXL Ab and blotted with pAXL (Tyr702) or AXL Ab.
Fig. 6.
Fig. 6.. The effect of AKT3 expression on tumor differentiation and metastasis in mice.
C57BL/6J mice were injected orthotopically with 250,000 KPfC PDA cells (CAS9-EV, AKT3 KO, or rescue). (A) Gross metastases (CAS9-EV, 3 of 9; AKT3 KO, 0 of 10; rescue, 6 of 9) and (B) primary tumor weights (n = 9 or 10 per group). (C and D) Representative images of H&E staining and CK19 IHC in livers. CK19 reactivity was quantified as a percent of total liver area [(C) and (D) n = 6 per group]. (E) Representative images of tumors stained using H&E and IHC for E-cadherin and vimentin (n = 6 per group). (F) Accumulations of AKT3, ECad, and vimentin were tested in KPfC CAS9-EV, AKT3 KO, and rescue cells by immunoblotting (n = 3 over three independent experiments). Cells were lysed and probed with indicated Ab. Percent area of Ecad (G) and vimentin (H) was quantified (n = 4 to 6 per group as indicated in bar graph). Adjusted P values were calculated using Dunn’s multiple comparison tests (*P < 0.05; **P < 0.01). ns, not significant.
Fig. 7.
Fig. 7.. Expression and localization of AKT3 and Snail in human PDA.
(A) Representative images of IHC for AKT3 and AXL in human PDA (n = 71). (B) Shows number of cases with nuclear and cytoplasmic AKT3 and AXL-positive and -negative human PDA. P value was calculated using Fisher’s exact test. (C) Representative images of IHC staining for AKT3 (red) and Snail (green) in human AXL-positive/nuclear AKT3 PDA (n = 8). Scale bar, 100 μm.
Fig. 8.
Fig. 8.. Working model: AXL signaling induces TBK1-dependent phosphorylation of AKT3, accumulation of Snail in the nucleus, and promotes EMT.
AXL activation by its ligand Gas6 leads to phosphorylation and activation of TBK1 and subsequent phosphorylation of AKT3 either directly by TBK1 or via TBK1-mTORC1. Nuclear TBK1 phosphorylates AKT3 located in the nucleus. In addition, AKT3, phosphorylated by cytoplasmic TBK1, may travel to the nucleus. Accumulation of pAKT3 in the nucleus results in accumulation/stabilization of Snail, an EMT-TF in the nucleus, which leads to EMT.

References

    1. Wang Z, Li Y, Ahmad A, Banerjee S, Azmi AS, Kong D, Sarkar FH, Pancreatic cancer: Understanding and overcoming chemoresistance. Nat. Rev. Gastroenterol. Hepatol. 8, 27–33 (2011). - PubMed
    1. Tran DD, Corsa CAS, Biswas H, Aft RL, Longmore GD, Temporal and spatial cooperation of Snail1 and Twist1 during epithelial-mesenchymal transition predicts for human breast cancer recurrence. Mol. Cancer Res. 9, 1644–1657 (2011). - PMC - PubMed
    1. Seyfried TN, Huysentruyt LC, On the origin of cancer metastasis. Crit. Rev. Oncog. 18, 43–73 (2013). - PMC - PubMed
    1. Cates JM, Byrd RH, Fohn LE, Tatsas AD, Washington MK, Black CC, Epithelial-mesenchymal transition markers in pancreatic ductal adenocarcinoma. Pancreas 38, e1–e6 (2009). - PMC - PubMed
    1. Kudo-Saito C, Shirako H, Takeuchi T, Kawakami Y, Cancer metastasis is accelerated through immunosuppression during Snail-induced EMT of cancer cells. Cancer Cell 15, 195–206 (2009). - PubMed

Publication types

MeSH terms

Substances