Review
. 2025 May;54(1):35-57.
doi: 10.1146/annurev-biophys-030524-013431. Epub 2024 Dec 17.

Protein Modeling with DEER Spectroscopy

Affiliations
Review

Protein Modeling with DEER Spectroscopy

Maxx H Tessmer et al. Annu Rev Biophys. 2025 May.

Abstract

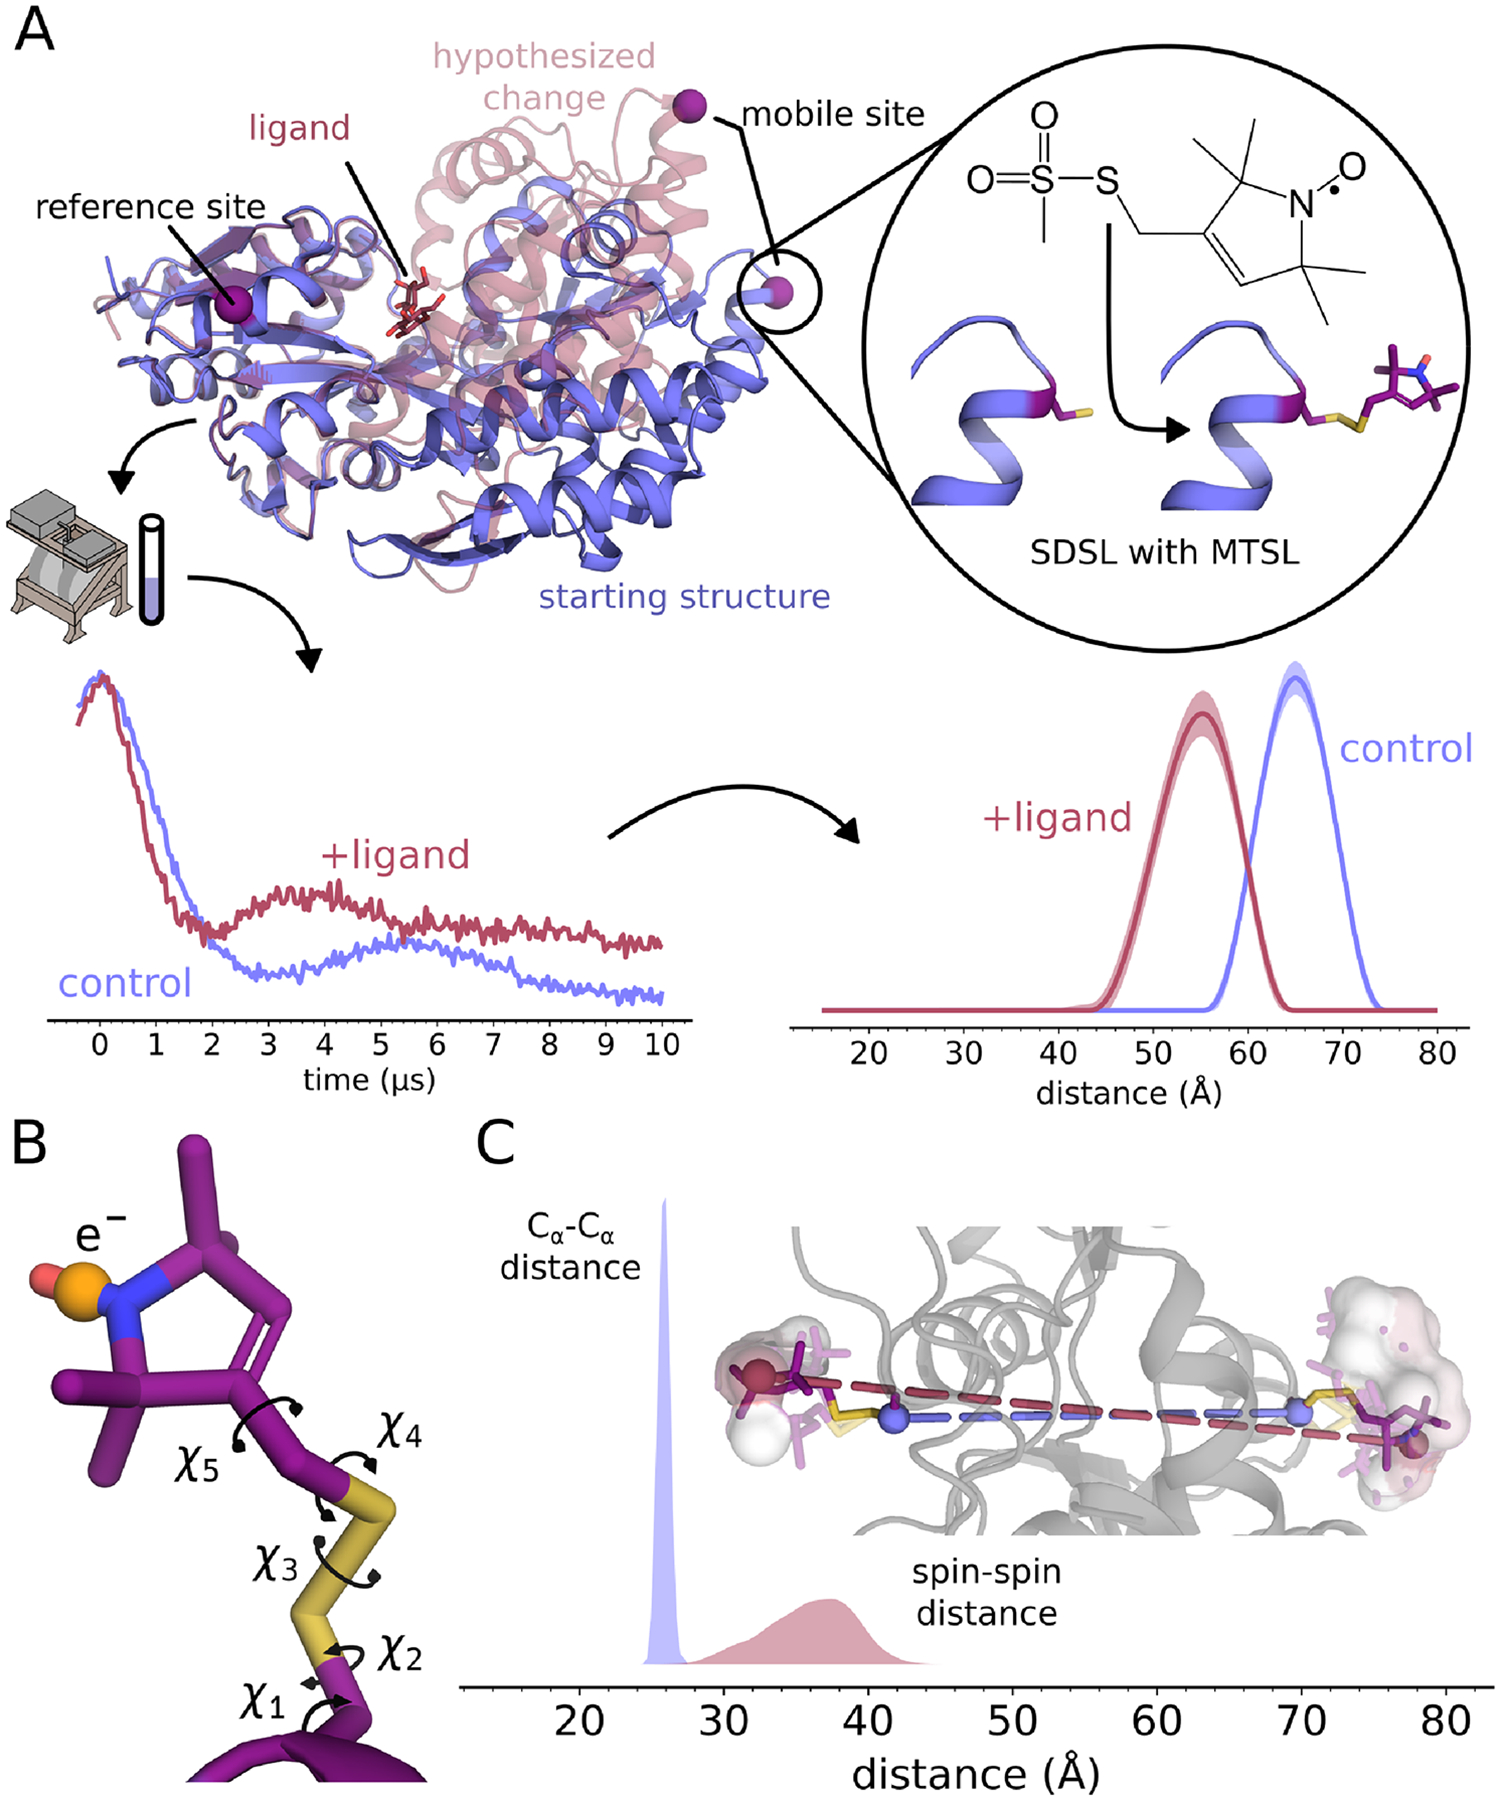
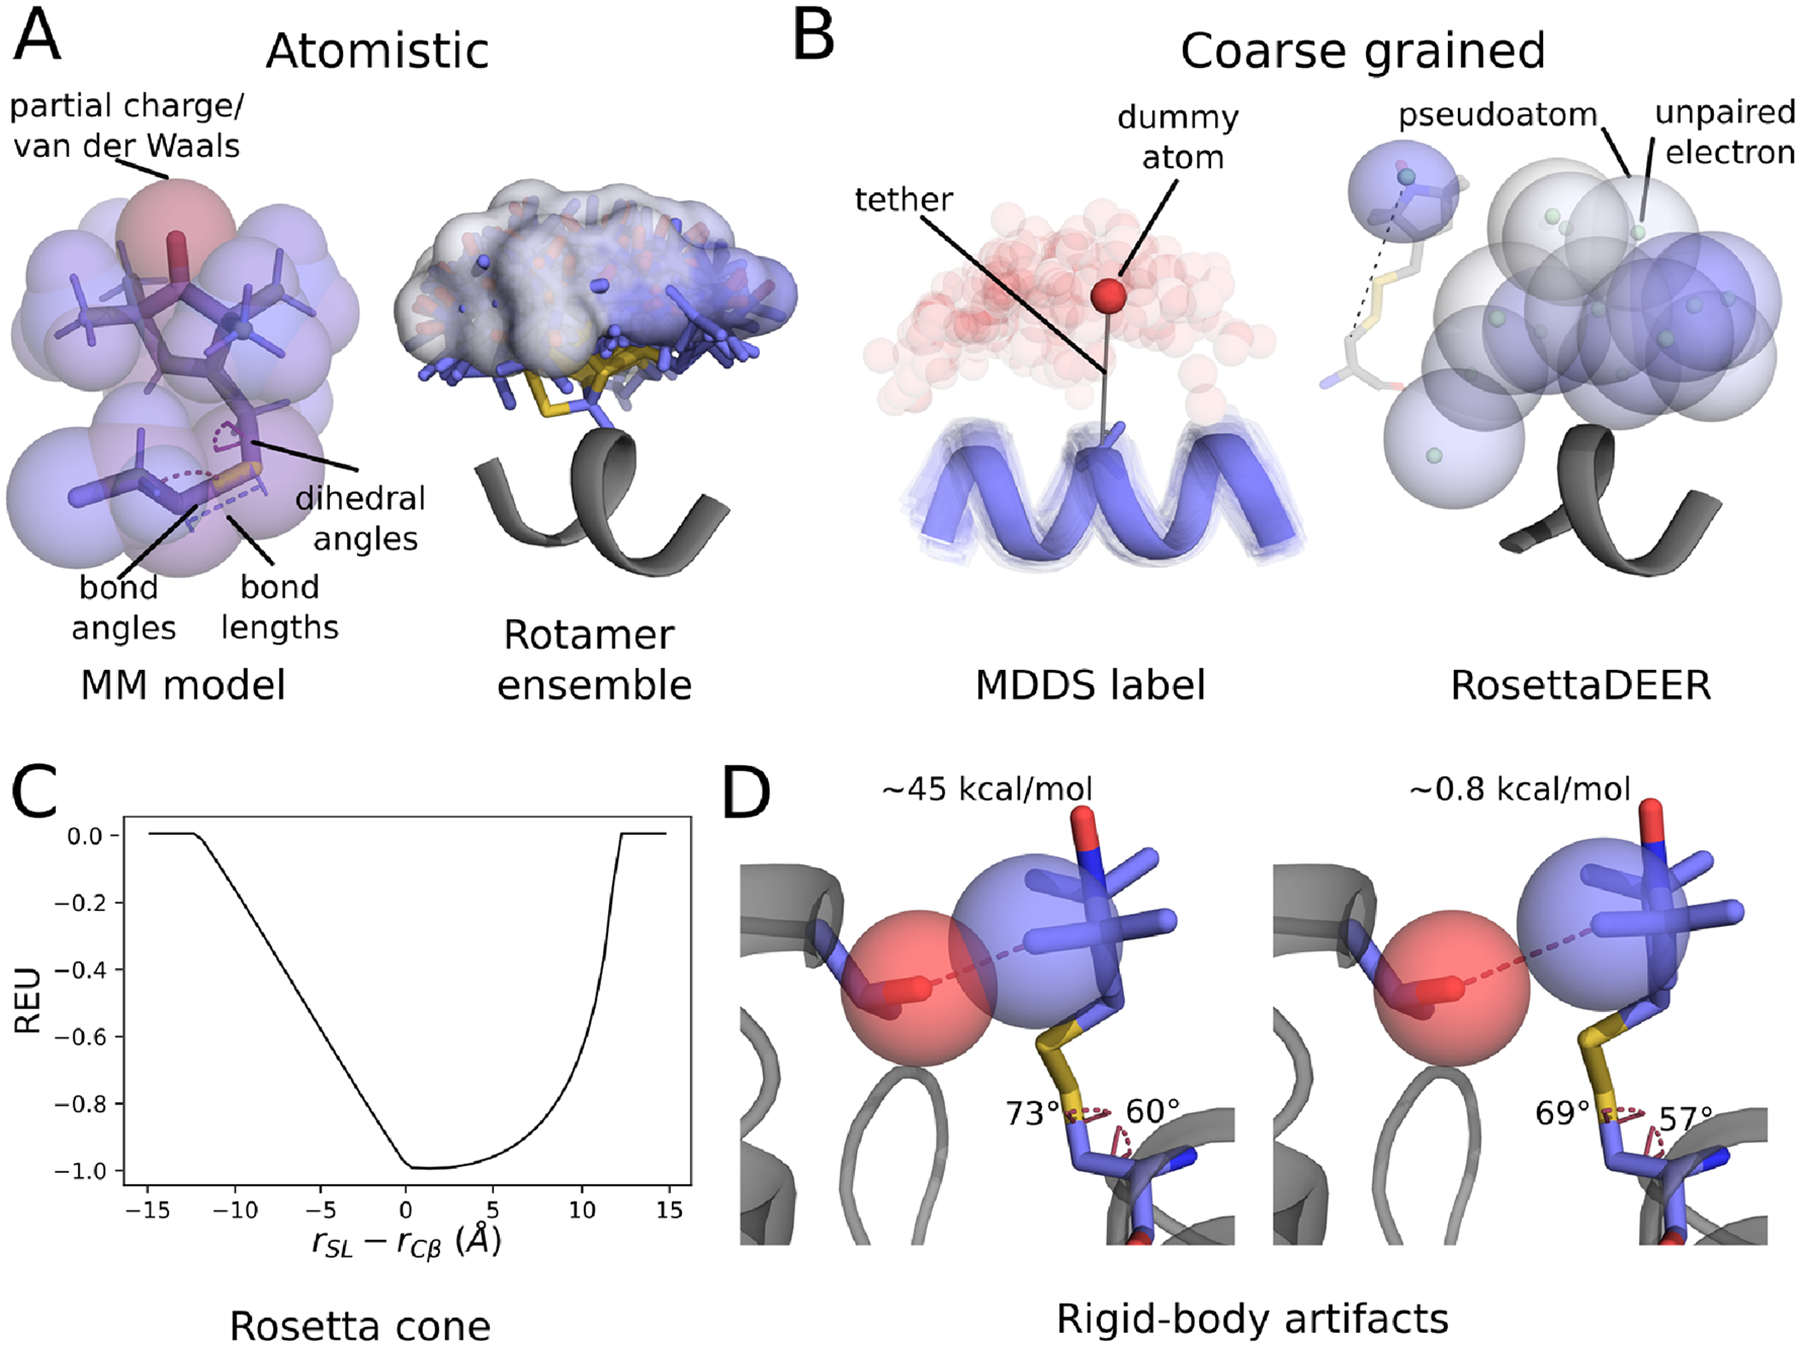
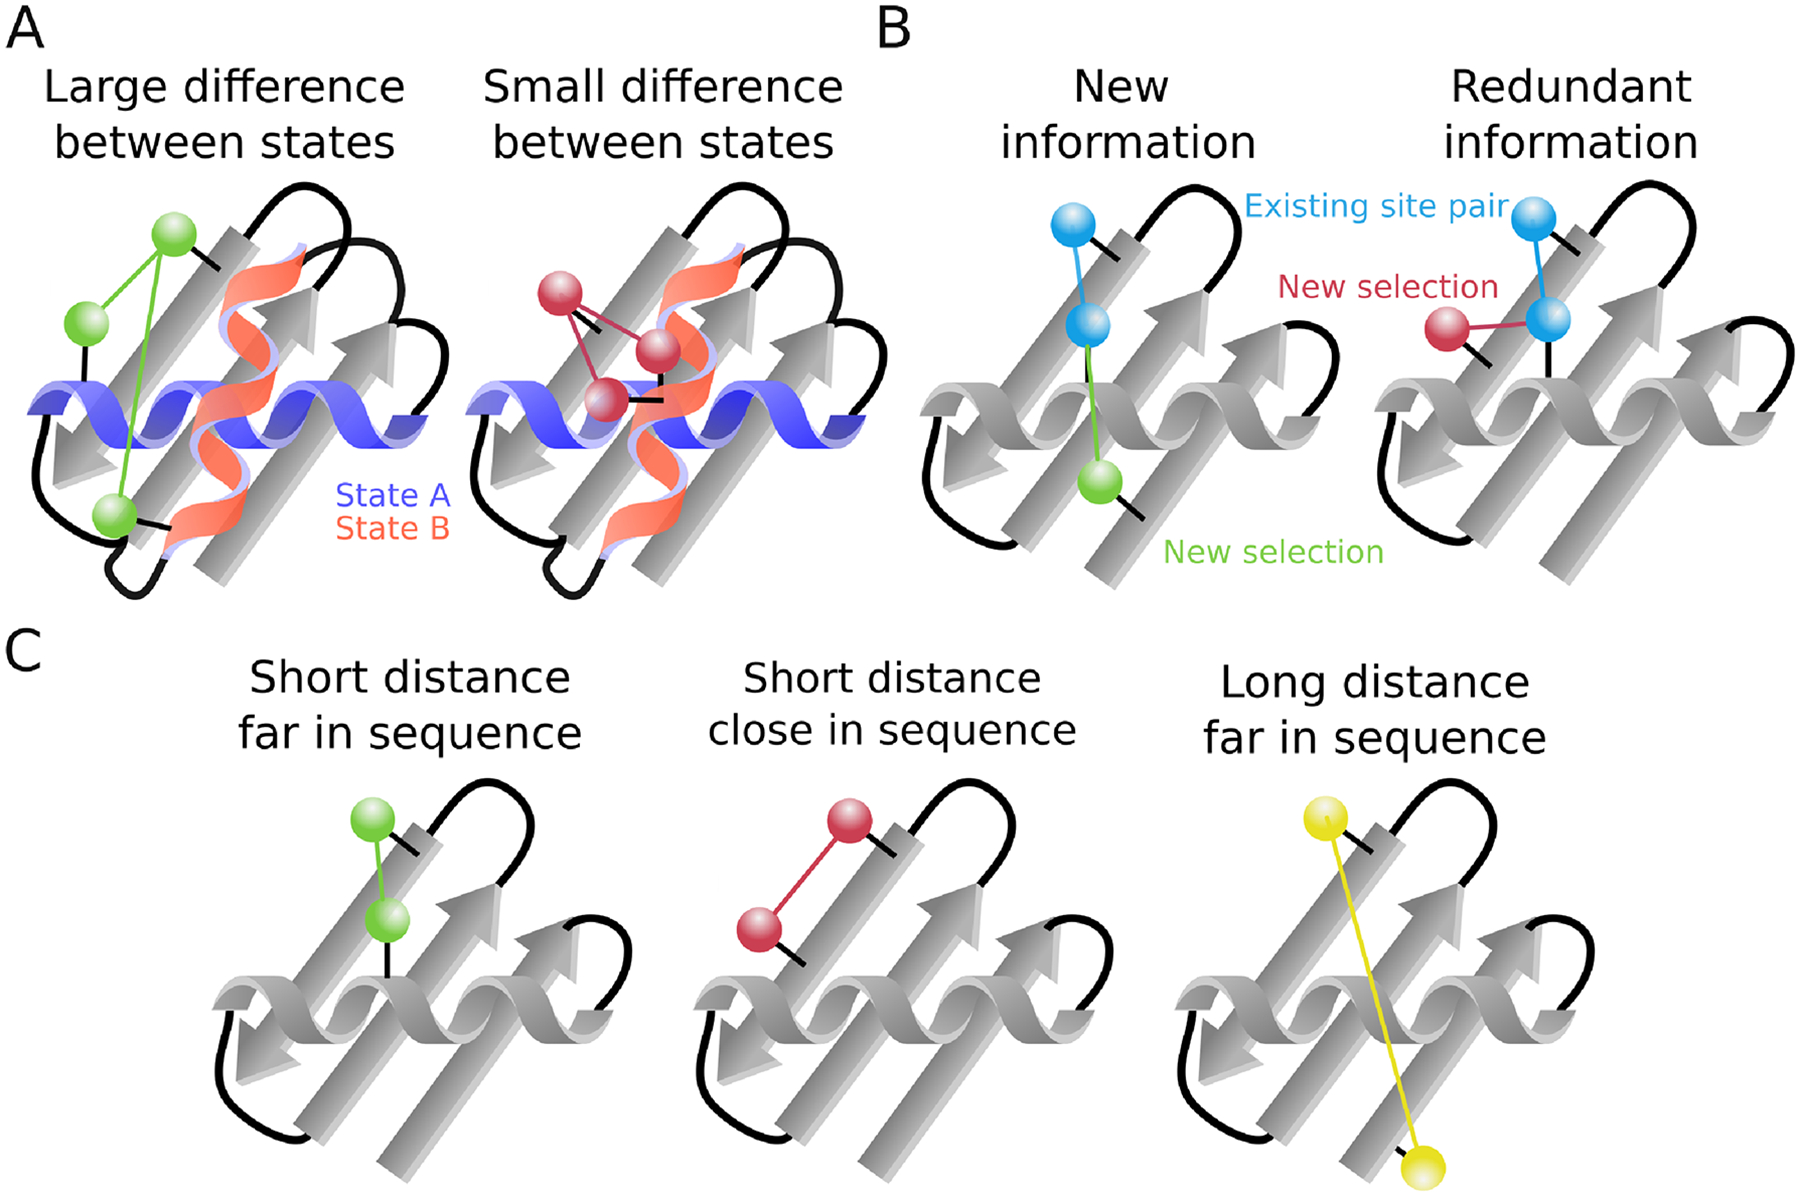
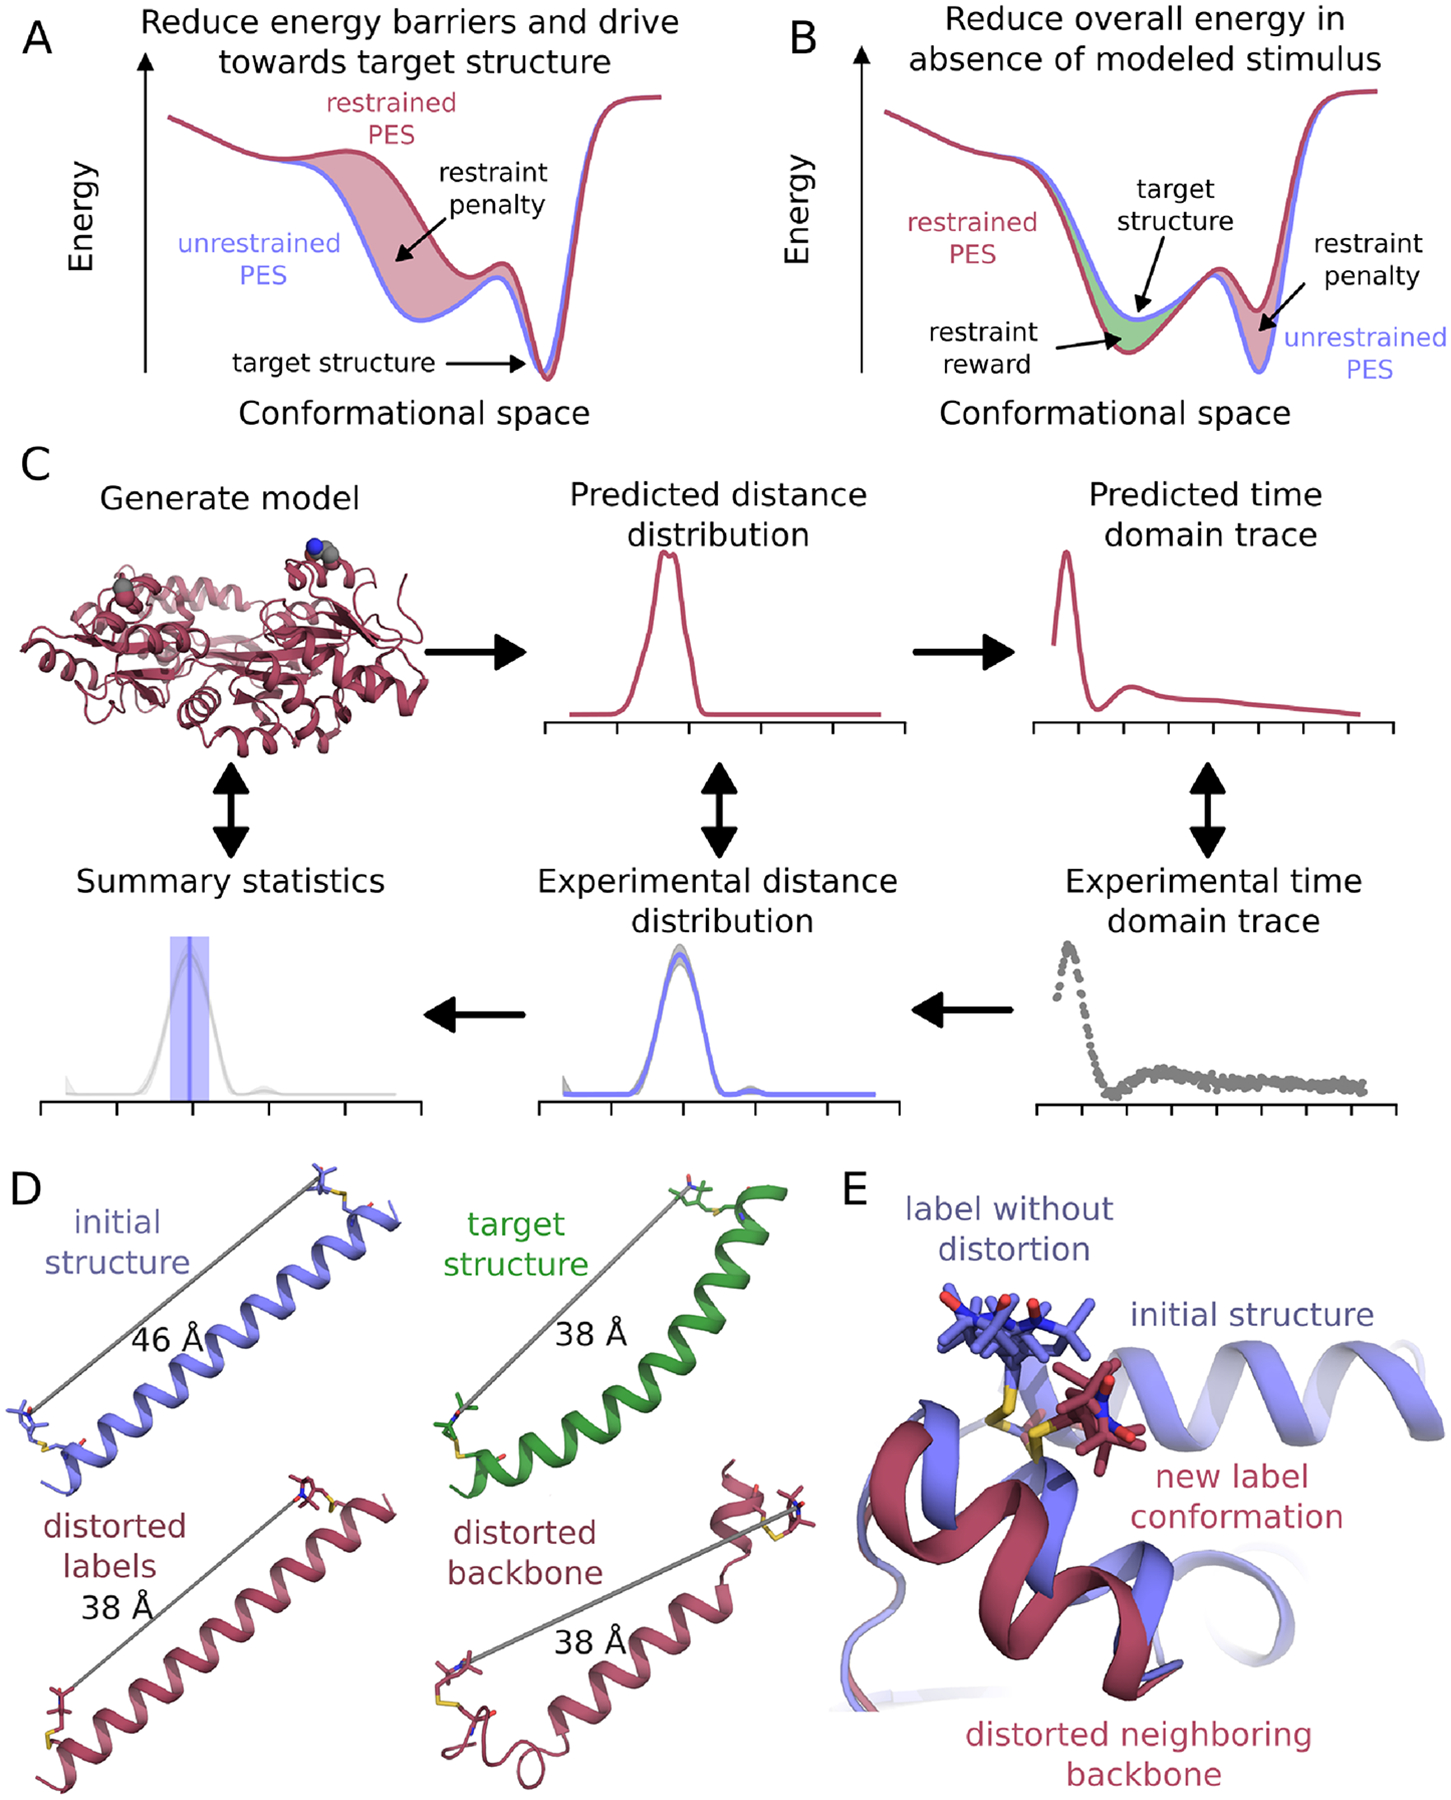
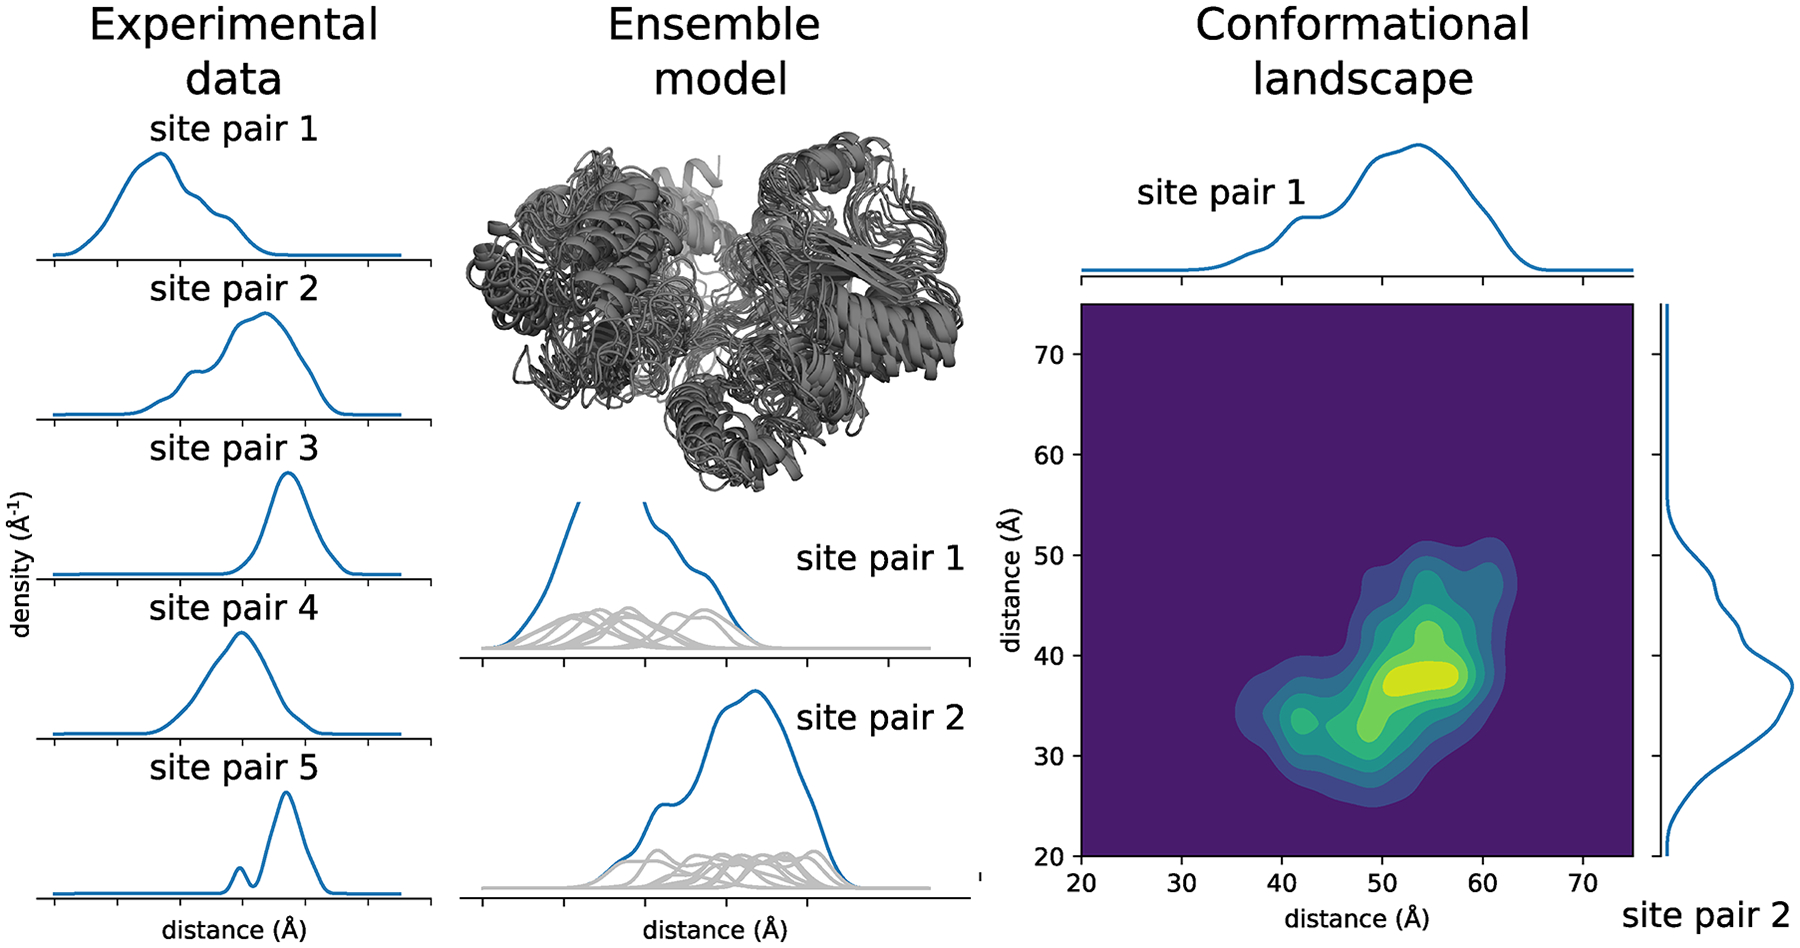
Double electron-electron resonance (DEER) combined with site-directed spin labeling can provide distance distributions between selected protein residues to investigate protein structure and conformational heterogeneity. The utilization of the full quantitative information contained in DEER data requires effective protein and spin label modeling methods. Here, we review the application of DEER data to protein modeling. First, we discuss the significance of spin label modeling for accurate extraction of protein structural information and review the most popular label modeling methods. Next, we review several important aspects of protein modeling with DEER, including site selection, how DEER restraints are applied, common artifacts, and the unique potential of DEER data for modeling structural ensembles and conformational landscapes. Finally, we discuss common applications of protein modeling with DEER data and provide an outlook.

Keywords: DEER; EPR spectroscopy; integrative modeling; spin labeling.


Figures

Figure 1.
Figure 1.
Site-directed spin labeling and DEER. A) Common experimental workflow. B) Side chain of the MTSL-derived spin label R1. C) Distribution of Cα-Cα distances compared to spin–spin distances of a short MD simulation of a spin-labeled protein.
Figure 2.
Figure 2.
Spin label modeling. A) Atomistic models. B) Coarse-grained models. C) Example of an empirical potential. D) Rigid-body artifacts.
Figure 3.
Figure 3.
Choosing SDSL site pairs. Yellow spheres indicate label sites that provide modest information content, and red spheres indicate poor choices of labeling sites. A) Labeling sites with large differences between states. States differ in the position of the helix with one state shown in blue and the other in orange. Sites are chosen to maximize changes in distances between the two states. B) Avoiding redundant labeling. Blue spheres indicate pre-selected label sites, green spheres indicate good choices of labeling sites, while the red sphere indicates a redundant selection. Distributing site pairs between different secondary structure elements can help maximize information. C) Short distances between residues far in sequence provide the most information. Short distances close in sequence provide very little information since they are constrained by the protein backbone. Long distances can provide useful information, but do not reduce the conformational search space as much as short distances.
Figure 4.
Figure 4.
Application of DEER data as protein modeling restraints. A) and B) Alteration of the energetic landscape by application of experimental restraints. C) Various forms in which DEER data can be used as experimental restraints. Summary statistics can be extracted from the protein model and compared to those derived from the experimental data (left), spin label models can be used to predict distance distributions from the protein model which can be compared to the distance distributions obtained by analyzing the experimental time-domain trace (middle), and the predicted time-domain trace can be obtained from the predicted distance distribution and compared to the experimental time-domain trace (right). D) Overfitting by direct backbone and label distortion. E) Indirect backbone distortion.
Figure 5.
Figure 5.
Ensemble modeling of maltose binding protein with DEER data to probe the conformational energetic landscape. Experimental data collected from a conformationally heterogeneous protein (left). A hypothetical ensemble model built using the experimental data (center) with two representative distance distributions (blue) and their ensemble member subcomponents (gray). A slice of the protein conformational distribution built from the ensemble model.

Similar articles

Cited by

References

    1. Abdullin D 2020. AnisoDipFit: Simulation and Fitting of Pulsed EPR Dipolar Spectroscopy Data for Anisotropic Spin Centers. Appl. Magn. Reson, pp. 1–24
    1. Ackermann K, Chapman A, Bode BE. 2021. A comparison of cysteine-conjugated nitroxide spin labels for pulse dipolar EPR spectroscopy. Molecules. 26(24):7534. - PMC - PubMed
    1. Ahdritz G, Bouatta N, Kadyan S, Xia Q, Gerecke W, et al. 2022. OpenFold: Retraining AlphaFold2 yields new insights into its learning mechanisms and capacity for generalization. bioRxiv. 2022.11.20.517210 - PMC - PubMed
    1. Ahmed A, Rippmann F, Barnickel G, Gohlke H. 2011. A normal mode-based geometric simulation approach for exploring biologically relevant conformational transitions in proteins. J. Chem. Inf. Model 51(7):1604–22 - PubMed
    1. del Alamo D, Tessmer MH, Stein RA, Feix JB, Mchaourab HS, Meiler J. 2019. Rapid simulation of unprocessed DEER decay data for protein fold prediction. Biophys. J 2(118):366–75 - PMC - PubMed

LinkOut - more resources