. 2024 Dec;14(12):e70111.
doi: 10.1002/ctm2.70111.

PARylation of HMGA1 desensitizes esophageal squamous cell carcinoma to olaparib

Affiliations

PARylation of HMGA1 desensitizes esophageal squamous cell carcinoma to olaparib

Xin-Yuan Lei et al. Clin Transl Med. 2024 Dec.

Abstract

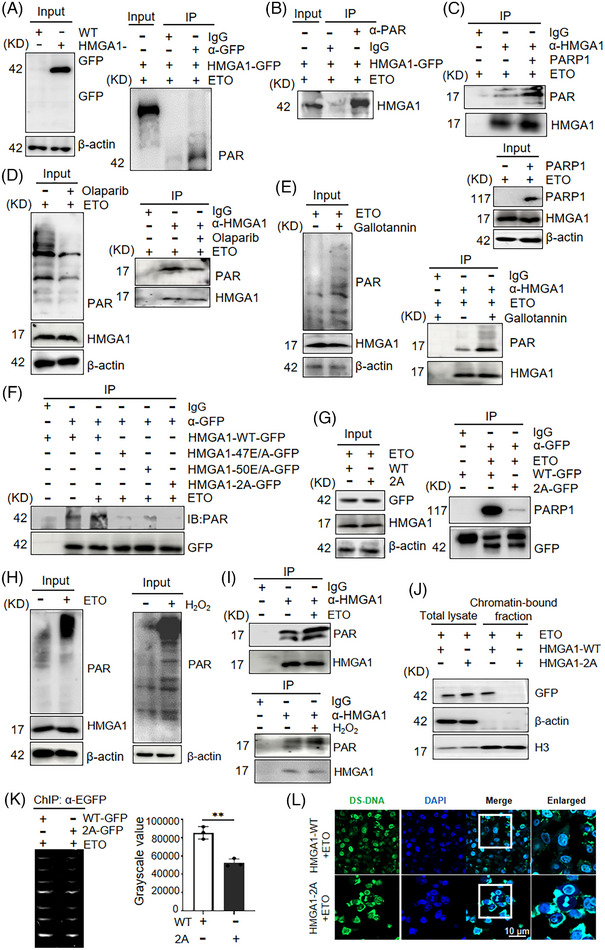
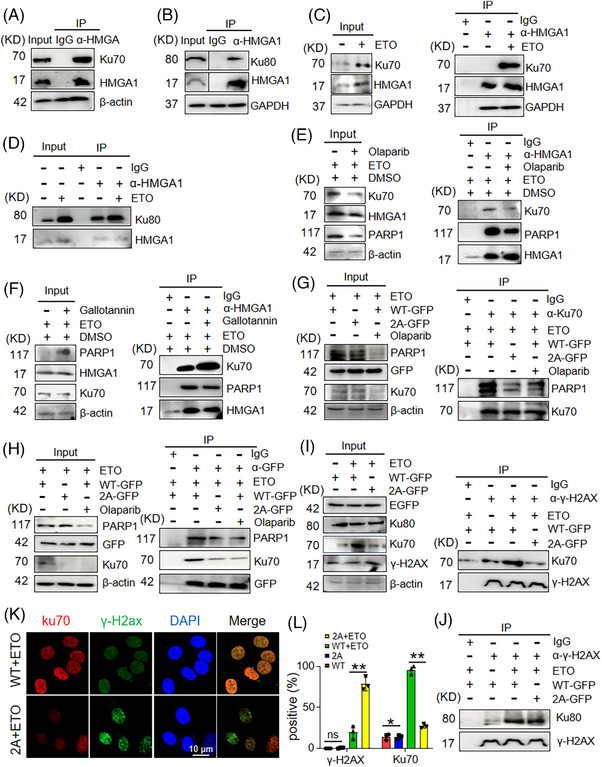
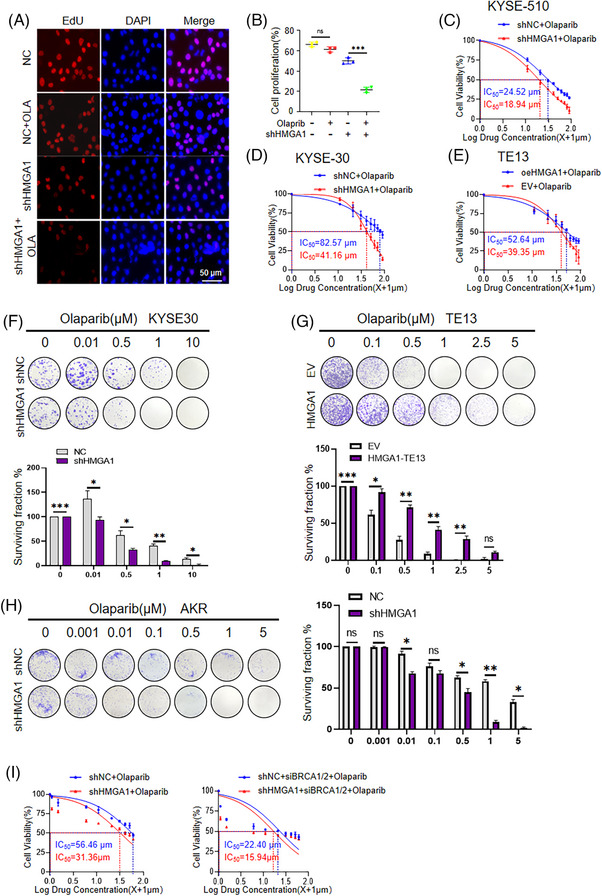
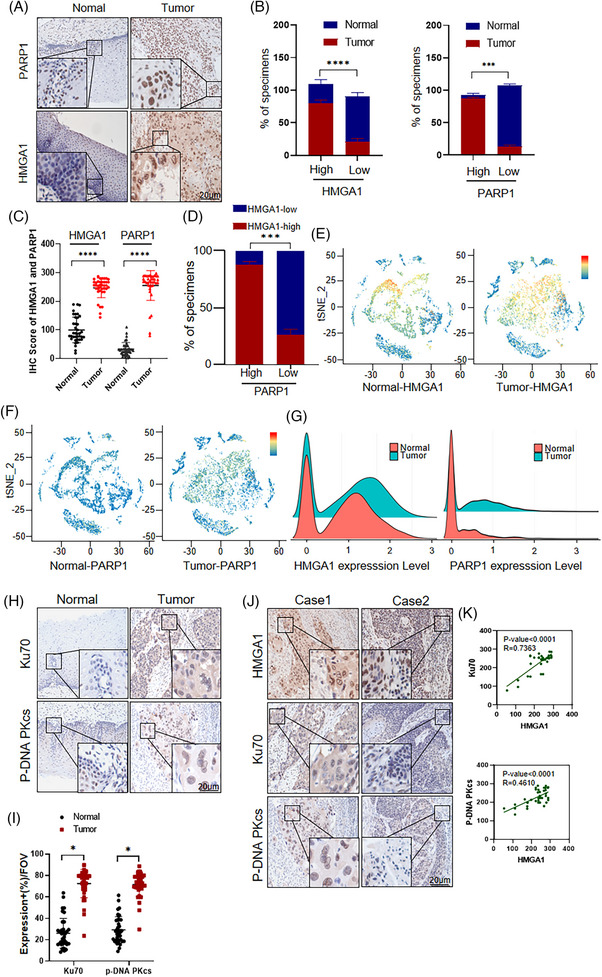
As a chromatin remodelling factor, high mobility group A1 (HMGA1) plays various roles in both physiological and pathological conditions. However, its role in DNA damage response and DNA damage-based chemotherapy remains largely unexplored. In this study, we report the poly ADP-ribosylation (PARylation) of HMGA1 during DNA damage, leading to desensitization of esophageal squamous cell carcinoma (ESCC) cells to the poly(ADP-ribose) polymerase 1 (PARP1) inhibitor, olaparib. We found that HMGA1 accumulates at sites of DNA damage, where it interacts with PARP1 and undergoes PARylation at residues E47 and E50 in its conserved AT-hook domain. This modification enhances the accumulation of Ku70/Ku80 at the site of DNA damage and activates the DNA-dependent protein kinase catalytic subunit, facilitating nonhomologous end-joining repair. In both subcutaneous tumour models and genetically engineered mouse models of in situ esophageal cancer, HMGA1 interference increased tumour sensitivity to olaparib. Moreover, HMGA1 was highly expressed in ESCC tissues and positively correlated with PARP1 levels as well as poor prognosis in ESCC patients. Taken together, these findings reveal a mechanistic link between HMGA1 and PARP1 in regulating cell responses to DNA damage and suggest that targeting HMGA1 could be a promising strategy to increase cancer cell sensitivity to olaparib.

Keywords: DNA damage; ESCC; HMGA1; Olaparib; PARP1; PARylation; chemotherapy sensitivity.


Conflict of interest statement

The authors declare no conflict of interest.

Figures

FIGURE 1
FIGURE 1
HMGA1 interacts with PARP1. (A) KYSE30 cell lysates were subjected to IP pull‐down experiments with anti‐HMGA1 antibody, followed by Coomassie blue staining after SDS‐PAGE, and analyzed by mass spectrometry (MS). (B) KYSE30 cells were treated with etoposide (ETO, 20 µM) for 2 h, stained with specific antibodies for immunofluorescence, and nuclei were labelled with DAPI. (C, D) KYSE30 cell lysates were subjected to IP pull‐down using anti‐HMGA1 or anti‐PARP1 antibodies, and the corresponding proteins were detected by Western blot (WB), n = 3. (E–H) IP pull‐down assays were performed using anti‐Flag and anti‐GFP antibodies, followed by WB detection for HMGA1 and PARP1, n = 3. (I) In vitro pull‐down assays were conducted using an anti‐His antibody after protein purification, n = 3. (J) PARP1 domain diagram: ART, ADP‐ribosyl transferase; BRCT, BRCA1 C‐terminal; HD, helical subdomain; ZF, zinc finger. (K) HMGA1 domain diagram showing the AT‐hook domain. (L) PARP1 domain deletions were incubated with KYSE‐30 whole cell lysate, and pull‐down proteins were analyzed by WB using an anti‐Flag antibody, n = 3. (M) HMGA1 domain deletions were incubated with KYSE‐30 whole‐cell lysate, and pull‐down proteins were analyzed by WB using an anti‐GFP antibody, n = 3.
FIGURE 2
FIGURE 2
HMGA1 responds to DNA damage and promotes DNA damage repair. (A) Immunofluorescence shows the localization of HMGA1 and PARP1 following etoposide treatment. (B) Interaction between HMGA1 and PARP1 post‐etoposide treatment was detected by IP pull‐down using an anti‐HMGA1 antibody, n = 3. (C–E) After etoposide and olaparib treatment, the interaction between PARP1 and HMGA1 was detected by IP pull‐down using anti‐PARP1 and anti‐HMGA1 antibodies, respectively, compared with untreated cells, n = 3. (F) Stable HMGA1 knockdown KYSE‐30 cells were analyzed by WB to detect protein expression following etoposide treatment for 2h, n = 3. (G) HMGA1‐overexpressing stable TE13 cells were analyzed by WB to detect protein expression in response to etoposide (20 µM) treatment for 2 h, n = 3. (H, I) Control and etoposide‐treated (20 µM for 2 h) KYSE30 cells were stained with anti‐HMGA1 and γ‐H2AX antibodies, and nuclei were stained with DAPI. Immunofluorescence showed the accumulation of HMGA1 at DNA damage sites (H), with 100 cells counted to calculate the positive rate of HMGA1 localization (I). ***p < .001, n = 3. (J) KYSE30 cells were treated with etoposide for 2 h, followed by immunofluorescence staining using specific antibodies. Nuclei and double‐stranded DNA were labelled with DAPI and dsDNA markers. (K) Schematic representation of the pCMV‐mCherry‐EGFP NHEJ fluorescent reporter plasmid working principle. (L, M) HEK293 cells transfected with the pCMV‐mCherry‐EGFP NHEJ fluorescent reporter plasmid were used to detect the effect of HMGA1 mutation on NHEJ repair efficiency. Positive and negative cells in the visual field were counted, and the percentage of positive cells was calculated (M). *p < .05, **p < .01, ***p < .001, n = 3. (N) Control and HMGA1‐knockdown TYK‐nu cells were transfected with BRCA1/2 siRNA, and WB was performed to detect γ‐H2AX expression after etoposide (20 µM) treatment for 2 h, n = 3. (O) Control and HMGA1‐overexpressing TE13 cells were transfected with BRCA1/2 siRNA, and WB was performed to detect γ‐H2AX expression after etoposide (20 µM) treatment for 2 h, n = 3. (P, Q) Control and HMGA1 knockdown KYSE‐30 cells were transfected with BRCA1/2 siRNA and analyzed using the CCK8 assay, n = 3.
FIGURE 3
FIGURE 3
PARP1 induces the PARylation of HMGA1. (A, B) GFP‐HMGA1‐overexpressing cells were treated with etoposide (20 µM) for 2 h, lysed with 4% SDS buffer, and subjected to IP pull‐down using anti‐GFP (A) or anti‐PAR antibody, followed by WB detection with anti‐PAR/anti‐HMGA1 antibodies, n = 3. (C, D) IP pull‐down using anti‐HMGA1 antibodies detected PARP1 following etoposide (C) or olaparib (D) treatment, n = 3. (E) Cells were treated with gallotannin, followed by IP pull‐down using an anti‐HMGA1 antibody and WB detection for PARP1, n = 3. (F) PARylation of HMGA1 was detected in cells expressing PAR‐modified HMGA1 mutants, n = 3. (G) The effect of PAR modification on the interaction between HMGA1 and PARP1 was assessed using IP with an anti‐GFP antibody, n = 3. (H, I) HMGA1 PARylation was detected by co‐IP after etoposide (H) or H2O2 (I) treatment, n = 3. (J) Chromatin separation assay showed chromatin binding following the deletion of HMGA1 PAR modification, n = 3. (K) Chromatin binding of HMGA1 after deletion of PARylation was assessed using CHIP analysis, **p < .01, n = 3. (L) Double‐stranded DNA accumulation was detected in HMGA1 PAR‐modified cells using immunofluorescence.
FIGURE 4
FIGURE 4
PARylation of HMGA1 promotes DNA damage repair by recruiting Ku70/Ku80. (A, B) IP pull‐down using an anti‐HMGA1 antibody detected the interaction between HMGA1 and Ku70 (A) or Ku80 (B), n = 3. (C, D) Following etoposide or PBS treatment, IP pull‐down using an anti‐HMGA1 antibody detected the interaction between HMGA1 and Ku70/Ku80, n = 3. (E, F) The interaction between HMGA1 and Ku70 following olaparib (E) or gallotannin (F) treatment was detected using IP pull‐down assays, n = 3. (G) WT‐HMGA1 or 2A‐HMGA1‐overexpressing cells were treated with etoposide and olaparib, and the interaction between Ku70 and PARP1 was assessed using IP pull‐down and WB, n = 3. (H) IP pull‐down using an anti‐GFP antibody detected the interaction between HMGA1‐GFP, Ku70, and PARP1 following etoposide and olaparib treatment in WT‐HMGA1 or 2A‐HMGA1‐overexpressing cells, n = 3. (I, J) IP pull‐down using an anti‐γ‐H2AX antibody detected the interaction of γ‐H2AX with Ku70 and Ku80 in WT‐HMGA1 or 2A‐HMGA1‐overexpressing cells, n = 3. (K, L) Immunofluorescence analysis of Ku70 and γ‐H2AX expression in WT‐HMGA1 or 2A‐HMGA1‐overexpressing cells after etoposide treatment (K) and 100 cells were counted and calculated (L). *p < .05, **p < .01, n = 3.
FIGURE 5
FIGURE 5
HMGA1 promotes DNA damage repair by upregulating DNAPKcs activation. (A) The interaction between HMGA1‐WT‐GFP, HMGA1‐2A‐GFP, and Ku70 with or without etoposide treatment was detected using an anti‐GFP antibody in a pull‐down test, n = 3. (B, C) The expression of γ‐H2AX and p‐DNA PKcs was detected by immunofluorescence in HMGA1‐WT (Flag/HMGA1) and HMGA1‐2A (Flag/HMGA1‐E47A/E50A) cells under etoposide treatment (B), and 100 cells were counted and calculated (C). *p < .05, **p < .01, ***p < .001, n = 3. (D) The interaction between DNAPKcs and Ku70 was detected by a pull‐down test using an anti‐Ku70 antibody in HMGA1‐WT and HMGA1‐2A cells, with etoposide treatment, n = 3. (E) Cell lysates were collected from HMGA1‐WT and HMGA1‐2A cells after etoposide treatment or no treatment, and the related proteins were detected by WB, n = 3. (F) HMGA1‐WT (Flag/HMGA1) and HMGA1‐2A (Flag/HMGA1‐E47A/E50A) cells were co‐transfected with the pCMV‐mCherry‐EGFP NHEJ fluorescent reporter plasmid to assess the effect of HMGA1 mutation on NHEJ repair efficiency. Positive and negative cells were counted, and the percentage of positive cells was calculated. **p < .01, n = 3. (G) The proliferation ability of HMGA1‐WT and HMGA1‐2A cells was detected using an EDU assay under etoposide treatment, ***p < .001, n = 3.
FIGURE 6
FIGURE 6
HMGA1 enhances cancer cell resistance to olaparib. (A, B) KYSE30 with or without HMGA1 knockdown were treated with or without olaparib, and cell proliferation was detected using an EDU assay (A). Data are presented with statistical analysis (B). ***p < .001, n = 3. (C–E) CCK8 assay was used to measure the survival of KYSE‐510, KYSE‐30, and TE13 cells with HMGA1 manipulations under olaparib stimulation, n = 3. (F–H) Colony formation assays were performed in KYSE‐30, KYSE‐510, and TE13 cells with HMGA1 manipulations. The colonies were calculated and shown, *p < .05, **p < .01, ***p < .001, n = 3. (I) CCK8 assay was used to measure cell survival under olaparib stimulation in HMGA1‐depleted TYK‐nu cells with BRCA1/2 siRNA, n = 3.
FIGURE 7
FIGURE 7
Depletion of HMGA1 inhibits ESCC tumorigenesis and sensitizes the tumours to olaparib. (A) After the dissection of the treated subcutaneous tumour, the tissue lysate was analyzed by WB, n = 3. (B–D) Statistical analysis of the size, volume, and weight of subcutaneous tumour tissues, **p < .01, ***p < .001, n = 6. (E, F) The expression and histological scores of HMGA1, γ‐H2AX, Ku70, Ki67, and p‐DNA PKcs were detected by IHC, ***p < .001, n = 6. (G, H) Immunofluorescence detection of γ‐H2AX expression in tissue samples, ***p < .001, n = 6.
FIGURE 8
FIGURE 8
Depletion of HMGA1 inhibits ESCC tumorigenesis and sensitizes the tumours to olaparib. (A) Orthotopic ESCC was induced by 4NQO in WT (Hmga1 flox/flox) and esophageal‐specific HMGA1 knockout (Hmga1 flox/floxK14) mice, followed by olaparib therapy. (B) HMGA1 and PARylation protein levels in esophageal tissues were detected by WB, n = 3. (C) H&E staining was performed to detect tumour progression in esophageal tissues. (D, E) The expression and histological scores of HMGA1, Ki67, cleaved‐caspase 3, γ‐H2AX, Ku70, and p‐DNA PKcs were detected by IHC, ***p < .001, n = 6.
FIGURE 9
FIGURE 9
The high expression of HMGA1 in human ESCC is positively correlated with the expression of PARP1, Ku70, and p‐DNA PKcs. (A) The expression of HMGA1 and PARP1 was detected by IHC in cancer and para‐cancer tissue samples from 38 esophageal cancer patients. (B) The proportions of high and low HMGA1 and PARP1 expression were analyzed in normal and cancer tissue samples from 38 ESCC patients. (C) HMGA1 and PARP1 expression levels were analyzed in 38 ESCC patients. (D) The distribution of PARP1 expression in tissues with high and low HMGA1 expression was analyzed in 38 ESCC patients. (E, F) ESCC single‐cell RNA sequencing data (GSE188900) were downloaded from the GEO database and re‐analyzed using the Seurat software package to compare HMGA1 and PARP1 expression in different cell subtypes of ESCC tissues. (G) The same data were re‐analyzed to compare HMGA1 and PARP1 expression in normal and tumour cells. (H, I) Expression of Ku70 and p‐DNA PKcs in esophageal cancer and para‐cancerous tissues from 38 ESCC patients was detected by IHC, *p < .05, n = 38. (J, K) IHC and statistical analyses were performed to determine the correlation between the expression of Ku70, p‐DNA PKcs, and HMGA1 in ESCC patients, n = 38.

Similar articles

Cited by

References

    1. Lagergren J, Lagergren P. Oesophageal cancer. BMJ (Clin Res Ed). 2010;341:c6280. - PubMed
    1. Yang YM, Hong P, Xu WW, He QY, Li B. Advances in targeted therapy for esophageal cancer. Signal transduction and targeted therapy. 2020;5(1):229. - PMC - PubMed
    1. Li X, Chen L, Luan S, et al. The development and progress of nanomedicine for esophageal cancer diagnosis and treatment. Semin Cancer Biol. 2022;86(Pt 2):873‐885. - PubMed
    1. An J, An S, Choi M, Jung JH, Kim B. Natural products for esophageal cancer therapy: from traditional medicine to modern drug discovery. Int J Mol Sci. 2022;23(21). - PMC - PubMed
    1. Sung H, Ferlay J, Siegel RL, et al. Global Cancer Statistics 2020: GLOBOCAN estimates of incidence and mortality worldwide for 36 cancers in 185 countries. CA Cancer J Clin. 2021;71(3):209‐249. - PubMed

MeSH terms