. 2024 Dec 17;15(1):10484.
doi: 10.1038/s41467-024-54852-4.

Imaging NRF2 activation in non-small cell lung cancer with positron emission tomography

Affiliations

Imaging NRF2 activation in non-small cell lung cancer with positron emission tomography

Hannah E Greenwood et al. Nat Commun. .

Abstract

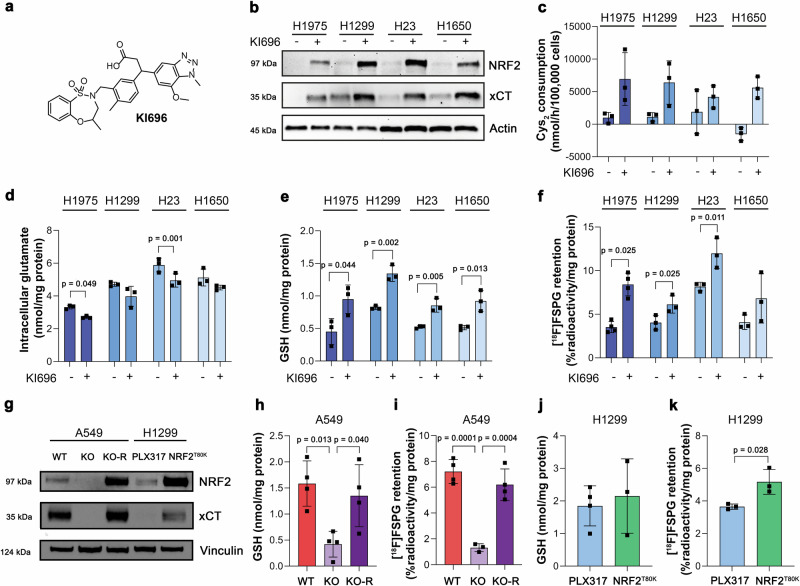
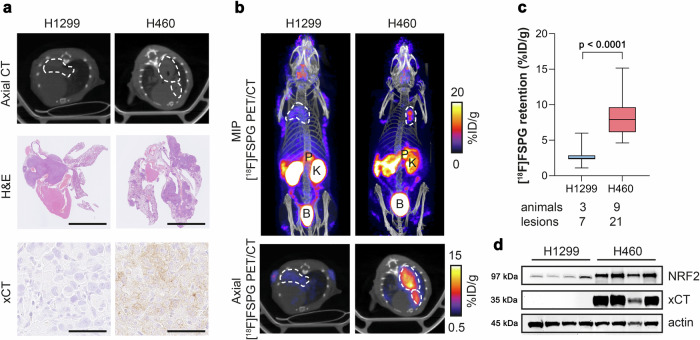
Mutations in the NRF2-KEAP1 pathway are common in non-small cell lung cancer (NSCLC) and confer broad-spectrum therapeutic resistance, leading to poor outcomes. Currently, there is no means to non-invasively identify NRF2 activation in living subjects. Here, we show that positron emission tomography imaging with the system xc- radiotracer, [18F]FSPG, provides a sensitive and specific marker of NRF2 activation in orthotopic, patient-derived, and genetically engineered mouse models of NSCLC. We found a NRF2-related gene expression signature in a large cohort of NSCLC patients, suggesting an opportunity to preselect patients prior to [18F]FSPG imaging. Furthermore, we reveal that system xc- is a metabolic vulnerability that can be therapeutically targeted with an antibody-drug conjugate for sustained tumour growth suppression. Overall, our results establish [18F]FSPG as a predictive marker of therapy resistance in NSCLC and provide the basis for the clinical evaluation of both imaging and therapeutic agents that target this important antioxidant pathway.


Conflict of interest statement

Competing interests: The authors declare no competing interests.

Figures

Fig. 1
Fig. 1. Elevated NRF2 increases xCT expression, system xc activity, and downstream antioxidant capacity, detectable by [18F]FSPG.
a Schematic of system xc with its natural substrates cystine and glutamate, and the radiotracer [18F]FSPG (structure shown in insert). b Protein expression of NRF2, xCT and NQO1 in a panel of NSCLC lines and corresponding KEAP1 mutations. Actin was used as a loading control. c Cystine consumption in NSCLC lines following media replenishment. Cys2, cystine. Intracellular glutamate (d) and GSH (e) in NSCLC lines. Flow cytometric measurement of total ROS levels using CellROX Green with representative histograms (f) and median fluorescent intensity (MFI; g) shown. h Intracellular retention of [18F]FSPG. i Correlation between intracellular GSH and intracellular [18F]FSPG accumulation. Broken lines represent the 95% confidence interval of the best-fit line. Data are presented as mean ± SD from n = 3 independent experiments. Comparisons were made across the mean of n = 4 cells per group (NRF2-high vs. NRF2-low) using an unpaired two-tailed Student’s t-test for (ce, gh). a created with BioRender.com released under a Creative Commons Attribution-NonCommercial-NoDerivs 4.0 International license, https://creativecommons.org/licenses/by-nc-nd/4.0/deed.en. For (be, gi), source data are provided as a Source Data file.
Fig. 2
Fig. 2. [18F]FSPG retention is altered following pharmacological and genetic manipulation of NRF2.
a Chemical structure of KI696. b Representative western blot of NRF2 and xCT expression in NRF2-low cell lines 24 h post treatment with vehicle control or 200 µM KI696. Actin was used as a loading control. cf Analysis of cystine (Cys2) consumption (c), intracellular glutamate (d) and intracellular GSH (e) in NRF2-low lines following KI696 treatment compared to vehicle control. f Intracellular [18F]FSPG retention in NRF2-low cells after KI696 treatment compared to vehicle control. g Representative western blot of NRF2 and xCT expression in NSCLC cells following genetic manipulation of NRF2. Intracellular GSH (h, j) and [18F]FSPG retention (i, k) in genetically modified NSCLC cells. Data are presented as mean ± SD from n = 3–4 independent experiments. Comparisons were made using an unpaired two-tailed Student’s t-test (de, jk), an unpaired one-tailed Student’s t-test (f), or a one-way ANOVA followed by correction for multiple comparisons via the Tukey method (hi). For (bk), source data are provided as a Source Data file.
Fig. 3
Fig. 3. [18F]FSPG PET can differentiate NRF2-high from NRF2-low tumours when grown orthotopically in the lungs of mice.
a Single slice CT axial images (top) and ex vivo H&E images (middle; scale bar = 5 mm) of lungs containing H1299 or H460 tumours, with xCT staining of corresponding tumours (bottom; scale bar = 50 µm). b Representative in vivo [18F]FSPG PET/CT maximum intensity projections (MIPs; top) and axial single-slice PET/CT (bottom) of mice bearing H1299 or H460 orthotopic lung tumours. Dashed lines represent the tumour outline. P pancreas, K kidney, B bladder. c Quantified [18F]FSPG retention in individual tumour lesions from orthotopic tumour-bearing mice. Comparison was made using an unpaired two-tailed Student’s t-test. n = 7-21 lesions from 3 to 9 mice per cohort. The median value (center line), lower quartile and upper quartile (box edges) and maximum and minimum value whiskers are indicated in the boxplot. d Representative western blot for xCT and NRF2 expression in H1299 and H460 orthotopically grown tumours from n = 4 mice per group. Actin was used as a loading control. For (c, d), source data are provided as a Source Data file.
Fig. 4
Fig. 4. [18F]FSPG retention is increased in Nrf2 mutant mice.
a Scheme depicting tumour formation in KP and KPN mice. KP mice conditionally express oncogenic Kras and have loss of p53 function. KPN mice conditionally express oncogenic Kras, have loss of p53 function and express a mutant Nrf2, which increases Nrf2 protein levels. b CT MIP representing individual 3D tumour regions of interest. c Total tumour volumes in the lungs of KP and KPN mice. Data are presented as mean ± SD from n = 5-6 mice. d Representative coronal [18F]FSPG PET/CT images of 40–60 min summed activity in KP and KPN tumour-bearing mice. Dashed white lines indicate the lung. B bladder, P pancreas. e Violin plots of [18F]FSPG tumour retention from individual lesions. Dashed lines represent the median and the upper and lower quartiles. n = 63–105 lesions from 5–6 mice per cohort. f Nrf2 expression in KP and KPN tumour lesions. Actin was used as a loading control. g Representative IHC staining of xCT from lesions taken from KP and KPN mice (scale bars = 20 μM). h H-scores for xCT IHC staining. Data are presented as mean ± SD from n = 10 mice. i Heatmap depicting the H-scores for xCT IHC staining by tumour grade. AAH adenomatous atypical hyperplasia, BH bronchiolar hyperplasia. All comparisons were made using an unpaired two-tailed Student’s t-test. a created with BioRender.com released under a Creative Commons Attribution-NonCommercial-NoDerivs 4.0 International license, https://creativecommons.org/licenses/by-nc-nd/4.0/deed.en. For (c, e, f, h), source data are provided as a Source Data file.
Fig. 5
Fig. 5. An antioxidant gene signature accompanies NRF2 mutations in patient tumours and patient derived xenograft (PDX) models, which is detectable by [18F]FSPG PET.
a Expression of NRF2-regulated genes in the TRACERx 421 patient cohort. b Representative [18F]FSPG MIP of mice bearing PDXs either with (CRUK0772 R1) or without (CRUK0640 R8) a NRF2 mutation. c Quantification of [18F]FSPG tumour retention. The median value (center line), lower quartile and upper quartile (box edges) and maximum and minimum value whiskers are indicated in the boxplot. Comparison was made using an unpaired two-tailed Student’s t-test. n = 9–11 mice. d, Post-imaging H&E-stained tissue sections and corresponding autoradiograms (ARG) from PDXs, illustrating the intratumoural heterogeneity of [18F]FSPG retention. Scale bar = 5 mm. e xCT and NRF2 protein expression in PDX xenografts (n = 4 regions per tumour type). Actin was used as a loading control. f GSH measurements from PDX tumours. Data are presented as mean ± SD from n = 4 mice. Comparison was made using an unpaired two-tailed Student’s t-test. For (a, c, e, f) source data are provided as a Source Data file.
Fig. 6
Fig. 6. [18F]FSPG can differentiate NRF2 activation status with high sensitivity and specificity.
ROC analysis of PET imaging data in orthotopic (a), GEMM (b) and PDX (c) tumours. Comparisons between the calculated AUC and AUC = 0.5 were computed from the z ratio using the equation z = (A-0.5)/SE, where A is the area under the curve, and SE is the standard error of the area. The P value was determined from the normal distribution (two-tail). The original source data is provided in the Source Data file for Figs. 3, 4 and 5.
Fig. 7
Fig. 7. HM30-tesirine controls tumour growth and prolongs survival of mice bearing subcutaneous H460 tumours.
a Structure of the anti-xCT tesirine conjugate, HM30-tesirine. b Western blot using HM30-tesirine as the primary antibody in H1299 and H460 cell lysates. Actin was used as a loading control. c HM30-tesirine MTT dose-response in H460 and H1299 cells. d Axial [18F]FSPG PET/CT images from mice bearing H460 or H1299 tumours before initiation of treatment. The dashed circle indicates the tumour. Antitumour activity (e) and survival benefit (f) of control (saline treated), cisplatin treated and HM30-tesirine treated mice bearing subcutaneous H460 tumours. n = 5-6 mice per cohort. The arrows under the x-axis of (e) represent treatment cycles for cisplatin (green) and HM30-tesirine (red), with tumour volumes measured using electronic callipers. g IHC for Ki67 and cleaved caspase 3 from FFPE tumours taken at endpoint. Scale bar = 50 µm. Corresponding quantification of tissue staining for Ki67 (h) and cleaved caspase 3 (i). Data in (h, i) are presented as the mean values ± SD from n = 3 mice. For (c, h, i), comparisons were made using an unpaired two-tailed Student’s t-test. For (e) comparisons were made on day 8 using a one-way ANOVA with followed by t-tests multiple comparison correction (Tukey method). For (f), statistics were analysed with a log-rank (Mantel–Cox) test. To control the family-wise error rate in multiple comparisons, crude p values were adjusted by the Holm–Bonferroni method. For (b, c, e, f, h, i) source data are provided as a Source Data file.

Update of

References

    1. Pillai, R., Hayashi, M., Zavitsanou, A. M. & Papagiannakopoulos, T. NRF2: KEAPing tumors protected. Cancer Discov.12, 625–643 (2022). - PMC - PubMed
    1. Tian, Y. et al. Emerging roles of Nrf2 signal in non-small cell lung cancer. J. Hematol. Oncol.9, 14 (2016). - PMC - PubMed
    1. Singh, A. et al. Dysfunctional KEAP1-NRF2 interaction in non-small-cell lung cancer. PLoS Med.3, e420–e420 (2006). - PMC - PubMed
    1. Taguchi, K., Motohashi, H. & Yamamoto, M. Molecular mechanisms of the Keap1–Nrf2 pathway in stress response and cancer evolution. Genes Cells16, 123–140 (2011). - PubMed
    1. Vomund, S., Schäfer, A., Parnham, M. J., Brüne, B. & von Knethen, A. Nrf2, the master regulator of anti-oxidative responses. Int. J. Mol. Sci.18, 2772 (2017). - PMC - PubMed

Publication types

MeSH terms

LinkOut - more resources