. 2024 Dec 17;15(1):10651.
doi: 10.1038/s41467-024-53548-z.

Brain change trajectories in healthy adults correlate with Alzheimer's related genetic variation and memory decline across life

Collaborators, Affiliations

Brain change trajectories in healthy adults correlate with Alzheimer's related genetic variation and memory decline across life

James M Roe et al. Nat Commun. .

Abstract

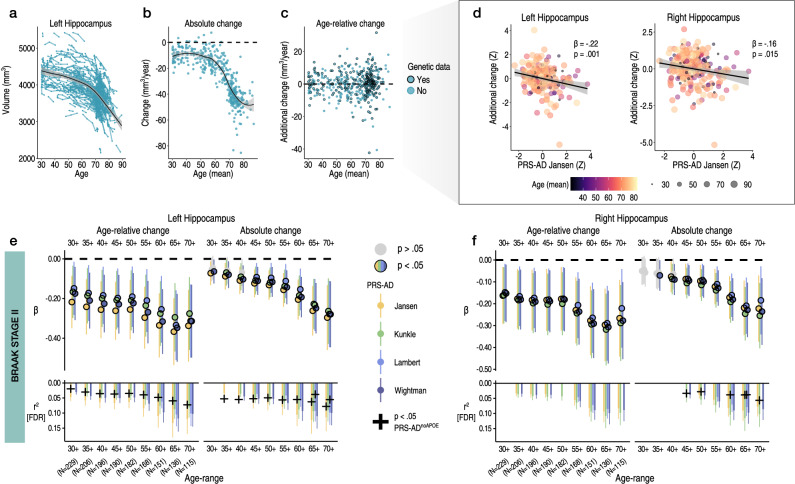
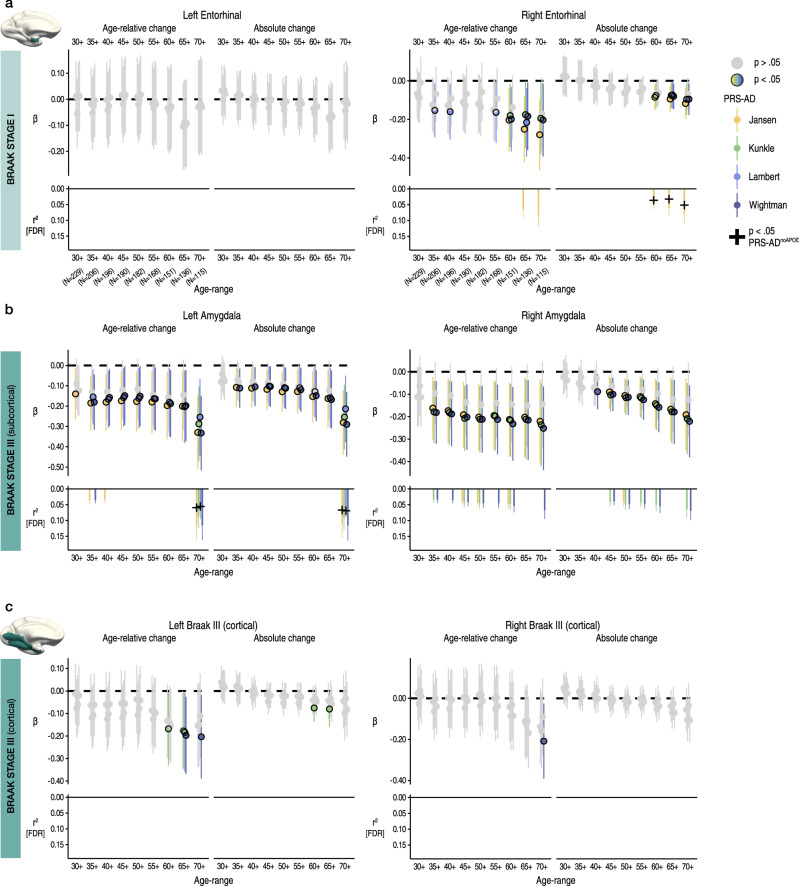
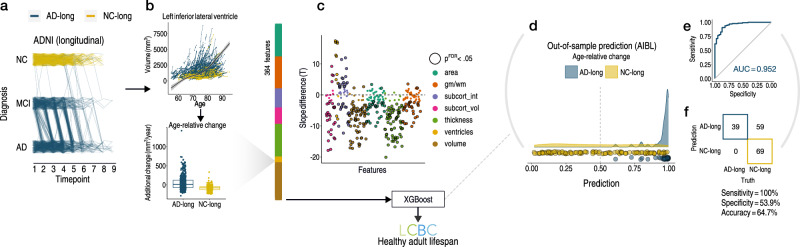
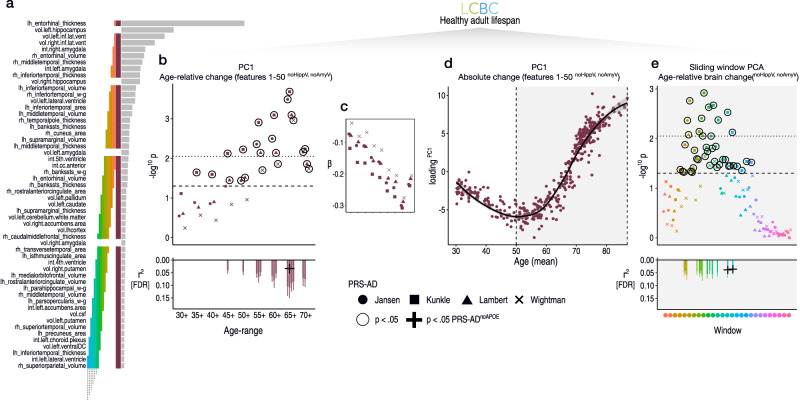
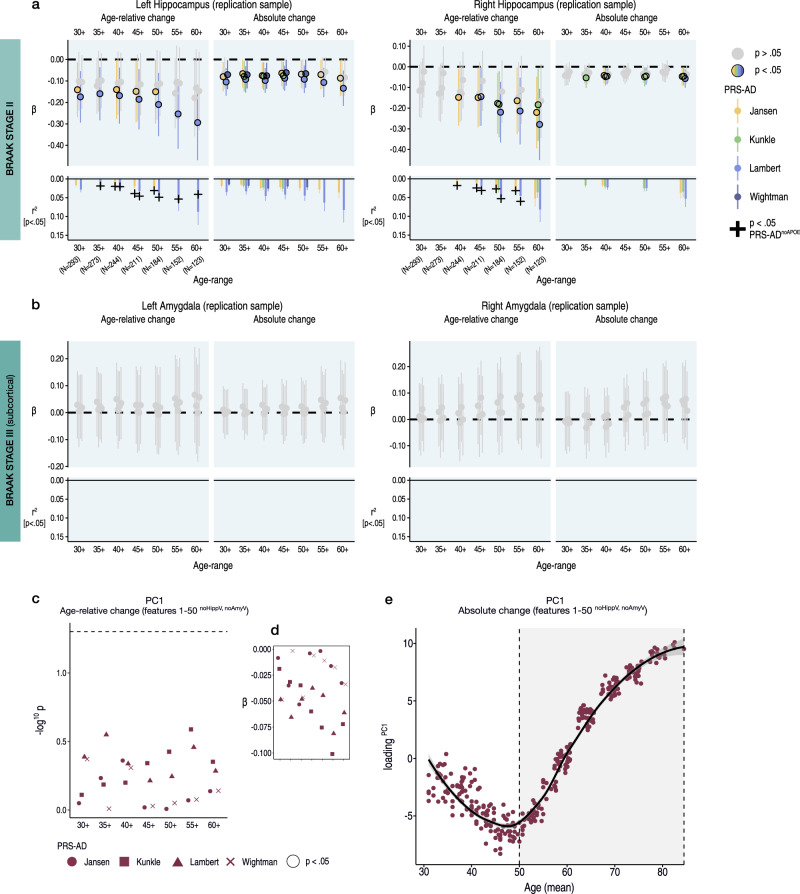
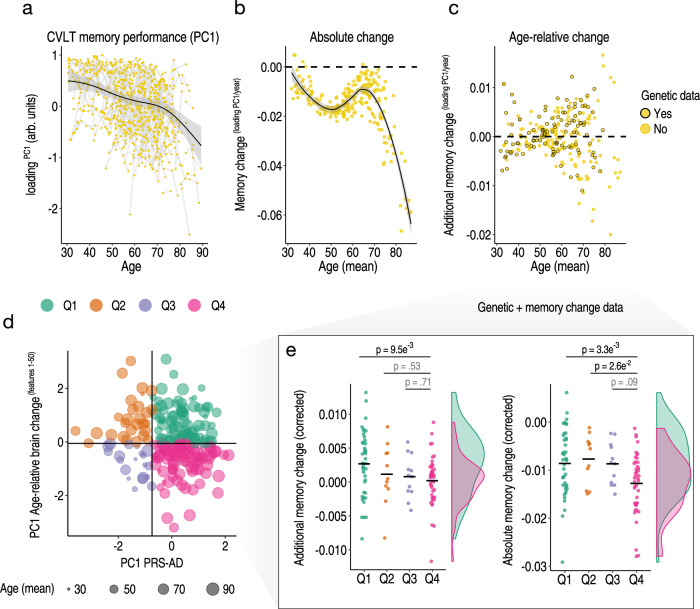
Throughout adulthood and ageing our brains undergo structural loss in an average pattern resembling faster atrophy in Alzheimer's disease (AD). Using a longitudinal adult lifespan sample (aged 30-89; 2-7 timepoints) and four polygenic scores for AD, we show that change in AD-sensitive brain features correlates with genetic AD-risk and memory decline in healthy adults. We first show genetic risk links with more brain loss than expected for age in early Braak regions, and find this extends beyond APOE genotype. Next, we run machine learning on AD-control data from the Alzheimer's Disease Neuroimaging Initiative using brain change trajectories conditioned on age, to identify AD-sensitive features and model their change in healthy adults. Genetic AD-risk linked with multivariate change across many AD-sensitive features, and we show most individuals over age ~50 are on an accelerated trajectory of brain loss in AD-sensitive regions. Finally, high genetic risk adults with elevated brain change showed more memory decline through adulthood, compared to high genetic risk adults with less brain change. Our findings suggest quantitative AD risk factors are detectable in healthy individuals, via a shared pattern of ageing- and AD-related neurodegeneration that occurs along a continuum and tracks memory decline through adulthood.


Conflict of interest statement

Competing interests: CAD is a consultant, board member, and stock owner in the analytical laboratory Vitas Ltd, Oslo, Norway. All other authors declare no competing interests.

Figures

Fig. 1
Fig. 1. Hippocampal change in healthy adults associates with genetic AD risk.
Longitudinal data was used to estimate individual-specific age-relative and absolute change in hippocampus (Braak Stage II), modelling the adult lifespan trajectories using GAMMs with random slopes. a Adult lifespan trajectory for left hippocampus from 30–89 years (data corrected for sex and scanner). b Estimated absolute change per individual (datapoints) in left hippocampus as a function of their mean age (across timepoints). This contextualizes change values in terms of an estimated loss. c Estimated age-relative change per individual in left hippocampus (individual-specific slopes) as a function of their mean age. Units are interpretable in terms of additional hippocampal volume loss per individual, above or below the mean level of loss expected for their age. Black stroke indicates whether or not genetic data was available per participant, and thus whether the datapoint was included in the PRS-AD association tests. d Linear models found more hippocampal loss than expected given age was associated with higher PRS-AD, on average across the full adult lifespan sample with genetic data (30–89 years; N = 229; association visualized for one score [Jansen]; colour and size depicts mean age). The association is shown for both the left and right hippocampus; however, note that across the full age-range only the left hippocampus survived FDR-correction, as depicted in panels (e, f). Models and datapoints are corrected for mean age and other covariates (Methods). e-f Linear PRS-AD associations with age-relative (left facet) and absolute change (right facet) in left (E) and right (F) hippocampus, using four GWAS-derived scores, tested for progressively older age-ranges to ensure capture of ageing-specific effects (i.e., moving from left to right on the X-axis, the leftmost age-range represents tests across the full adult lifespan [30–89 years; N = 229], whereas the rightmost age-range depicts associations tested in only the oldest adults [70–89 years]; standardized β). Significant associations at p < 0.05 (uncorrected) are depicted in colour (upper panels), with colours corresponding to the GWAS used to derive the four scores (Jansen, Kunkle, Lambert, Wightman). For associations surviving FDR-correction (p[FDR] < 0.05 applied across 576 two-sided tests), partial r2 of PRS-AD is shown (lower panels). Where the association survived correction, we retested it after removing APOE (PRS-ADnoAPOE). Partial r2 of PRS-ADnoAPOE is depicted by a black cross if the FDR-corrected association remained significant at p < 0.05. Trajectories depict mean measures. Error bands and error bars depict 95% CI. Summary-level source data are provided as a Source Data file.
Fig. 2
Fig. 2. Change in early Braak stage regions in healthy adults associates with genetic AD risk.
Linear PRS-AD associations with age-relative and absolute change in brain regions encompassed within (a) Braak Stage I (entorhinal) and (b-c) Braak Stage III regions (amygdala and inferior temporal cortical ROI), using the four GWAS-derived scores, tested for progressively older age-ranges to ensure capture of ageing-specific effects (i.e., moving from left to right on the X-axis, the leftmost age-range represents tests across the full adult lifespan [30–89 years; N = 229], whereas the rightmost age-range shows the associations tested in only the oldest adults [70–89 years]; standardized β). Significant associations at p < 0.05 [uncorrected] are depicted in colour (upper panels), with colours corresponding to the GWAS used to derive the four scores (Jansen, Kunkle, Lambert, Wightman). For associations surviving FDR-correction (p[FDR] < 0.05 applied across 576 two-sided tests), partial r2 of PRS-AD is shown (lower panels; lower panels in A [left] and C [left and right] are correctly empty because no association survived correction). Where the association survived correction, we retested it after removing APOE (PRS-ADnoAPOE). Partial r2 of PRS-ADnoAPOE is depicted by a black cross if the FDR-corrected association remained significant at p < 0.05. Error bars depict 95% CI. Summary-level source data are provided as a Source Data file.
Fig. 3
Fig. 3. Visualization of longitudinal AD analysis pipeline.
a Longitudinal grouping in ADNI data. X-axis shows the scan observations across timepoints in the sample. Each line represents a participant. Single-timepoint ADNI diagnoses (Y-axis; NC normal controls, MCI mild cognitive impairment, AD Alzheimer’s disease) were used to define two longitudinal groups of AD and NC individuals (AD-long; N = 606, obs = 2730; NC-long, N = 372; obs = 1680). NC-long individuals were classified as healthy at every timepoint whereas AD-long individuals were diagnosed with AD by their final timepoint (Methods). Single-timepoint MCI diagnoses were considered only for the purpose of defining the longitudinal AD group. Because the grouping used all diagnosis observations (i.e., not only scan observations), trajectories of AD-long individuals that appear to end with a NC or MCI diagnosis also correspond to individuals with an AD diagnosis by their final timepoint, as do those seemingly reverting. b GAMMs of Age (across groups; upper plot) were used to model age-relative change (individual-specific slopes) in 364 brain features, shown for one example feature (lower plot). The ADNI-derived slopes were then used as input to machine learning binary classification using XGBoost. c Most features exhibited significant group-differences in age-relative change as expected (datapoints depict t-statistics for t-tests); black stroke indicates significant differences after FDR-correction (p[FDR] < 0.05 applied across 364 two-sided tests). df Out-of-sample prediction for the binary classifier (AIBL data; Supplementary Fig. 8) including receiver operator curve (d), confusion matrix and performance metrics (e). The purpose of the classification procedure was to empirically derive brain features with accelerated change in AD, to use these in healthy adult lifespan data. Subcort subcortical, vol volume, int intensity, gm/wm grey/white matter contrast. Error bands depict 95% confidence intervals, while the boxplot displays the median as the measure of centre with the box spanning from the 25th to the 75th percentiles.
Fig. 4
Fig. 4. ADNI-derived features applied to the healthy adult lifespan.
a Top brain features for classifying AD-long from NC-long individuals in ADNI data based on age-relative change. Coloured bars indicate feature selections across which we calculated PC1, and link with the subsequent plotted data in (be). b Linear PRS-AD associations in the LCBC healthy adult lifespan sample using PC1 of age-relative change across the top 50 features with accelerated change in AD (excluding hippocampal and amygdala volumes); PC1relChange; maroon bar in (a). Datapoints show -log10 p-values for PRS-AD associations with PC1relChange, tested at progressively older age-ranges, for all four scores. Dashed line indicates p = 0.05, and black stroke depicts significant PRS-AD associations at p < 0.05 (uncorrected). Datapoints above the dotted line are significant at p(FDR) < 0.05. Datapoint symbol corresponds to the GWAS used to derive the four scores (Jansen, Kunkle, Lambert, Wightman). For associations surviving FDR-correction (across 144 two-sided tests), partial r2 of PRS-AD is shown (lower panel). Where the association survived correction, we retested it after removing APOE (PRS-ADnoAPOE). Partial r2 of PRS-ADnoAPOE is depicted by a black cross if the FDR-corrected association remained significant at p < 0.05. c Standardized PRS-AD betas in b as a function of age-range (inversed to be negative due to the non-directional nature of PCA). d PC1 of absolute change across the top 50 brain features with accelerated change in AD (excluding hippocampal and amygdala volumes); maroon bar in (a) as a function of mean age (across timepoints). Accelerated brain change in AD-accelerated features was evident between ages 50–60. Note that since the y-axis represents change, the slope of the curve represents acceleration (see also Supplementary Fig. 14). e Linear PRS-AD-change associations using a PCA-based sliding window analysis within the age-range 50–89 years. Colours and order correspond to the coloured bars in (a). Dashed line indicates p = 0.05, and datapoints with black stroke depict significant PRS-AD associations at p < 0.05 (uncorrected). Datapoints above the dotted line are significant at p(FDR) < 0.05. For associations surviving FDR-correction, partial r2 of PRS-AD is shown (lower panel). Error bands and error bars depict 95% CI. lh left hemisphere, rh right hemisphere, vol volume (subcortical), int intensity (subcortical), w–g grey/white matter contrast, cc corpus callosum, DC diencephalon, csf cerebrospinal fluid. Subcortical features (aseg atlas) are delineated with “.”, whereas cortical features (aparc atlas) are delineated with “_”. Summary-level source data are provided as a Source Data file.
Fig. 5
Fig. 5. Replication.
a-b Linear PRS-AD associations with age-relative and absolute brain change in an independent adult lifespan sample (Lifebrain replication sample), using the four GWAS-derived scores, tested for progressively older age-ranges to ensure capture of ageing-specific effects (i.e., moving from left to right on the X-axis, the leftmost age-range represents the association across the full adult lifespan on average [30–88 years; N = 293], whereas the rightmost age-range shows the associations tested in only the oldest adults [60–88 years]). Univariate linear associations were tested for (a) left and right hippocampus, and (b) left and right amygdala. Significant associations at p < 0.05 (uncorrected) are depicted in colour (upper panels), with colours corresponding to the GWAS used to derive the four scores (Jansen, Kunkle, Lambert, Wightman). For associations that were significant at p < 0.05 (uncorrected), partial r2 of PRS-AD is shown (lower panels). For these, we retested the association after removing APOE (PRS-ADnoAPOE). Partial r2 of PRS-ADnoAPOE is depicted by a black cross if the association remained significant at p < 0.05 (uncorrected). c Multivariate linear PRS-AD association tests using PC1 of age-relative change across the top 50 brain features with accelerated change in AD (excluding hippocampal and amygdala volumes; PC1relChange; as in Fig. 4a, b). Datapoints show −log10 p-values for the association with PC1relChange, tested at progressively older age-ranges, for all four scores. Datapoint symbol corresponds to the GWAS used to derive the four scores (Jansen, Kunkle, Lambert, Wightman). d Standardized Betas in c as a function of age-range (inversed to be negative due to the non-directional nature of PCA). Dashed line indicates p = 0.05. e PC1 of absolute change across the top 50 brain features with accelerated change in AD (excluding hippocampal and amygdala volumes; maroon bar in Fig. 4a), plotted as a function of mean age across timepoints. Accelerated brain change in AD-accelerated features was evident around age 50–60. Note that since the y-axis represents change, the slope of the curve represents acceleration (see also Supplementary Fig. 14). Error bands and error bars depict 95% CI. Summary-level source data are provided as a Source Data file.
Fig. 6
Fig. 6. Longitudinal memory change analyses.
Exclusively longitudinal data was used to estimate individual-specific age-relative and absolute change in CVLT task performance (PC1 across subtests), modelling the adult lifespan trajectories using GAMMs with random individual-specific slopes. a Adult lifespan trajectory analysis for CVLT memory performance from 30–89 years. Lines connect longitudinal observations. b Estimated absolute memory change per individual (datapoints) in CVLT task performance plotted as a function of their mean age (across timepoints). c Estimated age-relative change per individual in CVLT task performance (individual-specific slopes) as a function of mean age. For each participant with memory change data, black stroke indicates whether or not genetic data was available. d The linear association between the principal component across the four PRS-AD scores and the principal component of age-relative change across the first 50 ADNI-derived features (listed in Fig. 4a) was used to define four quadrant groups representing the conjunction of brain and genetic risk factors. e Memory change for individuals with both memory change and genetic data within the quadrant groups (colours in d-e depict groups). Linear models found that individuals with higher PRS-AD who also exhibited more age-relative brain change in AD-sensitive features (in pink) showed significantly more age-relative (left plot) and absolute (right plot) change in memory across the healthy adult lifespan, relative to high PRS-AD individuals estimated to show less relative brain change. These significant group differences survived FDR-correction for multiple comparisons (applied across six one-sided tests; Methods; two-sided p-values shown). The distributions are visualized for these two groups; datapoints corrected for covariates including mean age and APOE-ε4 carriership [Methods] (see also Supplementary Fig. 17). Error bands depict 95% CI. Summary-level source data are provided as a Source Data file.

References

    1. Sexton, C. E. et al. Accelerated changes in white matter microstructure during aging: a longitudinal diffusion tensor imaging study. J. Neurosci.34, 15425–15436 (2014). - PMC - PubMed
    1. Walhovd, K. B. et al. Genetic risk for Alzheimer disease predicts hippocampal volume through the human lifespan. Neurol. Genet.6, e506 (2020). - PMC - PubMed
    1. Vidal-Pineiro, D. et al. Cellular correlates of cortical thinning throughout the lifespan. Sci. Rep.10, 1–14 (2020). - PMC - PubMed
    1. Fjell, A. M., McEvoy, L., Holland, D., Dale, A. M. & Walhovd, K. B. What is normal in normal aging? Effects of aging, amyloid and Alzheimer’s disease on the cerebral cortex and the hippocampus. Prog. Neurobiol.117, 20–40 (2014). - PMC - PubMed
    1. Fjell, A. M., McEvoy, L., Holland, D., Dale, A. M. & Walhovd, K. B. Brain changes in older adults at very low risk for Alzheimer’s disease. J. Neurosci.33, 8237–8242 (2013). - PMC - PubMed

Publication types

MeSH terms

Substances