. 2025 Mar;39(3):684-693.
doi: 10.1038/s41375-024-02490-6. Epub 2024 Dec 17.

T-cell diversity and exclusion of blood-derived T-cells in the tumor microenvironment of classical Hodgkin Lymphoma

Affiliations

T-cell diversity and exclusion of blood-derived T-cells in the tumor microenvironment of classical Hodgkin Lymphoma

Nicole Seifert et al. Leukemia. 2025 Mar.

Abstract

The Tumor Microenvironment (TME) in classical Hodgkin Lymphoma (HL) contains abundant immune cells and only few neoplastic Hodgkin and Reed-Sternberg cells (HRSC). We analyzed the T-cell receptor (TCR) repertoire to detect T-cell expansion in the TME and blood. In contrast to solid cancer tissue, T-cells in the TME of HL are highly polyclonal at first diagnosis and show only minor clonal expansion during anti-PD1 immune checkpoint blockade (ICB). At relapse and during ICB, pre-amplified T-cell populations increase in the TME of solid cancers but to a much lesser extent in HL. In contrast, T-cell populations in the peripheral blood of HL patients display higher clonality than healthy controls reaching clonality levels comparable to solid cancer. However, pre-amplified blood T-cells in HL patients show only minor additional clonal expansion during ICB. Moreover, blood-derived T-cells do not repopulate the TME of HL to the same extent as observed in solid cancers. Thus, the T-cell repertoire in the TME of HL appears unique by a relatively low clonal T-cell content and the exclusion of clonally expanded T-cells from the peripheral blood. Exclusion of clonally expanded tumor-specific T-cells from the TME may present a novel mechanism of immune evasion in HL.


Conflict of interest statement

COMPETING INTERESTS: PB reports grants from BMS during the conduct of the study. No other disclosures were reported. PJB is an advisor or consultant for Merck Sharp & Dohme, Need Inc., Stemline, and Takeda; holds stock options in Need Inc., has received honoraria from BeiGene, BMS/Celgene, Merck Sharp & Dohme, Need Inc., Stemline and Takeda and reports research funding from BeiGene (Inst), BMS (Inst), Merck Sharp & Dohme (Inst) and Takeda (Inst); all outside the submitted work. WK reports grants from Roche, Amgen, Takeda, inCyte, and Regeneron paid to his institution not related to the submitted work. No other potential conflicts of interest are reported. TH received honoraria from Amgen, Astra Zeneca, Daiichi Sankyo, Exact Sciences, Gilead, Lilly, MSD, Novartis, Roche, Serag Wiessner, and travel support from Gilead. Ethics approval and consent to participate: All methods were performed in accordance with the relevant guidelines and regulations. Approval has been obtained from the ethics advisory committee of the Medical Faculty of the University of Kiel (D464/17). Informed consent was obtained from all participants of the NIVAHL trial.

Figures
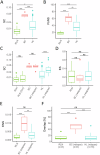
Fig. 1
Fig. 1. T-cell receptor (TCR) repertoire analysis in healthy tissue and in tumor microenvironments before and at relapse.
A Simpson’s Clonality (SC) in reactive lymph nodes (RLN, n = 8), treatment-naïve breast cancer (BC, n = 6), treatment-naïve Hodgkin Lymphoma (HL, n = 108). B Percentage of Non-Singletons (PoNS) in RLN, BC, and HL as shown in (A). C SC in paired biopsies of patients with RLN as shown in (A) and a subsequent biopsy (RLN 2nd, n = 8), of treatment-naïve BC and BC at relapse after surgery (n = 6), of treatment-naïve HL and HL at relapse (subset of HL as paired biopsies at relapse after chemotherapy, n = 18). D Clonal expansion of singletons (ES) between two biopsies of RLN, BC, and HL pairs shown in (B). E Clonal expansion of non-singletons (ENS) between two biopsies of RLN, BC, and HL pairs shown in (B). F Overlap of TCR sequences as percentage of TCR sequences with the same amino acid sequence in the treatment naive biopsy which were also detected in a follow-up biopsy of the same patient. Box and whiskers plots with median indicated as horizontal bar. ns not significant (p > 0.05), *p 0.05–0.01, **p < 0.01, ***p < 0.0001, ****p < 0.00001.
Fig. 2
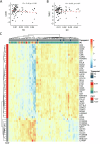
Fig. 2. Correlation of T-cell clonality with gene expression in the tumor microenvironment of HL.
Nanostring gene expression data previously published [8, 13]. A Correlation of CD30 expression with Simpson’s clonality (SC) in biopsies of treatment-naïve Hodgkin Lymphoma (HL, n = 87) and HL under ICB (subset of HL as paired biopsies under ICB, n = 4). B Correlation of TARC/CCL17 expression with SC in biopsies of treatment-naïve HL and HL under ICB as shown in (A). C Heatmap and two-dimension hierarchical clustering of gene expression levels in biopsies of treatment-naïve HL (T0) and HL under ICB (T1) as shown in (A), selected for the top 50 genes negatively (-corr) or positively correlated (+corr) with SC.
Fig. 3
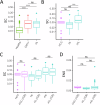
Fig. 3. T-cell receptor (TCR) repertoire analysis in healthy tissue and in tumor microenvironments before and during/after immune checkpoint blockade.
A Simpson’s Clonality (SC) in paired biopsies of patients with treatment naive hepatocellular carcinoma (HCC, (n = 14) and under immune checkpoint blockade (ICB, n = 14), and in biopsies of treatment-naïve Hodgkin Lymphoma (HL, (n = 90) and HL under ICB (subset of HL as paired biopsies under ICB, n = 4). B Clonal expansion of singletons (ES) between two biopsies of reactive lymph nodes (RLN, n = 8), and of HCC and HL pairs as shown in (A). C Clonal expansion of non-singletons (ENS) between two biopsies of RLN (n = 8), and of HCC and HL pairs as shown in (A). D Overlap of TCR sequences as percentage of TCR sequences with the same amino acid sequence in the treatment naive biopsy which were also detected in a follow-up biopsy of the same patient. Box and whiskers plots with median indicated as horizontal bar. ns not significant (p > 0.05), *p 0.05–0.01, **p < 0.01, ***p < 0.0001, ****p < 0.00001.
Fig. 4
Fig. 4. T-cell repertoire analysis in peripheral blood.
A Simpson’s Clonality (SC) in PBMC of Healthy = healthy donors (n = 68), CMV+ = Cytomegalyvirus infected individuals (n = 51), HL = treatment-naive Hodgkin Lymphoma specimens (n = 21). B SC in peripheral blood mononuclear cells (PBMC) of HCC = hepatocellular carcinoma (n = 14), HL = treatment-naïve HL (n = 21), rHL = relapsed/refractory HL (n = 51). C SC in PBMC of HCC = paired samples of patients with hepatocellular carcinoma before immune checkpoint blockade (ICB, n = 14) and HCC (ICB) = under ICB (n = 14), HL = treatment-naïve HL specimens (n = 21) and HL (ICB) = subset of HL as paired samples during ICB (at final restaging, n = 8), rHL = paired samples of relapsed/refractory HL before ICB (n = 51) and rHL (ICB) = during ICB (after 4x Nivolumab, n = 45). D Clonal expansion of non-singletons (ENS) in PBMC of HCC, HL, and rHL pairs shown in (C). Box and whiskers plots with median indicated as horizontal bar. ns not significant (p > 0.05), *p 0.05–0.01, **p < 0.01, ***p < 0.0001, ****p < 0.00001.
Fig. 5
Fig. 5. Overlap of T-cell receptor (TCR) sequences in the tumor microenvironment and the peripheral blood and T-cell receptor repertoire analysis of sorted cells in the peripheral blood.
A Overlap of TCR amino acid sequences in paired samples of tumor microenvironment (TME) and peripheral blood mononuclear cells (PBMC) of treatment naive patients with hepatocellular carcinoma (HCC) and Hodgkin Lymphoma (HL) and of patients during/after immune checkpoint blockade (ICB). Overlap of TCR sequences as percentage of TCR sequences with the same amino acid sequence in the TME which were also detected in the peripheral blood of the same patient. B SC in PBMC and sorted CD4+ or CD8+ T-cell populations in patients enrolled in the NIVAHL trial 13T0 = treatment-naïve HL at diagnosis (PBMC n = 10, CD4+ n = 5, CD8+ n = 4), T1 = early on-treament, 1–2 weeks after start of treatment (PBMC n = 6, CD4+ n = 7, CD8+ n = 7), T2 = 1st restaging, after 2x Nivolumab-AVD or 4x Nivolumab (PBMC n = 8), T3 = at final restaging (PBMC n = 8, CD4+ n = 6, CD8+ n = 5). C Clonal expansion of non-singletons (ENS) in sorted CD4+ or CD8+ T-cell populations of HL and relapsed/refractory HL pairs. Box and whiskers plots with median indicated as horizontal bar. ns not significant (p > 0.05), *p 0.05–0.01, **p < 0.01, ***p < 0.0001, ****p < 0.00001.

References

    1. Jachimowicz RD, Pieper L, Reinke S, Gontarewicz A, Plütschow A, Haverkamp H, et al. Analysis of the tumor microenvironment by whole-slide image analysis identifies low B cell content as a predictor of adverse outcome in advanced-stage classical Hodgkin lymphoma treated with BEACOPP. Haematologica. 2021;106:1684–92. - PMC - PubMed
    1. Ma Y, Visser L, Roelofsen H, de Vries M, Diepstra A, van Imhoff G, et al. Proteomics analysis of Hodgkin lymphoma: identification of new players involved in the cross-talk between HRS cells and infiltrating lymphocytes. Blood. 2008;111:2339–46. - PubMed
    1. Kim RD, Chung V, Alese OB, El-Rayes BF, Li D, Al-Toubah TE, et al. A phase 2 multi-institutional study of nivolumab for patients with advanced refractory biliary tract cancer. JAMA Oncol. 2020;6:888–94. - PMC - PubMed
    1. Ansell SM, Bröckelmann PJ, von Keudell G, Lee HJ, Santoro A, Zinzani PL, et al. Nivolumab for relapsed/refractory classical Hodgkin lymphoma: 5-year survival from the pivotal phase 2 CheckMate 205 study. Blood Adv. 2023;7:6266–74. - PMC - PubMed
    1. Allen PB, Savas H, Evens AM, Advani RH, Palmer B, Pro B, et al. Pembrolizumab followed by AVD in untreated early unfavorable and advanced-stage classical Hodgkin lymphoma. Blood. 2021;137:1318–26. - PMC - PubMed

Substances

LinkOut - more resources