. 2025 Feb;44(3):705-735.
doi: 10.1038/s44318-024-00336-6. Epub 2024 Dec 17.

Molecular mechanism targeting condensin for chromosome condensation

Affiliations

Molecular mechanism targeting condensin for chromosome condensation

Menglu Wang et al. EMBO J. 2025 Feb.

Abstract

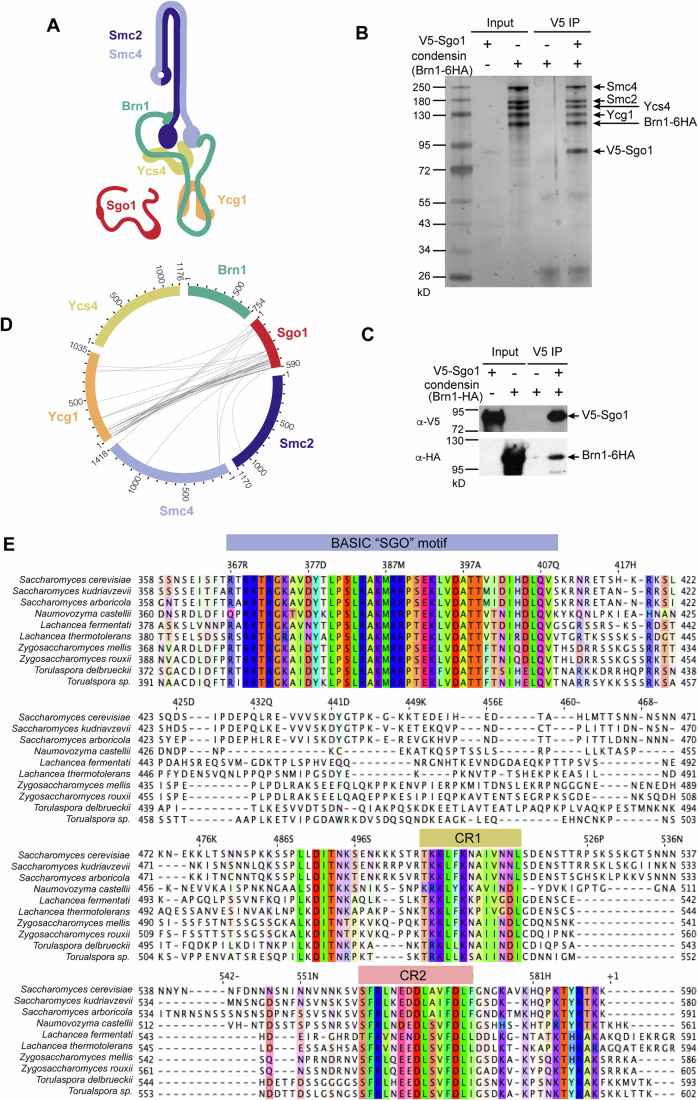
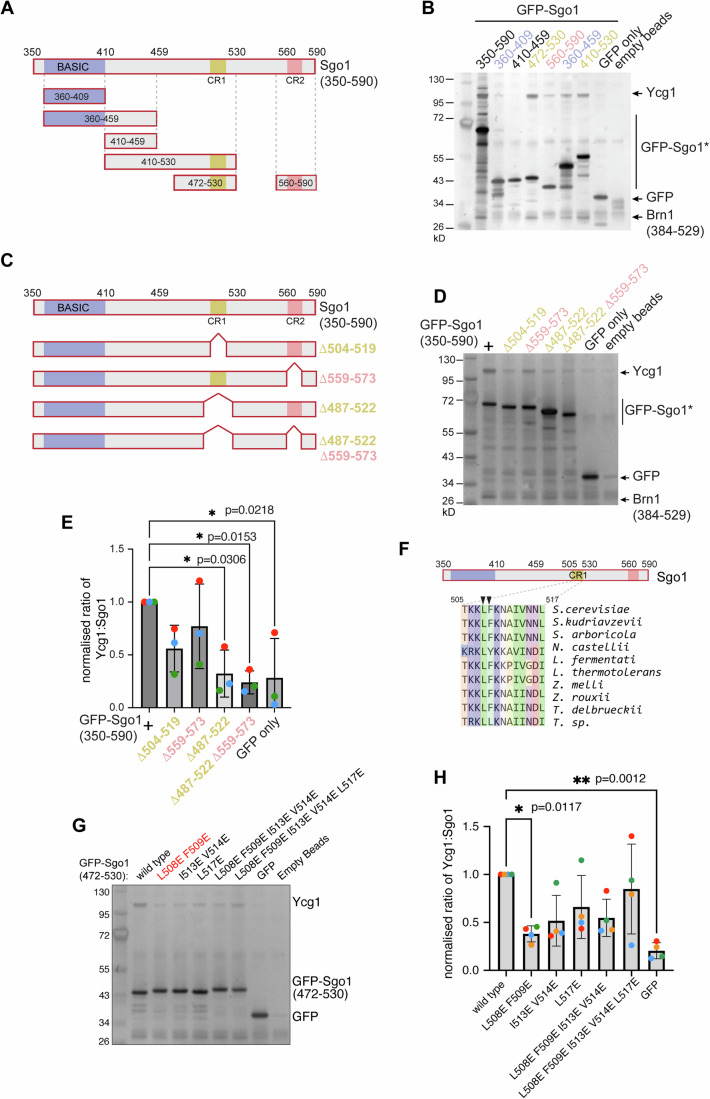
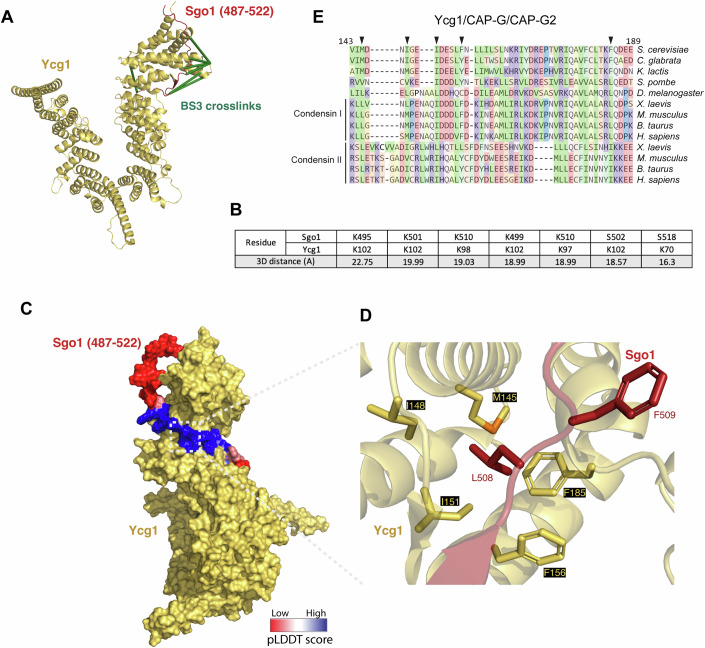
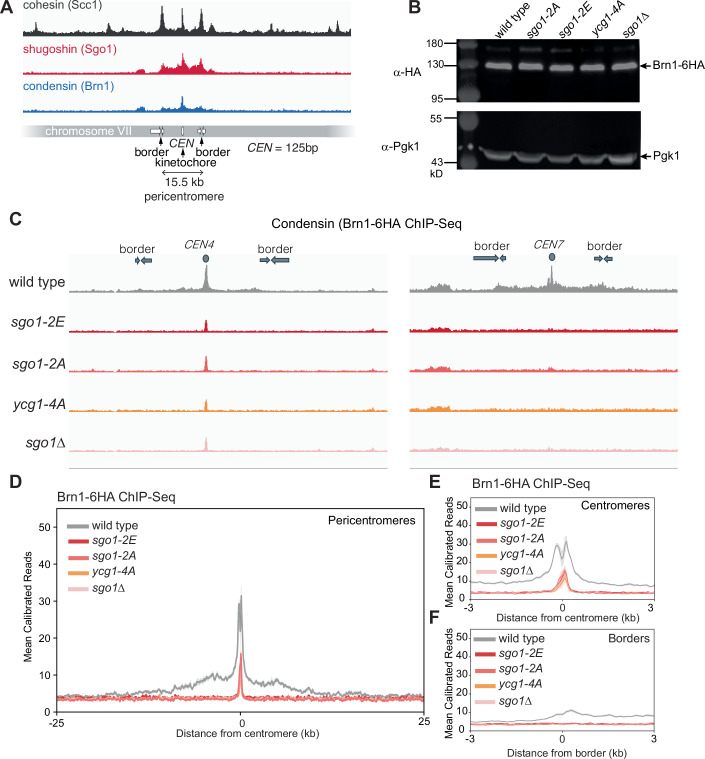
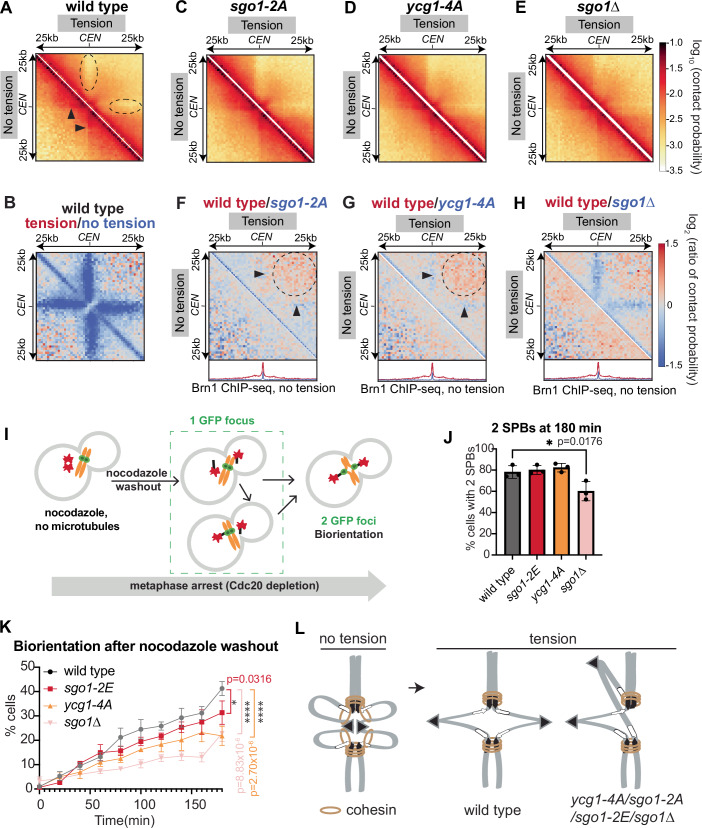
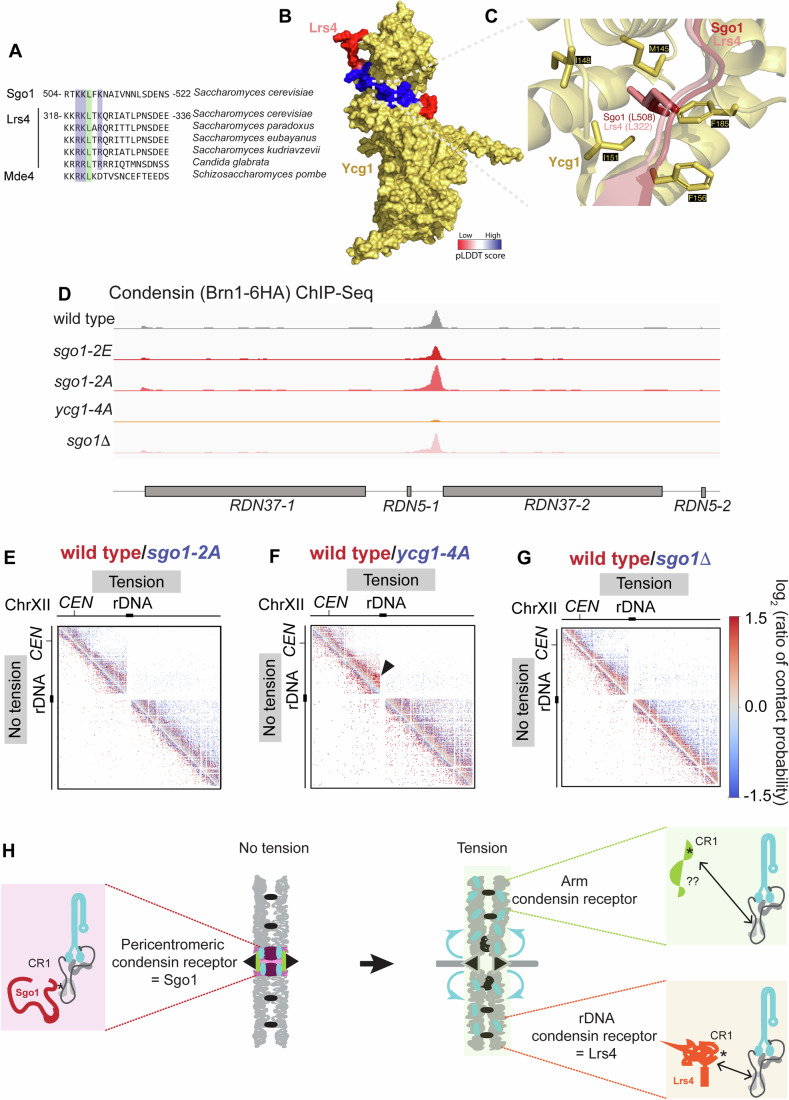
Genomes are organised into DNA loops by the Structural Maintenance of Chromosomes (SMC) proteins. SMCs establish functional chromosomal sub-domains for DNA repair, gene expression and chromosome segregation, but how SMC activity is specifically targeted is unclear. Here, we define the molecular mechanism targeting the condensin SMC complex to specific chromosomal regions in budding yeast. A conserved pocket on the condensin HAWK subunit Ycg1 binds to chromosomal receptors carrying a related motif, CR1. In early mitosis, CR1 motifs in receptors Sgo1 and Lrs4 recruit condensin to pericentromeres and rDNA, to facilitate sister kinetochore biorientation and rDNA condensation, respectively. We additionally find that chromosome arm condensation begins as sister kinetochores come under tension, in a manner dependent on the Ycg1 pocket. We propose that multiple CR1-containing proteins recruit condensin to chromosomes and identify several additional candidates based on their sequence. Overall, we uncover the molecular mechanism that targets condensin to functionalise chromosomal domains to achieve accurate chromosome segregation during mitosis.

Keywords: Condensin; Lrs4; Pericentromeres; Shugoshin; rDNA.


Conflict of interest statement

Disclosure and competing interests statement. The authors declare no competing interests.

Figures

Figure 1
Figure 1. Identification of a condensin binding motif in Sgo1.
(A) Schematic representation of Saccharomyces cerevisiae condensin complex and Sgo1. (B, C) Recombinant Sc Sgo1 co-immunoprecipitated with Sc condensin complex using anti-V5-coupled beads. Immunoprecipitates were analyzed by silver-stained SDS-PAGE (B) and immunoblotted with the indicated antibodies (C). Performed once as shown. (D) Crosslinking mass spectrometry of full-length Sc Sgo1 and Sc condensin holo-complex using crosslinker BS3. Intra-subunit condensin interactions and self-links were hidden, and only crosslinks with scores >10.5 are shown. (E) Sequence alignment of C-terminal region of Sgo1 among related yeast. The basic motif involved in histone binding is highlighted in blue. Two further conserved regions are highlighted in yellow (CR1) and pink (CR2). Source data are available online for this figure.
Figure 2
Figure 2. A conserved region within the C-terminal region of Sgo1 is required for Ycg1 binding.
(A, B) Recombinant GFP-tagged C-Sgo1 variants co-immunoprecipitated with Ycg1 (6–932, Δ499–555)-Brn1 (384–529) using anti-GFP-coupled beads. Scheme showing the recombinant Sgo1 C-terminal variants generated (A). The basic motif involved in Sgo1 chromosome localization is highlighted in blue. Two conserved regions found by alignment of yeast sequences are indicated in yellow (CR1) and pink (CR2). Immunoprecipitates were analyzed by silver-stained SDS-PAGE (B). Performed once as shown. (CE) Recombinant GFP-tagged C-Sgo1 deletion mutants co-immunoprecipitated with Ycg1 (6–932, Δ499–555)-Brn1 (384–529) using anti-GFP-coupled beads. Schematic diagram of the Sgo1 recombinant C-terminal deletion mutants used in the co-immunoprecipitation assay (C). Analysis of immunoprecipitates by silver-stained SDS-PAGE (D). The ratios of Ycg1/Sgo1 gel bands intensity were calculated and the mean level from three experimental repeats with error bars representing standard deviation are shown after normalization to wild type (E). *p < 0.0332. In one-way ordinary ANOVA with Dunnett's correction, only comparisons significantly different from wild type are indicated. (F) Alignment of sequences from related yeast species showing the short conserved region 1 (CR1) on Sgo1. Arrowheads highlight L508 F509, mutation of these two residues showed the strongest effect in (G, H). G, H Recombinant Sgo1 (472-530) point mutants co-immunoprecipitated with Ycg1 (6–932, Δ499–555)-Brn1 (384–529), the elutes were analyzed by silver stain (G) and the mean of Ycg1/Sgo1 gel bands intensity ratio from four experimental repeats is shown after normalization to wild type (H). Error bars represent standard deviation. *p < 0.0332; **p < 0.0021, one-way ordinary ANOVA with Dunnett's correction, only comparisons significantly different from wild type are indicated. Source data are available online for this figure.
Figure 3
Figure 3. Identification of a conserved binding pocket in condensin subunit Ycg1.
(A) Mapping of crosslinks from CLMS of full-length Sgo1 and condensin holo-complex data shown in Fig. 1D onto AlphaFold2 model. (B) Distances between crosslinked residues on the AlphaFold2 model within the range of the BS3 crosslinker (25 Å). (C, D) AlphaFold2 model of Sgo1(487–522) with Ycg1 (6–932, Δ499–555)-Brn1 (384–529), Sgo1 peptide (487–522) is colored with pLDDT confidence score (C High in blue: pLDDT >70; Low in red: pLDDT <50) and with zoom (D) to show the detailed interaction surface between Sgo1 and Ycg1. (E) Conservation of the Ycg1/CAP-G binding pocket. Mutated residues are indicated with arrowheads.
Figure 4
Figure 4. Sgo1-CR1 binding to Ycg1 occurs through the conserved pocket in vivo.
(A) Scheme showing the endogenous SGO1 and YCG1 point mutants generated. (BF) Sgo1-6His-3FLAG was immunoprecipitated from mitotically-arrested cells (by benomyl treatment) and the immunoprecipitates were analysed by mass spectrometry. Volcano plots showing the relative enrichment of proteins immunoprecipitated with wild type vs no tag (B), sgo1-2A vs wild type (C), sgo1-2E vs wild type (D), and ycg1-4A vs wild type (E). −log10 (p values) are plotted against log2 (fold changes). Dotted line indicates log2 (fold change) = |2|. The dashed line indicates p value = 0.05. Protein-wise linear models and empirical Bayes statistics were used for the differential enrichment analysis. (F) Abundance of condensin subunits in Sgo1-FLAG IP-MS. Data represents values from five biological replicates. Plots show intensity values scaled to the mean of all conditions on a log2 scale and, therefore, represent relative rather than absolute comparisons. Error bars represent 95% confidence intervals. Strains used in IP-MS: no tag (AM1176), wild type (AM23137), sgo1-2A (AM33043), sgo1-2E(AM33044), and ycg1-4A (AM33030).
Figure 5
Figure 5. Condensin binding pocket engages with Sgo1-CR1 for enrichment at pericentromeres.
(A) Calibrated cohesin (Scc1-6HA), shugoshin (Sgo1-6His-3FLAG), and condensin (Brn1-6HA) ChIP-Seq enrichment in metaphase-arrested cells in the presence of nocodazole along chromosome VII. (B) Anti-HA immunoblot showing Brn1 is expressed in a similar level in all strains. Anti-Pgk1 immunoblot is shown as a loading control. (CF) Calibrated condensin (Brn1-6HA) ChIP-Seq of cells arrested in metaphase by treatment with nocodazole. Condensin enrichment along representative sections of chromosome IV and chromosome VII (C), including pericentromeres are shown. Pile-ups show the mean ChIP-Seq reads (solid line) with standard error (shading) at 16 pericentromeres (D) or zoomed-in centromeres (E) and 32 borders (F). Strains used in calibrated condensin (Brn1-6HA) ChIP-Seq: S. cerevisiae: wild type (AM32740), sgo1-2E (AM33140), sgo1-2A(AM33145), ycg1-4A (AM33265), sgo1∆ (AM8834). S. pombe for calibration: AMsp635. Source data are available online for this figure.
Figure 6
Figure 6. Sgo1 biases sister kinetochores to biorient by condensin recruitment.
(AH) Hi-C of metaphase-arrested cells. In (A) and (CH), the lower left shows a contact map of cells in the absence of spindle tension, upper right shows with tension. A, C-E share the same scale bar (beside E), B, FH share the same scale bar (beside H). (A) Pile-ups (bin size 1 kb) of Hi-C cis contacts 25 kb surrounding all 16 centromeres for wild type. Scale indicates −log10 (contact probability) with dark orange corresponding to the highest probability (0.1) and pale yellow corresponding to the lowest contact probability (0.0003). Arrowheads indicate the stripes of pericentromeric loops on either side of the centromere in no tension cells; dashed ovals show a reduction of interactions between the pericentromere and the adjacent arm on the same side of the centromere in cells with tension. (B) Hi-C log2 ratio maps between tension (red) and no tension (blue) metaphase-arrested wild-type cells. The ratio of contact probability is shown on a log2 scale, with red indicating more frequent contacts in cells with tension and blue indicating more frequent contacts in no-tension cells. (CE) Centromere pileups for sgo1-2A (C), ycg1-4A (D), and sgo1Δ (E) as in (A). (FH) Hi-C log2 ratio maps between wild type (red) and mutants (blue) without (lower left) or with tension (upper right). Red means more frequent contacts in wild type and blue indicates more contacts in the mutant. The blue stripes (arrowheads) indicate stronger pericentromere-adjacent arm contacts in the mutant; dashed circles highlight contacts between the left and right side of the centromere within the 25 kb range in cells with tension. The corresponding condensin (Brn1-6HA) calibrated ChIP-Seq pileups are shown on the bottom (wild type in red, mutants in blue). Strains used in Hi-C: wild type (AM33174), sgo1-2A(AM33142), ycg1-4A (AM33171), and sgo1∆ (AM33592). (I) Schematic diagram showing the biorientation assay. Wild type, sgo1-2E, ycg1-4A, and sgo1Δ cells carrying CEN4-GFP (green) and SPB (SPC42-tdTomato, red) markers were released from a G1 arrest into nocodazole, and arrested in metaphase by Cdc20 depletion. After 3 h, nocodazole was washed out (t = 0) and CEN4-GFP separation was scored every 20 min for 3 h. (J) Bar chart showing the percentage of cells with two SPB dots at the last timepoint (180 min). Bar chart shows mean with error bars representing the standard deviation. *p < 0.0332, one-way ordinary ANOVA with Dunnett's correction, only comparisons significantly different from wild type are indicated, n = 100–200. (K) The percentage of separated CEN4-GFP foci across the time-course are shown. Error bars represent the standard error of the mean. p values refer to analysis of the last time point, *p < 0.0332, ****p < 0.0001, two-way ANOVA, with Tukey correction, only comparisons significantly different from wild type are indicated. Typically, 200 cells (at least 100 cells) were scored for each timepoint. Strains used in the biorientation assay: wild type (AM33464), sgo1-2E(AM33466), ycg1-4A (AM33167), sgo1∆ (AM6117). (L) Model showing the effects of impaired sister kinetochore biorientation on pericentromere structure in the ycg1-4A/sgo1-2A/sgo1-2E/sgo1Δ cells. Source data are available online for this figure.
Figure 7
Figure 7. Sgo1 initiates chromosome arm condensation in metaphase.
(A) Hi-C log2 ratio maps between tension (red) and no tension (blue) metaphase-arrested wild-type cells. The ratio map is made from the pileups (bin size 1 kb) of cis contacts 100 kb surrounding all 16 centromeres. The ratio of contact probability is shown on a log2 scale, with red indicating more frequent contacts in cells with tension and blue indicating more contacts without tension. Dashed ovals indicate an increase in mid-range (10–100 kb) arm contacts in wild-type cells with tension, compared to without tension. The model on the right shows chromosome arm condensation in metaphase in wild-type cells with tension. (BD) Hi-C log2 ratio maps between wild type (red) and mutants (blue) along chromosome arms. The lower left triangle of the heatmap shows metaphase-arrested cells without spindle tension and upper right shows cells with tension. They share the same scale bar (besides D). Red indicates more frequent contacts in the wild type and blue means more frequent contacts in the mutants. The reduction of mid-range contacts in ycg1-4A (C) and sgo1∆ (D) cells with tension is highlighted with dashed ovals. Solid line ovals indicate a reduction in contacts in sgo1∆ without tension (D). (EH) P(s) curve for metaphase-arrested cells without spindle tension (black) and with tension (gray) averaged over all chromosomes. Arrowheads show that the mid-range contacts increase in the presence of tension in wildtype and sgo1-2A cells (chromosome arm condensation in metaphase in the presence of tension), but not in ycg1-4A and sgo1∆ cells (No arm condensation). Strains used in Hi-C: wild type (AM33174), sgo1-2A(AM33142), ycg1-4A (AM33171), and sgo1∆ (AM33592). Source data are available online for this figure.
Figure 8
Figure 8. General principles of condensin targeting.
(A) A CR1-like motif is found in the monopolin protein Lrs4/Mde4. (B) AlphaFold2 model of Ycg1 (yellow) with Lrs4 colored with pLDDT confidence score (High in blue: pLDDT >70; Low in red: pLDDT <50). (C) The detailed interaction surface, Lrs4 (pink) aligns with Sgo1 (red), sticks highlight the hydrophobic binding pocket. (D) Calibrated condensin (Brn1-6HA) ChIP-Seq of nocodazole arrested cells at the rDNA region. Strains used: S. cerevisiae: wild type (AM32740), sgo1-2E (AM33140), sgo1-2A(AM33145), ycg1-4A (AM33265), sgo1∆ (AM8834). S. pombe for calibration: AMsp635. (EG) Hi-C log2 ratio maps between wild type (red) and mutants (blue) along Chromosome XII. Cells are metaphase-arrested in the absence (lower left) and in the presence (upper right) of tension. They share the same scale bar (beside G). Red means more frequent contacts in the wildtype and blue means more frequent contacts in the mutant. The reduction of rDNA condensation in ycg1-4A mutants under tension is highlighted with an arrowhead (upper right of F). Strains used in Hi-C: wild type (AM33174), sgo1-2A(AM33142), ycg1-4A (AM33171), and sgo1∆ (AM33592). (H) Model showing general principles of condensin targeting in mitosis. In the absence of spindle tension, Sgo1 recruits condensin to pericentromeres. Once tension is generated, Lrs4 brings condensin to the rDNA, and a third unknown receptor recruits condensin to chromosome arms. They are all regulated through direct binding between receptor CR1 motif and a conserved binding pocket of HAWK subunit Ycg1.
Figure EV1
Figure EV1. Analysis of Sgo1-condensin complexes.
(A) Size exclusion chromatography (SEC) profiles and corresponding silver-stained SDS-PAGE gels and immunoblot using the indicated antibodies for the analysis of full-length Sgo1 (red) and condensin (yellow) complex formation (blue). Note that Sgo1 alone could not readily be detected in this assay as it associates non-specifically with the column in the absence of condensin. The arrowhead indicates the peak of Sgo1-condensin complex. (B) Crosslinking mass spectrometry of full-length Sgo1 with condensin data mapped onto reported condensin cryo-EM structure (PDB 6YVU (Lee et al, 2020)) and part Ycg1-Brn1 crystal structure which is a dimer (PDB 5OQQ (Kschonsak et al, 2017)). Self-links are hidden and only crosslinks with score >10.5 are shown. (C) Purified GFP-tagged recombinant Sgo1 variants co-immunoprecipitated with condensin (Brn1-6HA) from sgo1Δ yeast extract (sgo1Δ yeast strains: no tag (AM827), Brn1-6HA (AM8834)). Elutes were analysed by immunoblot with the indicated antibodies. Source data are available online for this figure.
Figure EV2
Figure EV2. Sgo1 C-terminal region binds directly to Ycg1.
(A) V5 IP: Recombinant C-terminal region of Sgo1 (350–590) co-immunoprecipitated with condensin (Brn1-6HA) using V5-coupled beads. HA IP: Recombinant condensin (Brn1-6HA) immunoprecipitated with V5-Sgo1 (350–590). Note Sgo1(350–590) bound non-specifically to anti-HA beads. Eluates were analyzed by silver-stained SDS-PAGE. (B) SEC profiles and corresponding SDS-PAGE for the analysis of interactions (blue) between Sgo1 (350–590) (red) and Ycg1 (6–932, Δ499–555)-Brn1 (384–529) (yellow). Non-relevant lanes have been removed for clarity, as indicated by vertical separation lines. Full gel images are provided in the source data. (C) V5 tagged recombinant C-terminal region of Sgo1 (350–590) co-immunoprecipitated with Ycg1 (6–932, Δ499–555)-Brn1 (384–529). Eluates were analyzed by silver-stained SDS-PAGE. Asterisk indicates impurity, FT is flow through. (D) BS3 crosslinking mass spectrometry of Sgo1 (350–590) and Ycg1 (6–932, Δ499–555)-Brn1 (384–529). The interactions with Brn1 and self-links are hidden. Crosslinks with score >10.5 are chosen. Asterisk highlights Sgo1 residues (L508, F509) predicted to bind Ycg1. (E) Crosslinking mass spectrometry of Sgo1 (350–590) and Ycg1 (6–932, Δ499–555)-Brn1 (384–529) mapped onto Ycg1-short Brn1 crystal structure which is a dimer (PDB 5OQQ (Kschonsak et al, 2017)). Only crosslinks with score >10.5 were shown. Source data are available online for this figure.
Figure EV3
Figure EV3. Agreement of the AlphaFold model with CLMS data.
(A) Predicted aligned error (PAE) matrices of AlphaFold2 model_Rank 5 obtained from the Sgo1(487–522) with Ycg1 (6–932, Δ499–555)-Brn1 (384–529) prediction. (B) pLDDT plot of all 5 AlphaFold2 models. (C) Table showing the pLDDT confidence scores of Sgo1 residues L508 and F509 for all five AlphaFold2 models. (D, E) Crosslinking mass spectrometry data of Sgo1 (350–590) and Ycg1 (6–932, Δ499–555)-Brn1 (384–529) with crosslinker BS3 (D) and EDC (E) mapped onto the AlphaFold2 model. (F) DNA was docked onto the AlphaFold2 model by aligning with the reported crystal structure (PDB 5OQP (Kschonsak et al, 2017)). Sgo1 peptide (487–522) is colored with pLDDT score (blue indicates pLDDT >70, red means pLDDT <50). Sgo1 L508, F509 residues are highlighted in the dashed box. (G) Conservation of the Ycg1 binding pocket in related yeast.
Figure EV4
Figure EV4. Sgo1 enrichment along pericentromeres.
(A) Anti-FLAG western blotting confirms that Sgo1 is produced at a similar level in all strains. Anti-Pgk1 immunoblot is shown as a loading control. (BD) Calibrated Sgo1-6His-3FLAG ChIP-Seq using cells arrested in metaphase by treatment with nocodazole. The pileup of pericentromeric region of all 16 chromosomes (B). Zoomed-in pileups of a 6 kb region surrounding 16 centromeres (C) or 32 pericentromeric borders (D). Strains used in calibrated Sgo1-6His-3FLAG ChIP-Seq: S. cerevisiae: wild type (AM32740), sgo1-2E (AM33140), sgo1-2A(AM33145), ycg1-4A (AM33265). S. pombe used for calibration: AMsp1863. Source data are available online for this figure.
Figure EV5
Figure EV5. Identification of CR1-like motifs in other potential Ycg1/CAP-G ligands.
(A) Mutation of the Ycg1 binding pocket reduces colony size to a greater extent than mutation of the Sgo1-CR1. Cells were plated onto a rich medium before (0 h) or after the addition of nocodazole (4 h). Strains used: wild type (AM23137), sgo1-2E (AM33044), ycg1-5A (AM33315), and sgo1∆ (AM827). (B) Scheme showing the endogenous point mutants generated at the CR1 motif of monopolin protein Lrs4. (C) Anti-HA immunoblot showing Brn1 is produced at a similar level in all strains. Anti-Pgk1 immunoblot is shown as a loading control. (D, E) Calibrated condensin (Brn1-6HA) ChIP-Seq of nocodazole arrested cells at rDNA region. Condensin (Brn1-6HA) enrichment peaks are indicated with arrowheads. S. pombe strain AMsp635 was used for calibration. (D) FLAG-tagged Lrs4 strains were used: wild type (AM33965), lrs4-L322E (AM33967), lrs4-L322A (AM33966), lrs4∆ (AM9766). (E) Untagged Lrs4 strains were used: wild type-1 (AM5708), wild type-2 (AM34390), lrs4-L322E (AM34392), lrs4-L322A (AM34391), lrs4-KR4A (AM34393), and lrs4∆ (AM9766). Note two different wild-type mutants were used to confirm that rDNA phenotypes in point mutant strains were not a consequence of their derivation from an lrs4∆ parent. Wild type-2 and all mutants were generated from lrs4∆ (AM9766) by standard PCR method; while wild type-1 is a standard wild type. (F) A CR1 motif is found in KIF4A. (G) Potential candidate condensin ligands containing ([KR]-[KR]-L-[FYVIT]-[KR]-x(1,3)-[IV]) in S. cerevisiae. Source data are available online for this figure.

References

    1. Barton RE, Massari LF, Robertson D, Marston AL (2022) Eco1-dependent cohesin acetylation anchors chromatin loops and cohesion to define functional meiotic chromosome domains. eLife 11:e74447 - PMC - PubMed
    1. Batty P, Langer CC, Takács Z, Tang W, Blaukopf C, Peters J, Gerlich DW (2023) Cohesin‐mediated DNA loop extrusion resolves sister chromatids in G2 phase. EMBO J 42:e113475 - PMC - PubMed
    1. Baxter J, Sen N, Martínez VL, De Carandini MEM, Schvartzman JB, Diffley JFX, Aragon L et al (2011) Positive supercoiling of mitotic DNA drives decatenation by topoisomerase II in eukaryotes. Science 331:1328–1332 - PubMed
    1. Broad AJ, DeLuca KF, DeLuca JG (2020) Aurora B kinase is recruited to multiple discrete kinetochore and centromere regions in human cells. J Cell Biol 219:e201905144 - PMC - PubMed
    1. Burrack LS, Applen Clancey SE, Chacón JM, Gardner MK, Berman J (2013) Monopolin recruits condensin to organize centromere DNA and repetitive DNA sequences. Mol Biol Cell 24:2807–2819 - PMC - PubMed

MeSH terms

LinkOut - more resources