. 2024 Dec 17;25(1):376.
doi: 10.1186/s12859-024-06010-2.

CNVizard-a lightweight streamlit application for an interactive analysis of copy number variants

Affiliations

CNVizard-a lightweight streamlit application for an interactive analysis of copy number variants

Jeremias Krause et al. BMC Bioinformatics. .

Abstract

Background: Methods to call, analyze and visualize copy number variations (CNVs) from massive parallel sequencing data have been widely adopted in clinical practice and genetic research. To enable a streamlined analysis of CNV data, comprehensive annotations and good visualizations are indispensable. The ability to detect single exon CNVs is another important feature for genetic testing. Nonetheless, most available open-source tools come with limitations in at least one of these areas. One additional drawback is that available tools deliver data in an unstructured and static format which requires subsequent visualization and formatting efforts.

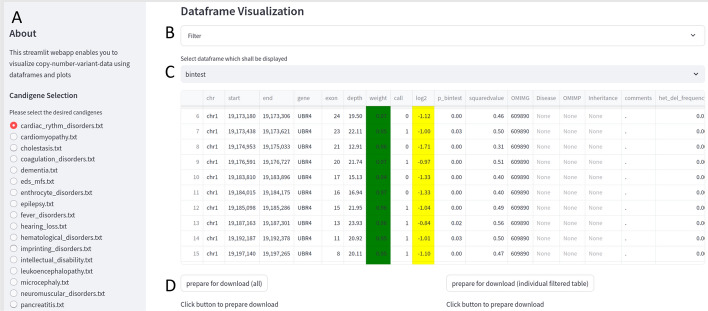
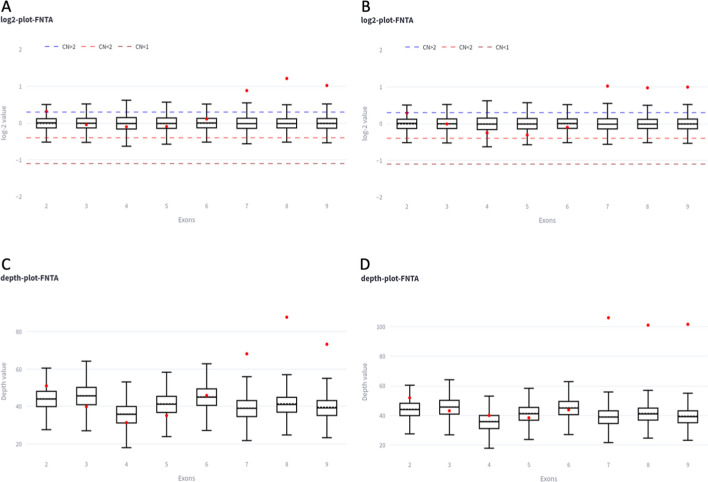
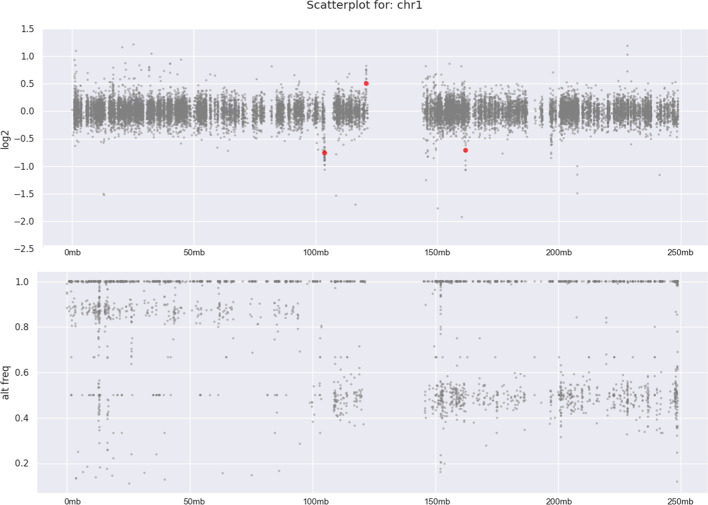
Results: Here we present CNVizard, an interactive Streamlit app allowing a comprehensive visualization of CNVkit data. Furthermore, combining CNVizard with the CNVand pipeline allows the annotation and visualization of CNV or SV VCF files from any CNV caller.

Conclusion: CNVizard, in combination with CNVand, enables the comprehensive and streamlined analysis of short- and long-read sequencing data and provide an intuitive webapp-like experience enabling an interactive visualization of CNV data.

Keywords: AnnotSV; CNV; CNVkit; Long-read sequencing; NGS; Snakemake.


Conflict of interest statement

Declarations. Ethics approval and consent to participate: Not applicable. Consent for publication: Not applicable. Competing interests: The authors declare no competing interests.

Figures

Fig. 1
Fig. 1
CNVizard web interface. On the sidebar a gene-panel list can be selected for a panel-based analysis. In this screenshot the preset “bintest” has been selected. A deletion of UBR4 is detected (C, column call and log2). A Sidebar with gene-panel selection; B Filter-section: drop down menu which enables the user to interactively filter the data grid; regarding genomic region/gene, minimal read depth, copy number, minimal log2 ratio and database frequencies. C Interactive data grid with color-coding for CNVs (CNV 2 is shown in white, whereas CNV below—0.65 are marked in yellow); D Download button, which allows the downloading of the filtered or unfiltered data grid
Fig. 2
Fig. 2
Examples of MLPA-like boxplots. The plots (A-D) show an example of a duplication of three exons within the FNTA gene. For exons 7, 8 and 9, the red dots, indicating the copy number or the coverage depth for the individual samples, are above the box plots, showing the copy number and coverage depth range of the reference samples. (upper panel: The blue and light red dashed line indicate the threshold for a copy number higher (0.3) or lower than 2 (−0.4). The red dashed line illustrates the threshold for a copy number below 1 (− 1.1). Upper panel/lower panel: Box plots indicate the 0.25 and 0.75 quartile of the reference samples. The dashed black lines indicate the mean, the solid black line the median. The whiskers show the minimum and maximum values of the reference samples, and the red dots indicate the copy number or depth of the analyzed single sample. A comparison between short-read data (A and C) and long-read data is shown (B and D). Most elements of the plot can be modified by the user ((log2 thresholds for duplications and deletions (indicated by the doted lines) and the color of the plotted elements)
Fig. 3
Fig. 3
CNV and b-allele frequency scatter plot as provided by CNVizard for chromosome 1. A somatic loss of heterozygosity is visible, indicated by the dispersion of the grey dots towards 1 and 0 in the B-allele frequency plot (B) on the left side (p arm) compared to the normal bi-allelic state on the right side of the plot (q arm). The CNV plot shows three small CNVkit-called copy number alterations (red dots in the CNV plot (A)). Grey dots indicate the copy number of a single bin as analyzed by CNVkit [4]. Regions with copy number changes called by CNVkit, are indicated by red dots. The x-axis depicts the chromosomal position in Mb and the y-axis, either the log2 copy number or the allele frequency ratio. Plots are generated using matplotlib [12] and seaborn [13]. The user can modify the displayed region (either the whole genome or a single chromosome) and the color of dots for copy number changes

References

    1. Pös O, Radvanszky J, Buglyó G, Pös Z, Rusnakova D, Nagy B, Szemes T. DNA copy number variation: main characteristics, evolutionary significance, and pathological aspects. Biomed J. 2021;44(5):548–59. - PMC - PubMed
    1. Hujoel ML, Sherman MA, Barton AR, Mukamel RE, Sankaran VG, Terao C, Loh PR. Influences of rare copy-number variation on human complex traits. Cell. 2022;185(22):4233–48. - PMC - PubMed
    1. Tilemis FN, Marinakis NM, Veltra D, Svingou M, Kekou K, Mitrakos A, Tzetis M, Kosma K, Makrythanasis P, Traeger-Synodinos J, et al. Germline CNV detection through whole-exome sequencing (WES) data analysis enhances resolution of rare genetic diseases. Genes. 2023;14(7):1490. - PMC - PubMed
    1. Talevich E, Shain AH, Botton T, Bastian BC. CNVkit: genome-wide copy number detection and visualization from targeted DNA sequencing. PLoS Comput Biol. 2014;12(4):e1004873. - PMC - PubMed
    1. Abyzov A, Urban AE, Snyder M, Gerstein M. CNVnator: an approach to discover, genotype, and characterize typical and atypical CNVs from family and population genome sequencing. Gen Res. 2011;21(6):974–84. - PMC - PubMed

MeSH terms

LinkOut - more resources