. 2024 Dec;14(12):e70180.
doi: 10.1002/brb3.70180.

Investigating Task-Free Functional Connectivity Patterns in Newborns Using Functional Near-Infrared Spectroscopy

Affiliations

Investigating Task-Free Functional Connectivity Patterns in Newborns Using Functional Near-Infrared Spectroscopy

Homa Vahidi et al. Brain Behav. 2024 Dec.

Abstract

Background: Resting-state networks (RSNs), particularly the sensorimotor network, begin to strengthe in the third trimester of pregnancy and mature extensively by term age. The integrity and structure of these networks have been repeatedly linked to neurological health outcomes in neonates, highlighting the importance of understanding the normative variations in RSNs in healthy development. Specifically, robust bilateral functional connectivity in the sensorimotor RSN has been linked to optimal neurodevelopmental outcomes in neonates.

Aim: In the current study, we aimed to map the developmental trajectory of the sensorimotor RSN in awake neonates using functional near-infrared spectroscopy (fNIRS).

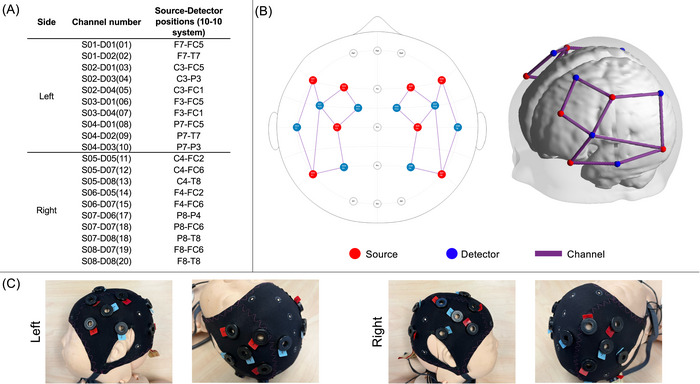
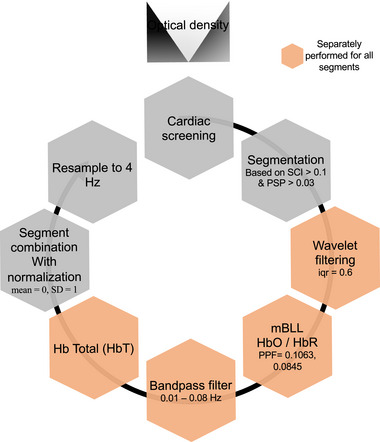
Materials & methods: We acquired fNIRS resting-state data from 41 healthy newborns (17 females, gestational age ranging from 36 + 0 to 42 + 1 weeks) within the first week after birth. We performed both single channel and hemispheric analyses to investigate the relationship between functional connectivity and both gestational and postnatal age.

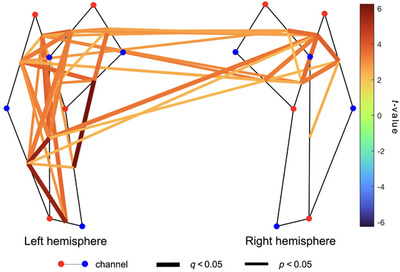
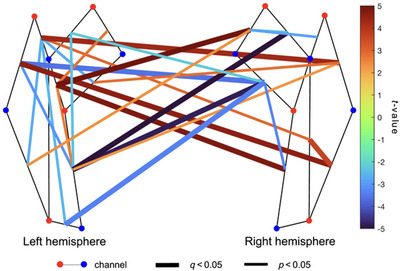
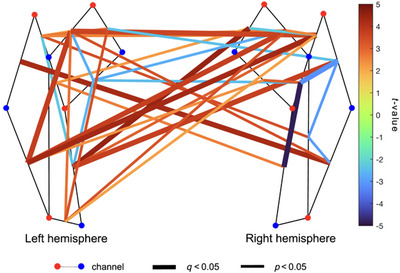
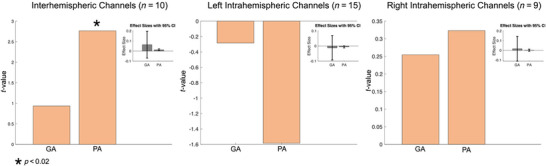
Results: We observed robust positive connectivity in numerous channel-pairs across the sensorimotor network, especially in the left hemisphere. Next, we examined the relationship between functional connectivity, gestational age, and postnatal age, while controlling for sex and subject effects. We found both gestational and postnatal age to be significantly associated with changes in functional connectivity in the sensorimotor RSN. In our hemispheric analysis (Ninterhemispheric = 10, Nleft intrahemispheric = 15, and Nright intrahemispheric = 9), we observed a significant positive relationship between interhemispheric connectivity and postnatal age.

Discussion and conclusion: In summary, our findings demonstrate the utility of fNIRS for monitoring early developmental changes in functional networks in awake newborns.

Keywords: connectivity; development; fNIRS; newborn.


Conflict of interest statement

The authors declare no conflicts of interest.

Figures

FIGURE 1
FIGURE 1
(A) 10–10 Locations of source‐detector pairs. (B) 2D and 3D views of the montage used. Sources are shown in red, detectors are shown in blue, and channels between them are shown in purple. (C) A model of a newborn wearing an fNIRS cap setup with our montage.
FIGURE 2
FIGURE 2
Overview of fNIRS data preprocessing steps. The black circular arrow indicates processing order starting with cardiac screening and ending with resampling to 4 Hz before sFC analysis.
FIGURE 3
FIGURE 3
Group t‐map showing spontaneous functional connectivity (sFC) spatial patterns for HbT (n = 41). Channel‐pairs displaying a significant positive or negative sFC are depicted in red and blue lines, respectively. The false discovery rate (FDR) was used to correct for multiple comparisons. Channel‐pairs that exhibited significant connectivity after FDR correction are drawn as thick lines, whereas channel‐pairs with significant connectivity before FDR correction are denoted with thin lines. The color of the lines represents the t‐value calculated for that channel‐pair's connectivity. Channel‐pairs that had fewer than 10 datapoints and those that were not significant have been omitted to increase clarity.
FIGURE 4
FIGURE 4
Group regression analysis demonstrating gestational age–related patterns in spontaneous functional connectivity (sFC) (n = 41). Channel‐pairs displaying a significant positive or negative effect of gestational age on sFC are depicted in red and blue lines, respectively. The false discovery rate (FDR) was used to correct for multiple comparisons. Channel‐pairs that exhibited significant connectivity after FDR correction are drawn as thick lines, whereas channel‐pairs with significant connectivity before FDR correction are denoted with thin lines. The color of the lines represents the t‐value calculated for that channel‐pair's connectivity. Channel‐pairs that had less than 10 datapoints and those that were not significant have been omitted to increase clarity.
FIGURE 5
FIGURE 5
Whole montage regression analysis demonstrating postnatal age–related patterns in functional connectivity (sFC) (n = 41). Channel‐pairs displaying a significant positive or negative effect of postnatal age on sFC are depicted in red and blue lines, respectively. The false discovery rate (FDR) was used to correct for multiple comparisons. Channel‐pairs that exhibited significant connectivity after FDR correction are drawn as thick lines, whereas channel‐pairs with significant connectivity before FDR correction are denoted with thin lines. The color of the lines represents the t‐value calculated for that channel‐pair's connectivity. Channel‐pairs that had fewer than 10 datapoints and those that were not significant have been omitted to increase clarity.
FIGURE 6
FIGURE 6
Hemisphere‐wide regression analyses demonstrating gestational age– and postnatal age–related patterns in functional connectivity. From left to right, each plot illustrates the effect of gestational age (GA) and postnatal age (PA) on interhemispheric, intrahemispheric (left), and intrahemispheric (right) functional connectivity. Only participants who had more than 50% of channels present after channel pruning were included in the analysis. The number of participants included is denoted on top of each plot. Each plot also includes a mini plot representing the effect sizes with 95% confidence intervals (CI). Significant effects are denoted by a star.

References

    1. Betzel, R. F. , Byrge L., He Y., Goñi J., Zuo X.‐N., and Sporns O.. 2014. “Changes in Structural and Functional Connectivity Among Resting‐State Networks Across the Human Lifespan.” NeuroImage 102: 345–357. 10.1016/j.neuroimage.2014.07.067. - DOI - PubMed
    1. Brenner, R. G. , Wheelock M. D., Neil J. J., and Smyser C. D.. 2021. “Structural and Functional Connectivity in Premature Neonates.” Seminars in Perinatology 45, no. 7: 151473. 10.1016/j.semperi.2021.151473. - DOI - PubMed
    1. Bulgarelli, C. , Blasi A., McCann S., et al. 2024. “Growth in Early Infancy Drives Optimal Brain Functional Connectivity Which Predicts Cognitive Flexibility in Later Childhood.” eLife 13: RP94194. 10.7554/eLife.94194.1. - DOI
    1. Cao, M. , Huang H., and He Y.. 2017. “Developmental Connectomics From Infancy Through Early Childhood.” Trends in Neurosciences 40, no. 8: 494–506. 10.1016/j.tins.2017.06.003. - DOI - PMC - PubMed
    1. Chorna, O. , Solomon J. E., Slaughter J. C., Stark A. R., and Maitre N. L.. 2014. “Abnormal Sensory Reactivity in Preterm Infants During the First Year Correlates With Adverse Neurodevelopmental Outcomes at 2 Years of Age.” Archives of Disease in Childhood—Fetal and Neonatal Edition 99, no. 6: F475–F479. 10.1136/archdischild-2014-306486. - DOI - PMC - PubMed

LinkOut - more resources