. 2024 Nov 22;26(1):bbae631.
doi: 10.1093/bib/bbae631.

A novel computational model ITHCS for enhanced prognostic risk stratification in ESCC by correcting for intratumor heterogeneity

Affiliations

A novel computational model ITHCS for enhanced prognostic risk stratification in ESCC by correcting for intratumor heterogeneity

Tong Lu et al. Brief Bioinform. .

Abstract

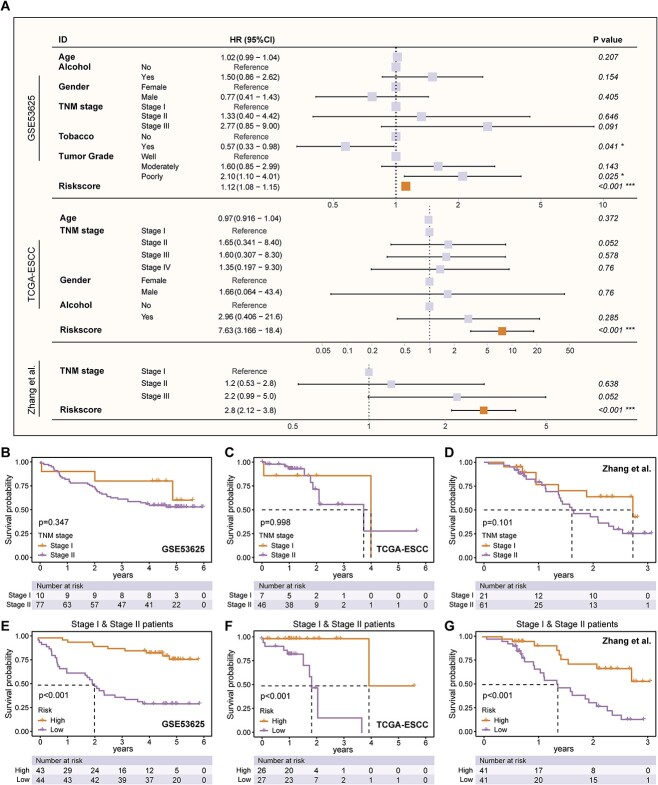
Intratumor heterogeneity significantly challenges the accuracy of existing prognostic models for esophageal squamous cell carcinoma (ESCC) by introducing biases related to the varied genetic and molecular landscapes within tumors. Traditional models, relying on single-sample, single-region bulk RNA sequencing, fall short of capturing the complexity of intratumor heterogeneity. To fill this gap, we developed a computational model for intratumor heterogeneity corrected signature (ITHCS) by employing both multiregion bulk and single-cell RNA sequencing to pinpoint genes that exhibit consistent expression patterns across different tumor regions but vary significantly among patients. Utilizing these genes, we applied multiple machine-learning algorithms for sophisticated feature selection and model construction. The ITHCS model significantly outperforms existing prognostic indicators in accuracy and generalizability, markedly reducing sampling biases caused by intratumor heterogeneity. This improvement is especially notable in the prognostic assessment of early-stage ESCC patients, where the model exhibits exceptional predictive power. Additionally, we found that the risk score based on ITHCS may be associated with epithelial-mesenchymal transition characteristics, indicating that high-risk patients may exhibit a diminished efficacy to immunotherapy.

Keywords: esophageal squamous cell carcinoma; intra-tumor heterogeneity; machine learning; prognostic prediction; sampling bias.


Figures

Figure 1
Figure 1
Impact of intratumor heterogeneity on sampling bias. (A) Comprehensive overview of the study design. (B) The heatmap (top) illustrates unsupervised hierarchical clustering based on the 100 most variably expressed genes within the GSE33426 cohort. The x-axis represents the highly variable genes, and the y-axis represents the tumor samples. The heatmap (bottom) presents the sample distribution for each patient with ESCC. The x-axis represents the ESCC patient IDs, and the y-axis represents the tumor samples. (C) PCA using highly variable genes in the GSE33426 dataset. (D) Tumor samples from individual regions are represented by points (left). The median risk score across these samples is denoted by a horizontal dashed line. The accompanying bar chart (right) displays the proportion of patients classified into consistent low-risk, high-risk, and inconsistent-risk categories. (E) Bar chart shows the percentage of patients in the GSE33426 cohort categorized into low, high, and disconcordant risk groups based on an analysis of 12 established signatures. ESCC, esophageal squamous cell carcinoma; PCA, principal component analysis.
Figure 2
Figure 2
Screening for low intratumor heterogeneity genes. (A) RNA heterogeneity quadrant chart based on the GSE33426 multiregion ESCC cohort. The x-axis represents intertumor heterogeneity, while the y-axis denotes intratumor heterogeneity. (B) Proportion of genes from published ESCC prognostic models within quadrants Q1–Q4 (left). Percentage of expected versus observed genes in each RNA heterogeneity quadrant. (C) ROGUE scores for epithelial cells, immune cells, and stromal cells in ESCC single-cell RNA cohorts GSE196756, GSE197677, and GSE160269. (D) Boxplot comparison of Q4 quadrant gene feature scores among epithelial cells, immune cells, and stromal cells in the GSE196756, GSE197677, and GSE160269 cohorts. Statistical analysis was performed using the Kruskal–Wallis test followed by Dunn’s test. ***, P < .001. ESCC, esophageal squamous cell carcinoma.
Figure 3
Figure 3
Development of the ITHCS. (A) Lasso regression’s 5-fold cross-validation AUC graph under varying lambda parameters. (B) C-index calculated after integrating 9 machine learning algorithms, using GSE53625 as the training cohort and TCGA-ESCC and Zhang et al. as validation cohorts. (C) Coefficient estimates for selected genes in the model are shown, with each dot representing the estimated coefficient for a gene. Error bars indicate the 95% confidence intervals for these coefficients. (D–F) Patient OS analysis using the ITHCS risk score in the GSE53625 cohort (training set), Zhang et al. (external test set), and TCGA-ESCC (external test set). Patients in each dataset were divided into high-risk and low-risk groups based on median risk score. In all three datasets, patients in the high-risk group exhibited significantly poorer prognosis compared to those in the low-risk group. (G, H) In the TCGA-ESCC cohort, patient risk scores calculated using ITHCS were used to assess PFS and DSS. The results indicated that patients in the high-risk group had poorer PFS and DSS outcomes compared to those in the low-risk group. (I) A combined analysis based on the GSE53625, TCGA-ESCC, and Zhang et al. cohorts revealed that the ITHCS risk score consistently served as a risk factor associated with poorer patient prognosis, with no heterogeneity differences observed across the three datasets (P = .11). ITHCS, intratumor heterogeneity corrected signature; C-index, concordance index; OS, overall survival; PFS, progression-free survival; DSS, disease-specific survival.
Figure 4
Figure 4
Comparative prognostic accuracy of ITHCS and other models. (A, B) Circular plot depicting the comparison of the C-index between ITHCS and 13 other signatures across three datasets. The vertical axis represents the C-index (left). Accompanying heatmaps illustrate the C-index comparison between ITHCS and the 13 other signatures across the three datasets, highlighting that ITHCS consistently achieves a higher average C-index than other models. (C) Comparative analysis of the AUC values between ITHCS and other signatures over different years. The left section presents data from the GSE53625 cohort, the middle from the TCGA-ESCC cohort, and the right from the Zhang et al. cohort. ITHCS, intratumor heterogeneity corrected signature; C-index, concordance index; AUC, area under the curve.
Figure 5
Figure 5
Tumor heterogeneity assessment in different transcriptomic levels using ITHCS. (A) Box plots in the GSE33426 cohort, comparing the standard deviation of ITHCS risk scores with those of 13 other models for patients’ multiregion samples. (B) In the GSE33426 cohort, ITHCS evaluation (left) is illustrated by a bar graph, demonstrating the percentage of patients categorized into low-consistency risk, high-consistency risk, and inconsistent risk groups based on ITHCS risk scoring. (C) Comparison of intratumor and intertumor heterogeneity among 14 signatures in the GSE33426 cohort. The x-axis represents intratumor heterogeneity, while the y-axis represents intertumor heterogeneity. (E) On the left, the UMAP plot of the GSE197677 dataset shows the distribution of single cells within the samples. On the right, the bar chart presents the average variance of the 14 signature scores for the samples. Lower variance indicates reduced intratumor heterogeneity, with the x-axis representing log2-transformed variance values. (F) In the spatial transcriptomics cohort, a comparison of mean risk deviation between ITHCS and 13 other models in three tumor samples, with the x-axis showing the SD post-log2 transformation. The right panel presents a slice diagram illustrating the distribution of the ITHCS signature in spots. ITHCS, intratumor heterogeneity corrected signature; UMAP, uniform manifold approximation and projection.
Figure 6
Figure 6
ITHCS demonstrates superior performance in early-stage risk stratification of ESCC. (A) Multivariate Cox regression analysis was conducted on the GSE53625, TCGA-ESCC, and Zhang et al. cohorts. ITHCS risk scores were identified as independent prognostic factors in all three datasets, as indicated by orange labels. (B–D) Kaplan–Meier analysis for Stage I and Stage II patients was performed in the GSE53625, TCGA-ESCC, and Zhang et al. cohorts. The results indicate that the prognosis differences between Stage I and Stage II patients in these datasets are not significant. (E–G) The ITHCS risk scores were applied for risk stratification of Stage I and II patients in the GSE53625, TCGA-ESCC, and Zhang et al. cohorts. Findings reveal that the ITHCS risk scoring effectively distinguishes between high-risk and low-risk patient groups in all three datasets. ITHCS, intratumor heterogeneity corrected signature; KM, Kaplan–Meier.
Figure 7
Figure 7
Potential biological differences between high-risk and low-risk patients as identified by ITHCS. (A) Proportion and number of differentially expressed genes in high-risk and low-risk groups across GSE53625, TCGA-ESCC, and Zhang et al. cohorts. (B) Intersection results of GSEA in GSE53625, TCGA-ESCC, and Zhang et al. (C) Enrichment results of the HALLMARK EMT pathway in GSE53625, TCGA-ESCC, and Zhang et al. cohorts. (D) Differences in npCR and pCR between high-risk and low-risk groups in immune therapy datasets IMvigor210, GSE213331, GSE91061, and GSE115821, with significantly higher risk scores observed in the high-risk group. (D) Differences in ITHCS risk scores between npCR and pCR in immunotherapy datasets IMvigor210, GSE213331, GSE91061, and GSE115821. Risk scores for npCR are notably higher than those in the low-risk group. (E) Differences in EMT scores between npCR and pCR in immunotherapy datasets. In the IMvigor210 dataset, npCR scores significantly exceed those of pCR, with no significant statistical differences observed in other datasets. GSEA, gene set enrichment analysis; EMT, epithelial–mesenchymal transition; pCR, pathological complete response; npCR, nonpathological complete response.

Similar articles

References

    1. Sung H, Ferlay J, Siegel RL. et al. . Global cancer statistics 2020: GLOBOCAN estimates of incidence and mortality worldwide for 36 cancers in 185 countries. CA Cancer J Clin 2021;71:209–49. 10.3322/caac.21660. - DOI - PubMed
    1. Then EO, Lopez M, Saleem S. et al. . Esophageal cancer: an updated surveillance epidemiology and end results database analysis. World J Oncol 2020;11:55–64. 10.14740/wjon1254. - DOI - PMC - PubMed
    1. Zhang X, Wang Y, Meng L. Comparative genomic analysis of esophageal squamous cell carcinoma and adenocarcinoma: new opportunities towards molecularly targeted therapy. Acta Pharm Sin B 2022;12:1054–67. 10.1016/j.apsb.2021.09.028. - DOI - PMC - PubMed
    1. Kadian LK, Arora M, Prasad CP. et al. . Signaling pathways and their potential therapeutic utility in esophageal squamous cell carcinoma. Clin Transl Oncol 2022;24:1014–32. 10.1007/s12094-021-02763-x. - DOI - PubMed
    1. Li Y, Lu Z, Che Y. et al. . Immune signature profiling identified predictive and prognostic factors for esophageal squamous cell carcinoma. Onco Targets Ther 2017;6:e1356147. 10.1080/2162402X.2017.1356147. - DOI - PMC - PubMed

MeSH terms

Substances