

Correlation between admission blood glucose, fibrinogen, and slow blood flow during primary PCI for acute ST segment elevation myocardial infarction
- PMID: 39691498
- PMCID: PMC11649649
- DOI: 10.3389/fcvm.2024.1478743
Correlation between admission blood glucose, fibrinogen, and slow blood flow during primary PCI for acute ST segment elevation myocardial infarction
Abstract
Backgroud: Coronary slow flow (CSF) is a common phenomenon of coronary microcirculation dysfunction, and is closely related to elevated blood glucose and fibrinogen (FIB) levels. However, whether immediate blood glucose and FIB levels affect coronary blood flow during primary percutaneous coronary intervention (PCI) remains unclear.
Objective: To explore the correlation between admission blood glucose (ABG), fibrinogen (FIB) and slow blood flow during primary PCI for acute ST segment elevation myocardial infarction (STEMI).
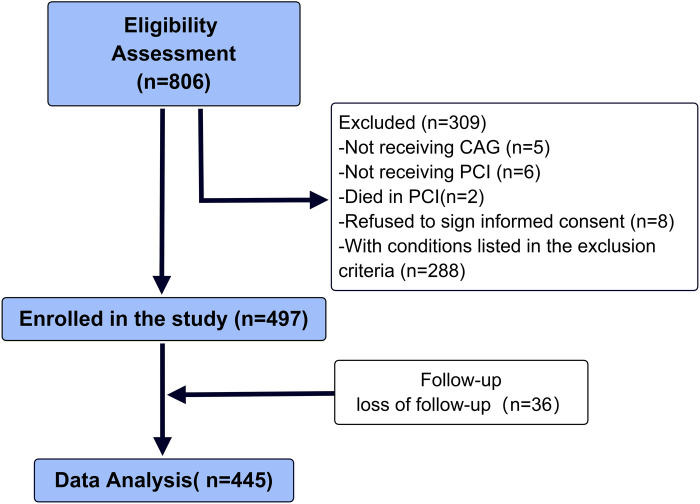
Methods: A total of 497 patients who underwent coronary angiography in the cardiology department of the 904th Hospital of the Joint Logistics Support Force from December 2018 to December 2022 due to STEMI were selected consecutively, and then were divided into two groups based on whether slow blood flow occurred during primary PCI: slow blood flow group (n = 117) and control group (n = 380). Detecting the ABG, FIB and other indicators of patients in each group, and using logistic regression analysis and receiver operating characteristic (ROC) curve to analyze independent risk factors for slow blood flow during primary PCI, and further evaluating the prognosis of patients.
Results: The levels of ABG and FIB in patients with slow blood flow were significantly higher than those in the control group (P < 0.05). The results of multivariate logistic regression analysis suggested that FIB and ABG were independent risk factors for slow blood flow during primary PCI (both P < 0.05). ROC curve analysis showed that ABG, FIB, and their combination all had predictive value for slow blood flow during primary PCI (all P < 0.05), and the area under the curve (AUC) of the combined indicator was higher than that of any single indicator, with statistical significance (P < 0.05). KM curve analysis suggested that the prognosis of patients in slow blood flow group were poor.
Conclusion: Both elevated ABG and FIB could predict slow blood flow during primary PCI, and the diagnostic value of the combined indicator was superior to that of any single indicator, which could be used for the evaluation of slow blood flow during primary PCI, so as to evaluate the prognosis of patients with STEMI.
Keywords: acute ST segment elevation myocardial infarction; admission blood glucose; fibrinogen; percutaneous coronary intervention; slow blood flow.
© 2024 Zufei, Wentao, Chen, Xu, Zong and Wu.
Conflict of interest statement
The authors declare that the research was conducted in the absence of any commercial or financial relationships that could be construed as a potential conflict of interest.
Figures


References
-
- Saadat M, Masoudkabir F, Afarideh M, Ghodsi S, Vasheghani-Farahani A. Discrimination between obstructive coronary artery disease and cardiac syndrome X in women with typical angina and positive exercise test; utility of cardiovascular risk calculators. Medicina (Kaunas, Lithuania). (2019) 55(1):12. 10.3390/medicina55010012 - DOI - PMC - PubMed
LinkOut - more resources
Full Text Sources
Miscellaneous