. 2024 Dec 3:15:1493377.
doi: 10.3389/fimmu.2024.1493377. eCollection 2024.

Integrating omics data and machine learning techniques for precision detection of oral squamous cell carcinoma: evaluating single biomarkers

Affiliations

Integrating omics data and machine learning techniques for precision detection of oral squamous cell carcinoma: evaluating single biomarkers

Yilan Sun et al. Front Immunol. .

Abstract

Introduction: Early detection of oral squamous cell carcinoma (OSCC) is critical for improving clinical outcomes. Precision diagnostics integrating metabolomics and machine learning offer promising non-invasive solutions for identifying tumor-derived biomarkers.

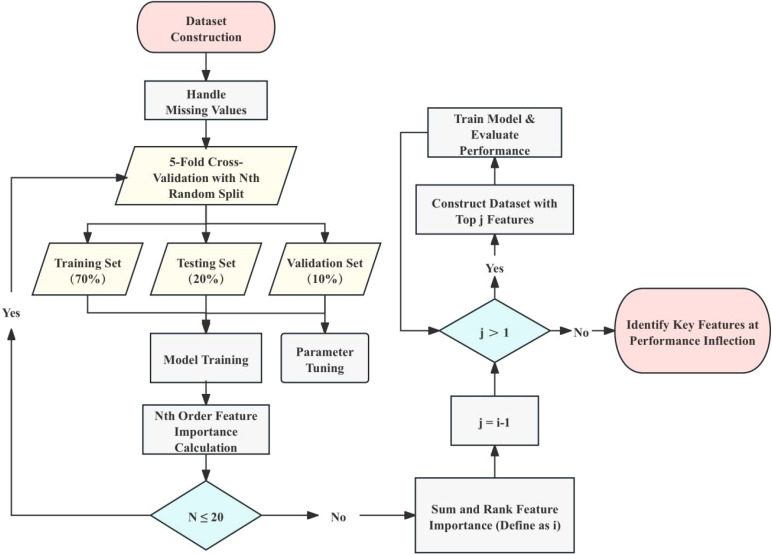
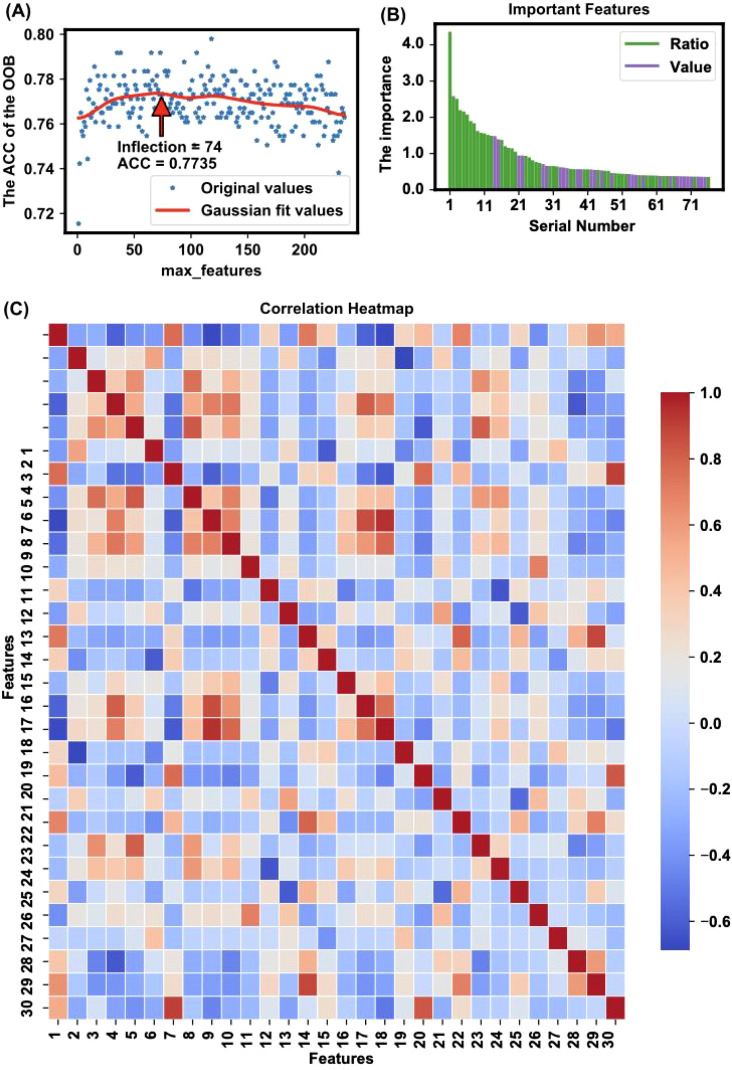
Methods: We analyzed a multicenter public dataset comprising 61 OSCC patients and 61 healthy controls. Plasma metabolomics data were processed to extract 29 numerical and 47 ratio features. The Extra Trees (ET) algorithm was applied for feature selection, and the TabPFN model was used for classification and prediction.

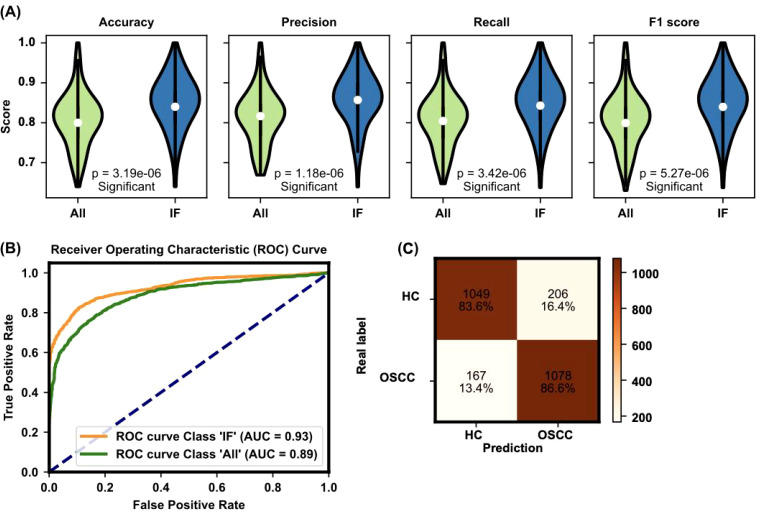
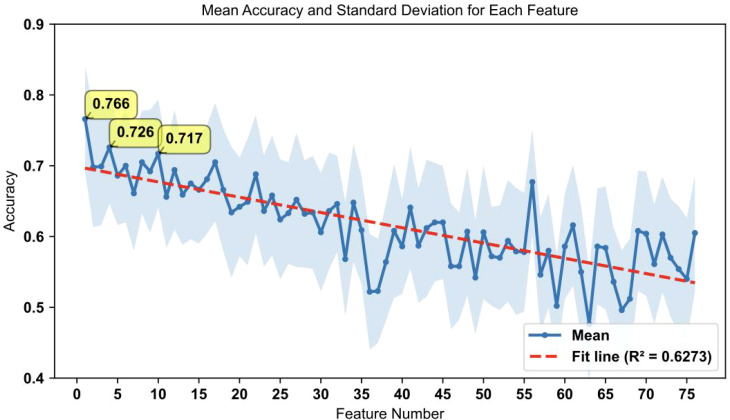
Results: The model achieved an area under the curve (AUC) of 93% and an overall accuracy of 76.6% when using top-ranked individual biomarkers. Key metabolic features significantly differentiated OSCC patients from healthy controls, providing a detailed metabolic fingerprint of the disease.

Discussion: Our findings demonstrate the utility of integrating omics data with advanced machine learning techniques to develop accurate, non-invasive diagnostic tools for OSCC. The study highlights actionable metabolic signatures that have potential applications in personalized therapeutics and early intervention strategies.

Keywords: feature selection; machine learning; oral squamous cell carcinoma; personalized therapy; precision metabolomics.


Conflict of interest statement

The authors declare that the research was conducted in the absence of any commercial or financial relationships that could be construed as a potential conflict of interest.

Figures

Figure 1
Figure 1
Workflow for dataset construction and model training. This figure outlines the workflow for constructing the dataset and training the machine learning models. The process starts with dataset preparation, handling missing values, and performing 5-fold cross-validation with random splits of the dataset. This cross-validation process is repeated 20 times, totaling 100 model training and validation iterations. For each iteration, models are trained with the top n important features, and the change in accuracy (ACC) is monitored to identify the inflection point, representing the most critical features for classification. The importance of each feature is determined by summing the feature importance scores calculated over 100 iterations using the Extra Trees (ET) model. The training set (70%) and validation set (10%) are used for parameter tuning and feature ranking, while the test set (20%) is reserved for final performance evaluation. The process iteratively narrows down the feature set until the top-ranked features are determined based on performance stabilization at the inflection point.
Figure 2
Figure 2
Bayesian optimization procedure for model parameters. (A) The Bayesian optimization procedure for tuning parameters such as the number of estimators, and maximum depth. The x-axis represents parameter values, and the y-axis represents accuracy changes. Blue dots indicate parameter values attempted by Bayesian optimization, and the red dot indicates the optimal parameter value. This process highlighted the importance of parameter optimization in improving model performance. (B, C) Box plots of model accuracy before and after Bayesian optimization. The box’s central red line represents the median, the outer red lines represent the maximum and minimum values, and the box edges represent the first and third quartiles. Outliers are shown as individual points around the box. (B) shows the accuracy before parameter tuning, while (C) shows the accuracy after parameter tuning. The comparison demonstrates that TabPFN outperformed others in terms of accuracy.
Figure 3
Figure 3
Feature selection and importance analysis. (A) The trend of accuracy changes when applying different features for modeling is illustrated, highlighting an inflection point where 76 features yielded the highest accuracy (ACC = 0.8057) with the OOB method. The x-axis represents the number of top important features used for modeling, and the y-axis represents the corresponding OOB accuracy. The red line is a Gaussian fit curve indicating the trend. (B) The importance of features is depicted, showing the value of feature importance for each selected feature. The identified important features include a mix of individual metabolites and metabolite ratios, which together capture key metabolic changes linked to OSCC. This combination improves the model’s ability to distinguish between healthy and cancerous states The feature importance is calculated based on the sum of importance scores from 100 random splits and model trainings. (C) The heatmap presents Pearson correlation coefficients for the top 30 features ranked by importance in the model, as listed in Supplementary Table S8 . The color intensity indicates the strength of the correlation: red represents a strong positive correlation, blue indicates a strong negative correlation, and white shows little to no correlation. This visualization helps identify relationships and dependencies among the selected features, providing insights into potential interactions that could influence the model’s performance.
Figure 4
Figure 4
Evaluation of model performance with all features and important features. (A) The evaluation of the TabPFN model with all features versus only the important features demonstrates significant improvements in accuracy (0.851 ± 0.066), precision (0.858 ± 0.065), recall (0.851 ± 0.066), and F1 score (0.851 ± 0.067) when the important features are used. The figure presents violin plots with embedded box plots. The box plots’ central red line represents the median, with the edges of the box denoting the first and third quartiles, and whiskers extending to the minimum and maximum values. Outliers are shown as individual points. (B) The ROC curve and AUC value for the TabPFN model further confirm the model’s high diagnostic capability, with an AUC of 0.93 indicating excellent performance. The violin plot, a variant of the box plot, shows the density of accuracy values, highlighting the distribution of accuracy scores. (C) Confusion matrix analysis of model predictions: The confusion matrix compares real labels (HC for HC and OSCC for oral squamous cell carcinoma patients) against predicted labels. The numbers represent the count and percentage of correctly and incorrectly classified samples in each category. The model accurately classified 83.6% of HC and 86.6% of OSCC patients.
Figure 5
Figure 5
Accuracy performance for individual features ranked by importance. This figure shows the accuracy results for individual feature predictions, with the accuracy trend generally following the feature importance ranking. The shaded area represents the standard deviation of accuracy for each feature. The top three features with the highest accuracy are labeled on the graph (ACC= 0.766, 0.698, 0.699, respectively). The red dashed line represents the fit line with an R² value of 0.6273, indicating the overall trend.

Similar articles

References

    1. Radaic A, Kamarajan P, Cho A, Wang S, Hung GC, Najarzadegan F, et al. . Biological biomarkers of oral cancer. Periodontol 2000. (2023) 96:250–80. doi: 10.1111/prd.12542 - DOI - PMC - PubMed
    1. Hasegawa T, Yatagai N, Furukawa T, Wakui E, Saito I, Takeda D, et al. . The prospective evaluation and risk factors of dysphagia after surgery in patients with oral cancer. J Otolaryngol Head Neck Surg. (2021) 50:4. doi: 10.1186/s40463-020-00479-6 - DOI - PMC - PubMed
    1. Faedo RR, Da SG, Da SR, Ushida TR, Da SR, Lacchini R, et al. . Sphingolipids signature in plasma and tissue as diagnostic and prognostic tools in oral squamous cell carcinoma. Biochim Biophys Acta Mol Cell Biol Lipids. (2022) 1867:159057. doi: 10.1016/j.bbalip.2021.159057 - DOI - PubMed
    1. Polachini GM, de Castro TB, Smarra L, Henrique T, de Paula C, Severino P, et al. . Plasma metabolomics of oral squamous cell carcinomas based on NMR and MS approaches provides biomarker identification and survival prediction. Sci Rep. (2023) 13:8588. doi: 10.1038/s41598-023-34808-2 - DOI - PMC - PubMed
    1. Wang S, Yang M, Li R, Bai J. Current advances in noninvasive methods for the diagnosis of oral squamous cell carcinoma: a review. Eur J Med Res. (2023) 28:53. doi: 10.1186/s40001-022-00916-4 - DOI - PMC - PubMed

MeSH terms

Substances

LinkOut - more resources