. 2025 Jul;80(7):1899-1911.
doi: 10.1111/all.16434. Epub 2024 Dec 18.

Multiomic Integration Analysis for Monitoring Severe Asthma Treated With Mepolizumab or Omalizumab

Affiliations

Multiomic Integration Analysis for Monitoring Severe Asthma Treated With Mepolizumab or Omalizumab

Nuria Contreras et al. Allergy. 2025 Jul.

Abstract

Rationale: Biologics are becoming increasingly important in the management of severe asthma. However, little is known about the systemic immunometabolic consequences of Th2 response blockage.

Objectives: To provide a better immunometabolic understanding of the effects of mepolizumab and omalizumab treatments by identifying potential biomarkers for monitoring.

Methods: In this exploratory longitudinal study severe asthmatic patients were followed for 18 months after initiating mepolizumab (n = 36) or Omalizumab (n = 20) treatment. Serum samples were collected before, 6, and 18 months after treatment. Targeted omic approaches were performed to analyze inflammatory metabolites (n = 35) and proteins (n = 45). Multiomic integration was performed individually for each treatment applying supervised analysis Data Integration Analysis for Biomarker discovery using Latent cOmponents (DIABLO) framework. Then, potential biomarkers were confirmed using multivariate ROC analyses and correlated with clinical variables along treatment.

Measurements and main results: Mepolizumab and omalizumab were both effective (improved clinical variables) and showed different and specific metabolic and protein profiles in severe asthmatic patients during treatment. Multiomic integration and multivariate ROC analyses identified specific biomarkers, such as arachidonic acid, palmitoleic acid, oleic acid, propionylcarnitine, bilirubin, CCL11, and TNFSF10, which can explain the differences observed with Mepolizumab treatment over 18 months and significantly correlate with clinical improvement. However, no significant biomolecules and no discriminative multivariate ROC curves were found for Omalizumab treatment.

Conclusions: Our results provide a comprehensive insight into the differential effects of mepolizumab and omalizumab on the immunometabolic kinetics of the inflammatory response in severe asthma. We identified a set of biomolecules with potential for monitoring mepolizumab treatment which could be useful for personalized medicine.

Keywords: asthma; biologicals; biomarkers; metabolomics; proteomics.


Conflict of interest statement

V.M. reports personal fees and/or honoraria from GSK and Astra. C.C. reports personal fees and/or honoraria from Astra, GSK, Sanofi, Gebro, Menarini, and Chiesi and has served Data Safety Monitoring Board and/or Advisory Board at Sanofi, GSK, and Astra. T.C. reports personal fees and/or honoraria from GSK, Sanofi, and AstraZeneca. The other authors declare no conflict of interest.

Figures

FIGURE 1
FIGURE 1
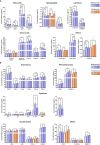
Clinical variables monitoring along biological treatment. Significant differences observed during mepolizumab (purple) (n = 36) and omalizumab (orange) (n = 20) treatment. T0 corresponds to baseline, T1 to 6 months of treatment and T2 to 18 months of treatment. The values are presented by the mean and the 95% confidence interval. Repeated‐measures ANOVA test ****p value < 0.0001, ***p value < 0.001, *p value < 0.05; ns, no significant.
FIGURE 2
FIGURE 2
(A) Metabolomic and (B) proteomic profiles of mepolizumab (purple) (n = 36) and omalizumab (orange) (n = 18) patients along treatment. T0 corresponds to baseline, T1 to 6 months of treatment, and T2 to 18 months of treatment. The values are presented by the mean and the 95% confidence interval. Repeated‐measures ANOVA test ****p value < 0.0001, ***p value < 0.001, **p value < 0.01, *p value < 0.05. CCL, c‐c motif chemokine; EGF, proepidermal growth factor; FLT3LG, fms‐related tyrosine kinase 3 ligand; HGF, hepatocyte growth factor; IFN‐γ, interferon gamma; IL, interleukin; MMP, matrix metalloproteinases; OLR1, oxidized low‐density lipoprotein receptor 1; OSM, oncostatin‐m; S1P, sphingosine‐1‐phosphate; TGF, transforming growth factor; TNFSF, tumor necrosis factor superfamily; VEGFA, vascular endothelial growth factor.
FIGURE 3
FIGURE 3
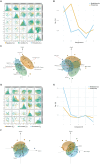
Metabolomic and proteomic integration analysis using DIABLO framework. (A) Factor scores plot along different components of the generated models. Samples from the three time points of mepolizumab treatment monitoring (n = 18) are represented. (B) Explained variance of each component for each omic layer in the model for mepolizumab group. (C) 3D scatter plot of the samples from the three time points of mepolizumab treatment including the metabolites and proteins that significantly contribute to their differences. (D) Factor scores plot along different components of the generated models. Samples from the three time points of omalizumab treatment monitoring (n = 16) are represented. (E) Explained variance of each component for each omic layer in the omalizumab group. (F) 3D scatter plot of the three time points of omalizumab treatment.
FIGURE 4
FIGURE 4
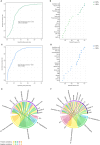
Multivariate ROC curves for mepolizumab treatment (n = 18) comparing (A) baseline to 6 months and (B) the selected frequency of each biomolecule considered in this model. (C) Multivariate ROC curves for mepolizumab treatment (n = 18) comparing baseline to 18 months and (D) the selected frequency of each biomolecule considered in this model. Significant correlations between the selected biomolecules (metabolites and proteins) with the clinical variables (blood eosinophils, levels of FEV1, ACT, and the frequence of severe exacerbations and hospitalizations) (E) after 6 months or (F) 18 months of mepolizumab treatment. Paired Spearman correlation test (p value < 0.05).

References

    1. Agache I. and Akdis C. A., eds. Global Atlas of Asthma, 2nd ed. (Switzerland: European Academy of Allergy and Clinical Immunology, 2022).
    1. Borish L., “The Immunology of Asthma,” Annals of Allergy, Asthma & Immunology 117, no. 2 (2016): 108–114, 10.1016/j.anai.2016.04.022. - DOI - PMC - PubMed
    1. Bush A., Holguin F., Porsbjerg C., and Saglani S., “Asthma: Closing in on the Biology of a Complex Life‐Course Disease,” American Journal of Respiratory and Critical Care Medicine 207, no. 4 (2023): 375–376, 10.1164/rccm.202212-2302ED. - DOI - PMC - PubMed
    1. Chen M., Shepard K., Yang M., et al., “Overlap of Allergic, Eosinophilic and Type 2 Inflammatory Subtypes in Moderate‐To‐Severe Asthma,” Clinical and Experimental Allergy 51, no. 4 (2021): 546–555, 10.1111/cea.13790. - DOI - PMC - PubMed
    1. León B. and Ballesteros‐Tato A., “Modulating Th2 Cell Immunity for the Treatment of Asthma,” Frontiers in Immunology 12 (2021): 637948, 10.3389/fimmu.2021.637948. - DOI - PMC - PubMed