. 2025 Feb;12(6):e2409120.
doi: 10.1002/advs.202409120. Epub 2024 Dec 18.

The Na+,K+,2Cl- Cotransporter, Not Aquaporin 1, Sustains Cerebrospinal Fluid Secretion While Controlling Brain K+ Homeostasis

Affiliations

The Na+,K+,2Cl- Cotransporter, Not Aquaporin 1, Sustains Cerebrospinal Fluid Secretion While Controlling Brain K+ Homeostasis

Dennis Bo Jensen et al. Adv Sci (Weinh). 2025 Feb.

Abstract

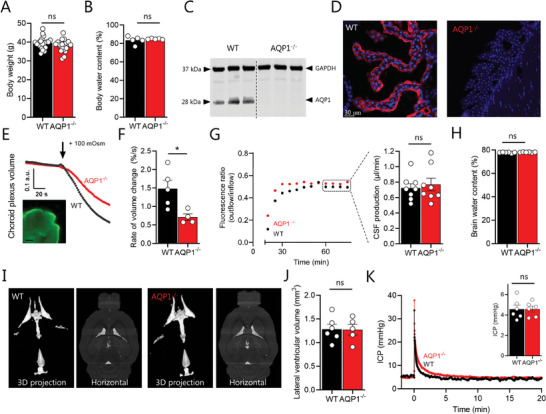
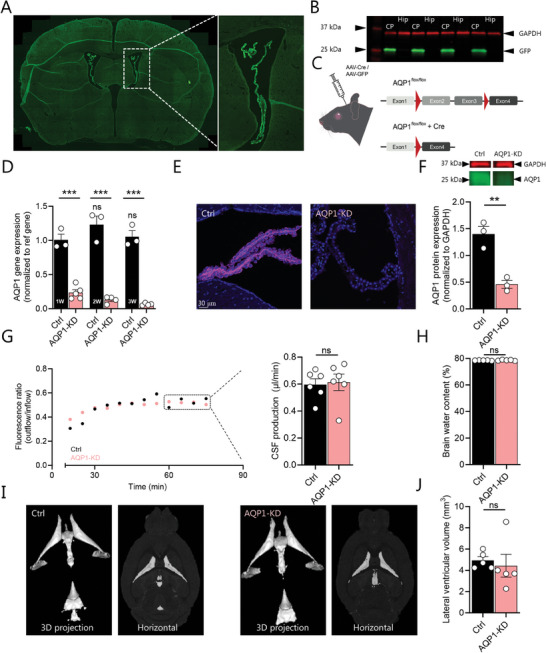
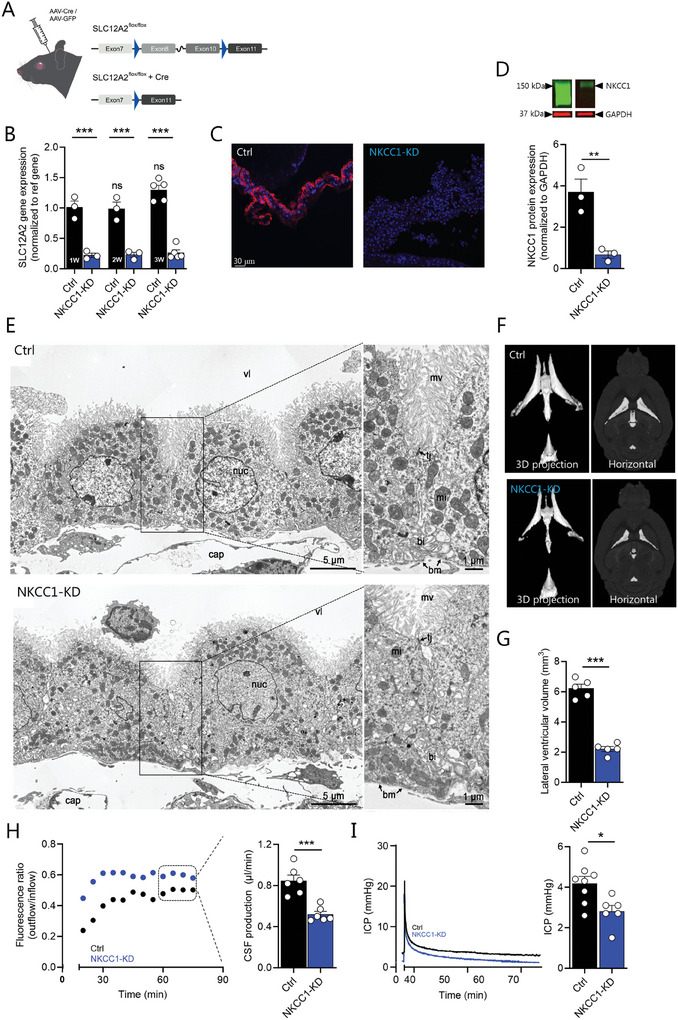
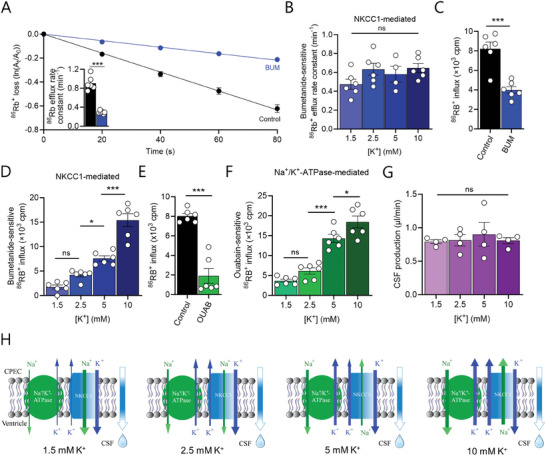
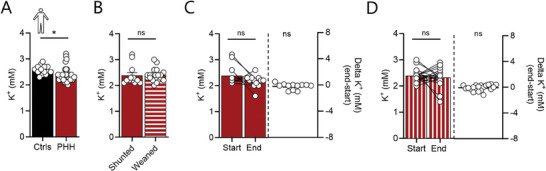
Disturbances in the brain fluid balance can lead to life-threatening elevation in intracranial pressure (ICP), which represents a vast clinical challenge. Targeted and efficient pharmaceutical therapy of elevated ICP is not currently available, as the molecular mechanisms governing cerebrospinal fluid (CSF) secretion are largely unresolved. To resolve the quantitative contribution of key choroid plexus transport proteins, this study employs mice with genetic knockout and/or viral choroid plexus-specific knockdown of aquaporin 1 (AQP1) and the Na+, K+, 2Cl- cotransporter 1 (NKCC1) for in vivo determinations of CSF dynamics, ex vivo choroid plexus for transporter-mediated clearance of a CSF K+ load, and patient CSF for [K+] quantification. CSF secretion and ICP management occur independently of choroid plexus AQP1 expression, whereas both parameters are reduced by 40% upon choroid plexus NKCC1 knockdown. Elevation of [K+]CSF increases the choroid plexus Na+/K+-ATPase activity, and favors inwardly-directed net NKCC1 transport, which, together, promote CSF K+ clearance, while maintaining undisturbed CSF secretion rates. CSF from patients with post-hemorrhagic hydrocephalus does not display elevated [K+]CSF, suggesting that NKCC1 maintains net outward transport direction during post-hemorrhagic hydrocephalus formation. Direct or indirect therapeutic modulation of choroid plexus NKCC1 can thus be a potential promising pharmacological approach against brain pathologies associated with elevated ICP.

Keywords: CSF; K+; NKCC1; aquaporin; choroid plexus; hydrocephalus.


Conflict of interest statement

The authors declare no conflict of interest.

Figures

Figure 1
Figure 1
Knockout of AQP1 reduces choroid plexus osmotic water permeability but not CSF secretion or ICP. A) Body weight (n = 20) and B) body water content (n = 5) of wildtype (WT) and AQP1 knockout (AQP1−/−) mice. C) Representative Western blot of lysates from mouse choroid plexus from WT and AQP1−/− mice (AQP1: 28 kDa; GAPDH: 37 kDa). D) Representative immunolabeling of AQP1 (red; DAPI in blue) of choroid plexus from WT and AQP1−/− mice. E) Representative volume response to an osmotic challenge of +100 mOsm (indicated by arrow) in WT and AQP1−/− choroid plexus loaded with the fluorescent dye calcein (example micrograph shown in inset, scale bar = 60 µm) with quantification of the rate of volume changes in (F), n = 5 WT and n = 4 AQP1−/−. G) Representative ventriculo‐cisternal perfusion time course of the dextran ratio (outflow/inflow) in a WT and AQP1−/− mouse with summarized CSF production rates, obtained from the average of the time points indicated in a dashed box, n  =  8 of each. H) Brain water content in WT and AQP1−/− mice, n  =  6. I) Representative MRI scans of WT and AQP1−/‐mice (3D projections and horizontal plane) with J) lateral ventricular volume quantification, n = 6 WT and 5 AQP1−/−. K) Representative intracranial pressure (ICP) trace obtained in WT and AQP1−/‐ mice, with summarized ICP values illustrated in inset, n  =  6 of each. Statistical evaluation with Student's t‐test. *; P <0.05, ns; not significant.
Figure 2
Figure 2
Viral knockdown of choroid plexus AQP1 does not modulate CSF dynamics. A) Representative targeting of GFP (green) to the mouse choroid plexus after intraventricular delivery of AAV5‐GFP. B) Western blotting of choroid plexus (CP) and hippocampal (Hip) lysates after intraventricular delivery of AAV5‐GFP (GFP, green, 25 kDa; GAPDH, red, 37 kDa), n = 4 mice. C) Schematic of the AAV‐Cre approach employed to knock down AQP1 in choroid plexus of AQP1flox/flox mice. D) mRNA expression levels of AQP1 normalized to a reference gene in mouse choroid plexus from control (AAV‐GFP‐injected) and AQP1‐KD (AAV‐Cre‐injected) mice 1–3 weeks (1‐3 W) post‐injection, n = 3 control, n = 5 AQP1‐KD, 1 week, n = 4 AQP1‐KD, 2–3 weeks, ns above the bars refers to lack of statistical difference of controls compared to week 1 and lines above the histograms refer to statistical difference between control and AQP1‐KD mice. E) Representative immunolabeling of AQP1 (magenta, DAPI in blue) in choroid plexus of a control (AAV‐GFP) and an AQP1‐KD (AAV‐Cre) mouse, n = 3 of each. F) Choroid plexus AQP1 protein expression of AQP1‐KD and control mice 3 weeks post‐injection with Western blot of AQP1 (green, 28 kDa) and GAPDH (red, 37 kDa) in insert above the histogram, representative experiment with n = 3 mice (out of 3 independent experiments, see Figure S2G, Supporting Information, for other Western blots). G) Representative ventriculo‐cisternal perfusion time course of the dextran ratio (outflow/inflow) in a control (AAV‐GFP) and an AQP1‐KD (AAV‐Cre) mouse three weeks after injection, with summarized CSF production rates, obtained from the average of the time points indicated in a dashed box, n  =  6 of each. H) Brain water content of control (AAV‐GFP) and AQP1‐KD (AAV‐Cre) mice, 3 weeks post‐injection, n  =  5 of each. I) Representative MRI brain scans of control (AAV‐GFP) and AQP1‐KD (AAV‐Cre) mice, 3 weeks post‐injection (3D projections and horizontal) with J) lateral ventricular volume quantification, n = 5 of each. Statistical evaluation with one‐way ANOVA with Sidak's multiple comparison post hoc test (panel D) or Student's t‐test (remaining panels). **; P < 0.01, ***; P < 0.001, ns; not significant.
Figure 3
Figure 3
Viral knockdown of NKCC1 in the choroid plexus reduces CSF secretion and ventricular volume. A) Schematic of the AAV‐Cre approach employed to knock down NKCC1 in choroid plexus of SLC12A2flox/flox mice. B) mRNA expression levels of NKCC1 normalized to reference genes in mouse choroid plexus from control (AAV‐GFP‐injected) and NKCC1‐KD (AAV‐Cre‐injected) mice 1–3 weeks (1‐3 W) after injection, n = 3 for 1–2 weeks and n = 5 for 3 weeks, ns above the bars refers to lack of statistical difference of controls compared to week one and lines above the histograms refer to statistical difference between control and NKCC1‐KD mice. C) Representative immunolabeling of NKCC1 (red, DAPI in blue) in choroid plexus of control and NKCC1‐KD mice, n = 3 of each. D) Choroid plexus NKCC1 protein expression of NKCC1‐KD and control mice three weeks after injection with Western blot of NKCC1 (green, 150 kDa) and GAPDH (red, 37 kDa) in insert above the histogram, representative experiment with n = 3 mice (out of 3 independent experiments, see Figure S3E (Supporting Information) for other Western blots). E) Representative electron microscopy micrographs of choroid plexus from control and NKCC1‐KD mice. mv: microvilli; tj: tight junction; bm: basal membrane; bi: basolateral infoldings; mi: mitochondria; nuc: nucleus; vl: ventricular lumen; cap: blood capillary. F) Representative MRI brain scans of control and NKCC1‐KD mice, three weeks post‐AAV injection (3D projections and horizontal) with G) lateral ventricular volume quantification, n = 5. H) Representative ventriculo‐cisternal perfusion time course of the dextran ratio (outflow/inflow) in a control (AAV‐GFP) and an NKCC1‐KD (AAV‐Cre) mouse 3 weeks post‐AAV injection, with summarized CSF production rates, obtained from the average of the time points indicated in a dashed box, n  =  6 of each. I) ICP measurements in control and NKCC1‐KD mice, 3 weeks post‐AAV injection, n  = 8 control and n = 6 NKCC1‐KD. Statistical evaluation with one‐way ANOVA with Sidak's multiple comparison post hoc test (panel B) or Student's t‐test (remaining panels). **; P < 0.01, ***; P < 0.001, ns; not significant.
Figure 4
Figure 4
Elevation of [K+]CSF modulates NKCC1 and Na+/K+‐ATPase activity while maintaining stable CSF secretion. A) Efflux of 86Rb+ from mouse choroid plexus in control aCSF (2.5 mm K+) without or with NKCC1 inhibition by bumetanide (BUM), n = 6 of each with efflux rate constants for 86Rb+ in insert. B) Bumetanide‐sensitive (NKCC1‐mediated) efflux rate constants for 86Rb+ with increasing [K+], n = 4 for 5 mm and n = 6 for remaining groups. C) Influx of 86Rb+ from mouse choroid plexus in control aCSF (2.5 mm K+) without or with NKCC1 inhibition by bumetanide (BUM), n = 6. D) Bumetanide‐sensitive (NKCC1‐mediated) influx of 86Rb+ with increasing [K+], n = 6 of each. E) Influx of 86Rb+ in mouse choroid plexus in control aCSF (2.5 mm K+) without or with Na+/K+‐ATPase inhibition by ouabain (OUAB), n = 6 of each. F) Ouabain‐sensitive (Na+/K+‐ATPase‐mediated) influx of 86Rb+ with increasing [K+], n = 6 of each. G) Summarized CSF production rates in mice with increasing [K+] in the infusion solution (final ventricular [K+] of 1.5 – 10 mm), n = 4 of each. H) Schematic depicting K+‐induced reversal of NKCC1‐mediated net transport combined with the increased Na+/K+‐ATPase‐mediated transport, yielding constant CSF production rate. Statistical evaluation with Student's t‐test (Panels A,C,E) or one‐way ANOVA with Tukey's post hoc test (Panels B,D,F,G). *; P < 0.05, ***; P < 0.001, ns; not significant.
Figure 5
Figure 5
Patients with subarachnoid hemorrhage display undisturbed [K+]CSF. A) [K+] in CSF sampled upon placement and removal of an EVD from patients with posthemorrhagic hemorrhage (PHH) following subarachnoid hemorrhage, n = 32 and during preventive clipping of an unruptured aneurysm (Ctrls), n = 14. B) [K+] in CSF from shunted patients with subarachnoid hemorrhage (n = 12) versus those successfully weaned from the EVD (n = 20). C) [K+]CSF in start samples (upon EVD placement) and end samples (upon removal of EVD) in CSF from shunted patients, with the delta [K+]CSF on the right (n = 12). D) [K+]CSF in start samples (upon EVD placement) and end samples (upon removal of EVD) in CSF from weaned patients, with the delta [K+]CSF on the right (n = 19). Statistical evaluation with Student's t‐test or one sample t‐test (delta [K+]CSF). *; P < 0.05, ns; not significant.

Similar articles

Cited by

References

    1. Rubin R. C., Henderson E. S., Ommaya A. K., Walker M. D., Rall D. P., J. Neurosurg. 1966, 25, 430. - PubMed
    1. Dandy W. E., Ann. Surg. 1919, 70, 129. - PMC - PubMed
    1. de Rougemont J., Ames A. III, Nesbett F. B., Hofmann H. F., J. Neurophysiol. 1960, 23, 485. - PubMed
    1. MacAulay N., Keep R. F., Zeuthen T., Fluids Barriers CNS 2022, 19, 26. - PMC - PubMed
    1. Welch K., Am. J. Physiol. 1963, 205, 617. - PubMed

LinkOut - more resources