

Tyrosine phosphatase SHP2 promoted the progression of CRC via modulating the PI3K/BRD4/TFEB signaling induced ferroptosis
- PMID: 39692787
- PMCID: PMC11655821
- DOI: 10.1007/s12672-024-01586-w
Tyrosine phosphatase SHP2 promoted the progression of CRC via modulating the PI3K/BRD4/TFEB signaling induced ferroptosis
Abstract
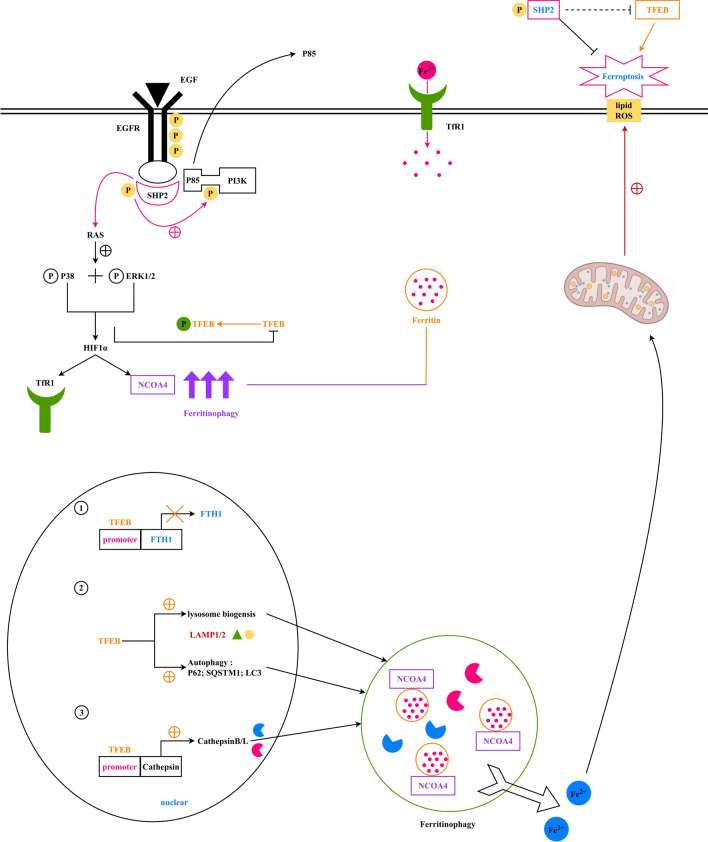
Objective: To elucidate the mechanism by which tyrosine phosphatase SHP2 protects CRC through modulation of TFEB-mediated ferritinophagy, thereby suppressing ROS and ferroptosis.
Methods: SW480 and SW620 cells, in the logarithmic growth phase, were treated with or without the SHP2 inhibitor PHPS1, the activator Trichomide A, EGF, or MMP inhibitors, and randomly assigned to four groups. Additionally, SW480 cells in the logarithmic phase underwent treatments with EGF, the ferroptosis inducer erastin, Trichomide A, or the curcumin analog C1, forming seven groups. Cell migration assessment in these groups employed scratch and Transwell assays. Protein expression analysis of total SHP2, total PI3K, p-SHP2, p-PI3K, p-TFEB, TFEB, SQSTM1, LC3, LAMP2, NCOA4, FTH1, GPX4, NOX4, and ACSL4 in the seven SW480 groups was conducted through Western blot and immunofluorescence. Apoptosis analysis was performed on these seven groups, while gene co-expression analysis utilized bioinformatics. SW480 and CCD-841CoN cells were categorized into four groups, undergoing treatment with saline, EGFR-OE lentivirus, SHP2-KD lentivirus, or SHP2-OE lentivirus. Western blot analysis in SW480 cells detected EGFR, total SHP2, p-SHP2, GPX4, and ACSL4 proteins, and tumor volume observations were conducted in a nude mouse xenograft model. Western blot also evaluated total SHP2, p-SHP2, GPX4, and ACSL4 protein expression in CCD-841CoN cells.
Results: Bioinformatics analysis revealed correlations between EGFR and SHP2, SHP2 and PIK3CA, SHP2 and MAPK1, BRK4 and HIF1A, HIF1A and NCOA4, as well as TFEB and FTH1. Scratch and Transwell assays showed that SHP2 diminishes the migratory capacity of SW480 and SW620 cells. Western blot and immunofluorescence demonstrated that EGFR activation of SHP2 markedly elevated p-TFEB levels while reducing TFEB protein expression. EGF stimulation enhanced the expression of FTH1, GPX4, NOX4, and ACSL4. Combined stimulation with EGF and SHP2 further amplified the expression of p-SHP2, p-TFEB, and NCOA4 while reducing TFEB, SQSTM1, LC3, and LAMP2. Erastin augmented FTH1, GPX4, NOX4, and ACSL4 expression while decreasing p-SHP2, p-TFEB, TFEB, SQSTM1, LC3, LAMP2, and NCOA4. TFEB activation suppressed p-SHP2, p-TFEB, NCOA4, FTH1, and GPX4 expression, while promoting TFEB, SQSTM1, LC3, LAMP2, NOX4, and ACSL4 expression. Apoptosis assays indicated that SHP2 activation decelerated apoptosis in SW480 cells, whereas erastin under EGF stimulation accelerated apoptosis, as did TFEB activation. Western blot results in SW480 cells displayed that overexpression of EGFR or SHP2 significantly increased total SHP2, p-SHP2, and GPX4 expression while decreasing ACSL4 levels. SHP2 knockdown decreased total SHP2, p-SHP2, and GPX4 expression, with an increase in ACSL4 expression. In CCD-841CoN cells, overexpression of EGFR or SHP2 resulted in a decrease in p-SHP2 and an increase in total SHP2, more pronounced with SHP2 overexpression, while GPX4 and ACSL4 levels remained stable. SHP2 knockdown led to reduced EGFR, total SHP2, p-SHP2, and GPX4 expression, without a significant impact on ACSL4 levels. The nude mouse xenograft model demonstrated that EGFR overexpression significantly increased tumor size, whereas SHP2 overexpression markedly decreased tumor volume. SHP2 knockdown resulted in significantly larger tumors.
Conclusion: SHP2 advances CRC progression by modulating TFEB-mediated ferritinophagy, suppressing ROS and ferroptosis. Targeting SHP2 presents a promising therapeutic strategy for CRC.
Keywords: CRC; Ferritinophagy; Ferroptosis; SHP2; TFEB.
© 2024. The Author(s).
Conflict of interest statement
Declarations. Ethics approval and consent to participate: This study has been People’s Liberation Army by the Medical Ethics Committee of the 980 Hospital of the Joint Logistics Support Unit. Medical Ethics Committee of the 98O Hospital of the Joint Logistics Support Force of the People's Liberation Army of China (2024-KY-87). Competing interests: The authors declare no competing interests.
Figures


Similar articles
-
ACSL4 Regulates LPS-Induced Ferroptosis in Cardiomyocytes through FASN.Ann Clin Lab Sci. 2024 Nov;54(6):756-764. Ann Clin Lab Sci. 2024. PMID: 39855747
-
[Improving effect of selenium on spermatogenesis in mice with cyclophosphamide-induced spermatogenic impairment and its underlying mechanism].Zhonghua Nan Ke Xue. 2024 Apr;30(4):291-299. Zhonghua Nan Ke Xue. 2024. PMID: 39210414 Chinese.
-
β-Elemene induced ferroptosis via TFEB-mediated GPX4 degradation in EGFR wide-type non-small cell lung cancer.J Adv Res. 2024 Aug;62:257-272. doi: 10.1016/j.jare.2023.08.018. Epub 2023 Sep 7. J Adv Res. 2024. PMID: 37689240 Free PMC article.
-
Sodium butyrate induces ferroptosis in colorectal cancer cells by promoting NCOA4-FTH1-mediated ferritinophagy.Int Immunopharmacol. 2025 Jul 12;163:115188. doi: 10.1016/j.intimp.2025.115188. Online ahead of print. Int Immunopharmacol. 2025. PMID: 40652583
-
Ferroptosisand Its Role in the Treatment of Sepsis-Related Organ Injury: Mechanisms and Potential Therapeutic Approaches.Infect Drug Resist. 2024 Dec 20;17:5715-5727. doi: 10.2147/IDR.S496568. eCollection 2024. Infect Drug Resist. 2024. PMID: 39720615 Free PMC article. Review.
Cited by
-
Targeting SHP2: Dual breakthroughs in colorectal cancer therapy-from signaling pathway modulation to immune microenvironment remodeling.World J Gastrointest Oncol. 2025 Jul 15;17(7):107380. doi: 10.4251/wjgo.v17.i7.107380. World J Gastrointest Oncol. 2025. PMID: 40697246 Free PMC article. Review.
References
-
- Sazin Y, et al. Association between adherence to a dietary approach to stop hypertension and the Mediterranean diets and risk of colorectal cancer: a matched case-control study. Clinical Nutrition ESPEN. 2024;60:195–202. - PubMed
-
- Ciardiello F, et al. Clinical management of metastatic colorectal cancer in the era of precision medicine. CA Cancer J Clin. 2022;72(4):372–401. - PubMed
Grants and funding
LinkOut - more resources
Full Text Sources
Research Materials
Miscellaneous