

Interferon-stimulated gene subtypes as key indicators of immune landscape and survival outcomes in ovarian cancer
- PMID: 39692913
- PMCID: PMC11655714
- DOI: 10.1007/s12672-024-01617-6
Interferon-stimulated gene subtypes as key indicators of immune landscape and survival outcomes in ovarian cancer
Abstract
Purpose: Ovarian cancer (OV) remains the most lethal gynecological malignancy, underscoring the critical need for robust prognostic biomarkers to enhance patient outcomes. In this study, we classified OV patients by their interferon-stimulated gene (ISG) expression profiles and investigated the associations between these subtypes, the immune microenvironment, and survival outcomes.
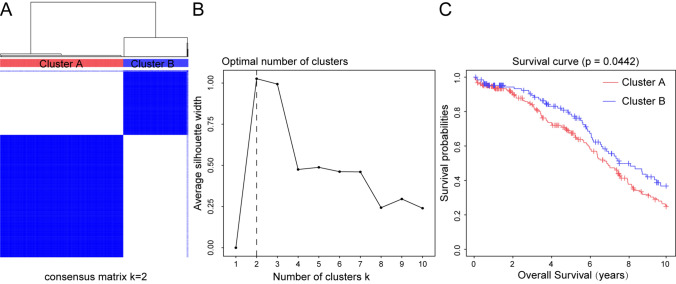
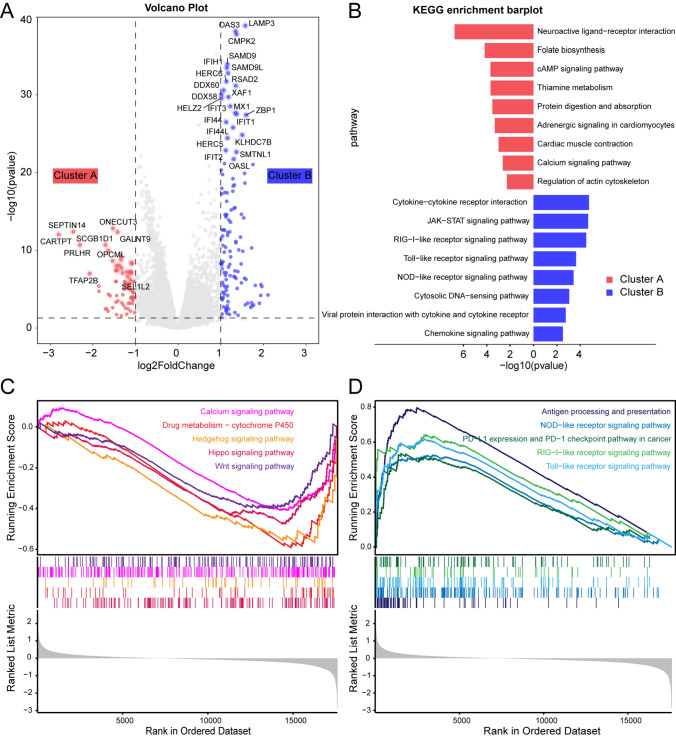
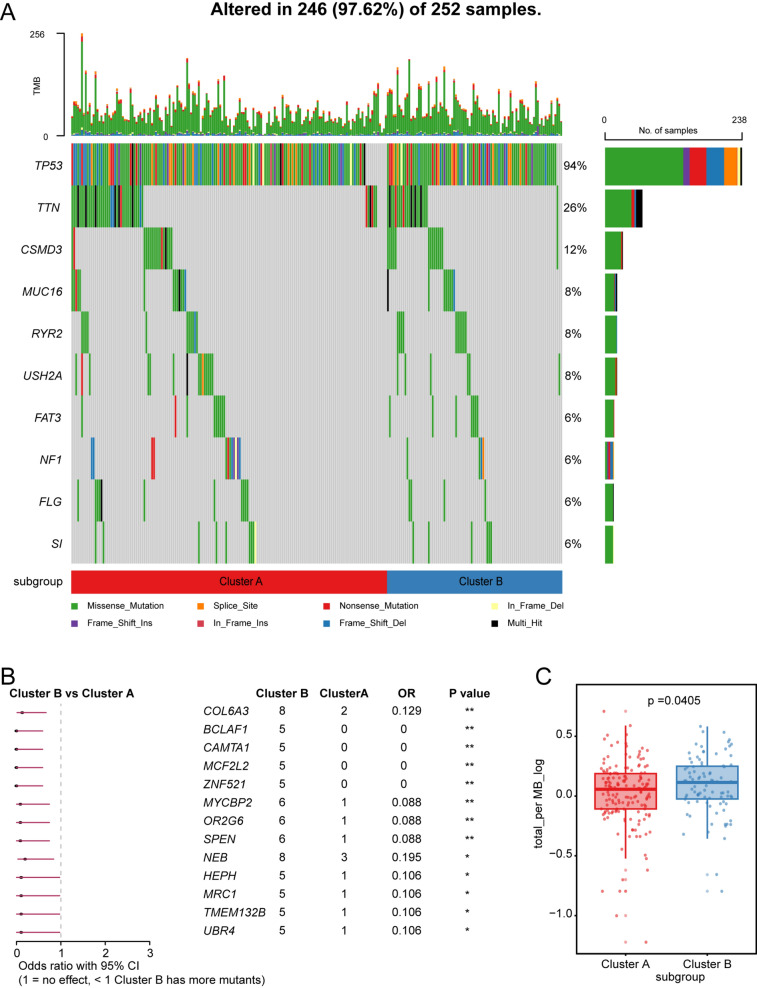
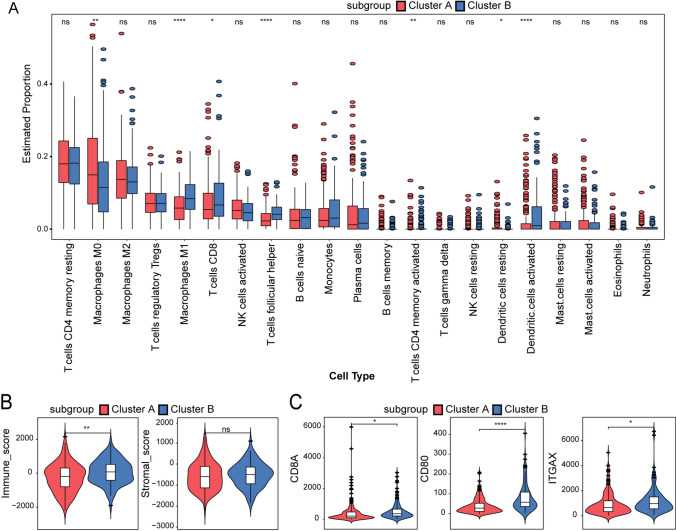
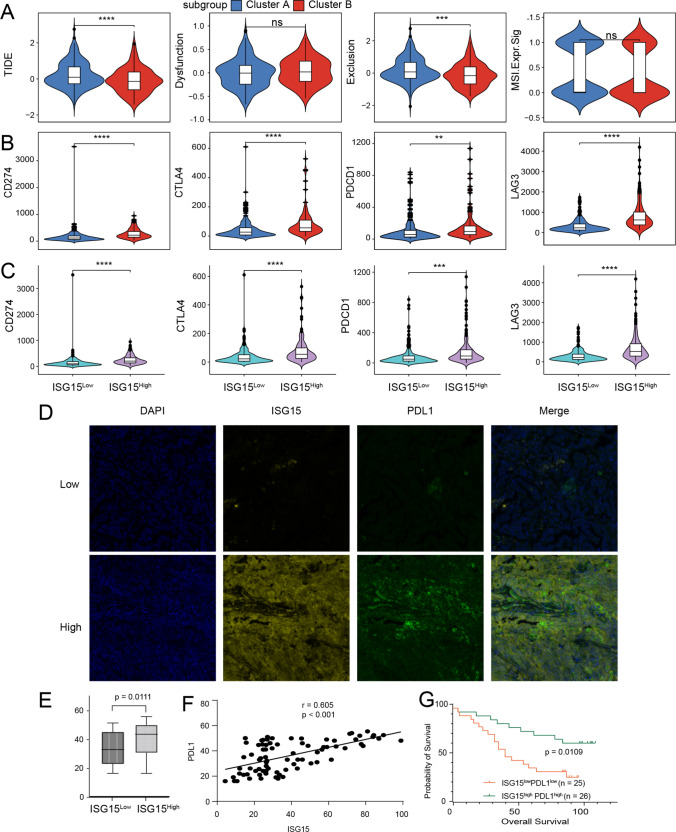
Methods: We employed consensus clustering in the TCGA-OV cohort (n = 376) to classify patients into ISG-related subgroups. Survival analysis, differential gene expression (DESeq), KEGG and GSEA pathway enrichment analyses, genomic variation assessments, immune cell profiling using the CIBERSORT algorithm, and TIDE analysis were conducted in the TCGA-OV cohort. In addition, immune checkpoint marker expressions were assessed using data from the TCGA-OV cohort and multiplex immunofluorescence (mIF) staining on an independent cohort (n = 80).
Results: Two distinct ISG subtypes were identified: ISG Cluster A and ISG Cluster B. Patients in ISG Cluster B exhibited significantly improved overall survival (OS) (p = 0.0442). A total of 328 dysregulated genes were identified, with Cluster B showing overexpression of immune-related genes and enhanced involvement in immune signaling pathways. ISG Cluster B also presented higher tumor mutation burden (TMB) and an enriched immune profile, including M1 macrophages and CD8 + T cells. TIDE analysis indicated a more favorable response to immune checkpoint inhibitors in this cluster, corroborated by high expressions of PD-L1 and ISG15, which were associated with prolonged OS.
Conclusions: Our findings demonstrate that ISG-related subtypes are significantly associated with the immune microenvironment and survival outcomes in OV. The biomarkers identified in this study have the potential to inform precision therapy development, thereby enhancing treatment efficacy and personalized care for OV patients.
Keywords: Immune microenvironment; Interferon stimulated genes; Ovarian cancer.
© 2024. The Author(s).
Conflict of interest statement
Declarations. Ethics approval and consent to participate: This study was approved by Institutional Review Board of Guangdong Provincial People’s Hospital, Guangdong Academy of Medical Sciences, Guangzhou (KY-Q-2021-097-04). Competing interests: The authors declare no competing interests.
Figures
Similar articles
-
Peripherally-driven myeloid NFkB and IFN/ISG responses predict malignancy risk, survival, and immunotherapy regime in ovarian cancer.J Immunother Cancer. 2021 Nov;9(11):e003609. doi: 10.1136/jitc-2021-003609. J Immunother Cancer. 2021. PMID: 34795003 Free PMC article.
-
The Interaction between Intratumoral Microbiome and Immunity Is Related to the Prognosis of Ovarian Cancer.Microbiol Spectr. 2023 Mar 28;11(2):e0354922. doi: 10.1128/spectrum.03549-22. Online ahead of print. Microbiol Spectr. 2023. PMID: 36975828 Free PMC article.
-
Identification of the Immune Signatures for Ovarian Cancer Based on the Tumor Immune Microenvironment Genes.Front Cell Dev Biol. 2022 Mar 17;10:772701. doi: 10.3389/fcell.2022.772701. eCollection 2022. Front Cell Dev Biol. 2022. PMID: 35372348 Free PMC article.
-
A clinical prognostic model of oxidative stress-related genes linked to tumor immune cell infiltration and the prognosis of ovarian cancer patients.Heliyon. 2024 Mar 21;10(7):e28442. doi: 10.1016/j.heliyon.2024.e28442. eCollection 2024 Apr 15. Heliyon. 2024. PMID: 38560253 Free PMC article.
-
5 signature genes revealed by single-cell profiling identified unique immune subtypes affecting the prognosis of ovarian cancer.Eur Rev Med Pharmacol Sci. 2024 Mar;28(5):2051-2062. doi: 10.26355/eurrev_202403_35618. Eur Rev Med Pharmacol Sci. 2024. PMID: 38497886
References
-
- Kuroki L, et al. Treatment of epithelial ovarian cancer. BMJ. 2020;371:m3773. - PubMed
-
- Webb PM, Jordan SJ. Global epidemiology of epithelial ovarian cancer. Nat Rev Clin Oncol. 2024;21:389–400. - PubMed
-
- Bray F, et al. Global cancer statistics 2022: GLOBOCAN estimates of incidence and mortality worldwide for 36 cancers in 185 countries. CA Cancer J Clin. 2024;74:229–63. - PubMed
-
- Lheureux S, et al. Epithelial ovarian cancer: evolution of management in the era of precision medicine. CA Cancer J Clin. 2019;69:280–304. - PubMed
-
- Kandalaft LE, et al. Immunobiology of high-grade serous ovarian cancer: lessons for clinical translation. Nat Rev Cancer. 2022;22:640–56. - PubMed
Grants and funding
LinkOut - more resources
Full Text Sources
Research Materials
Miscellaneous