. 2024 Dec 18:12:RP87369.
doi: 10.7554/eLife.87369.

A large-scale proteomics resource of circulating extracellular vesicles for biomarker discovery in pancreatic cancer

Affiliations

A large-scale proteomics resource of circulating extracellular vesicles for biomarker discovery in pancreatic cancer

Bruno Bockorny et al. Elife. .

Abstract

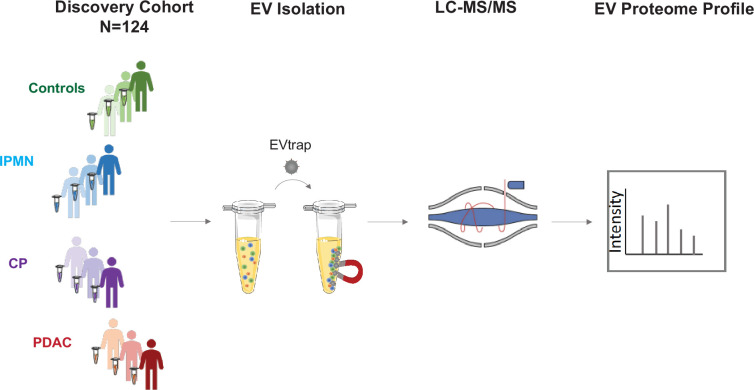
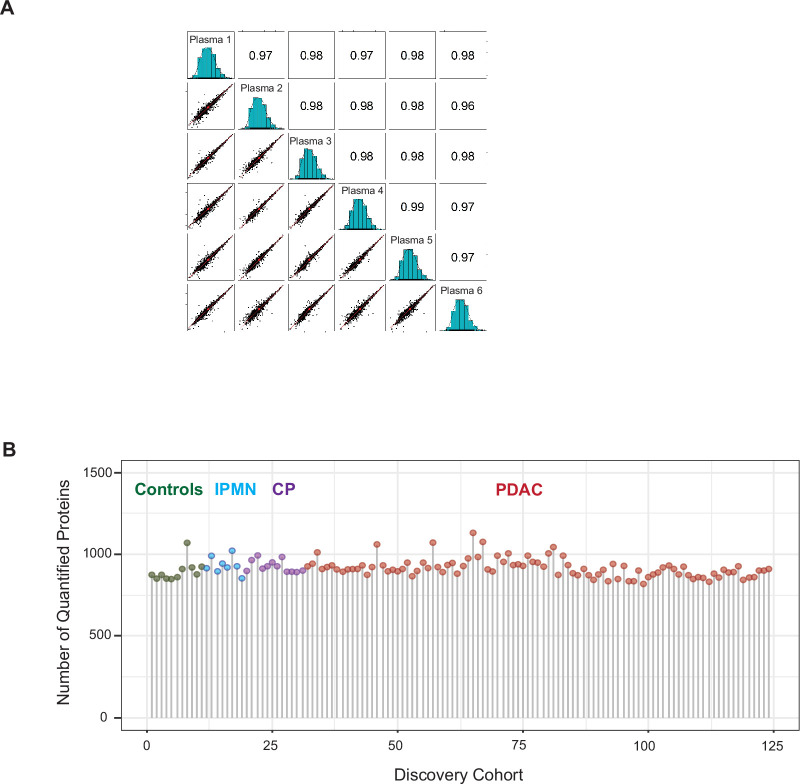
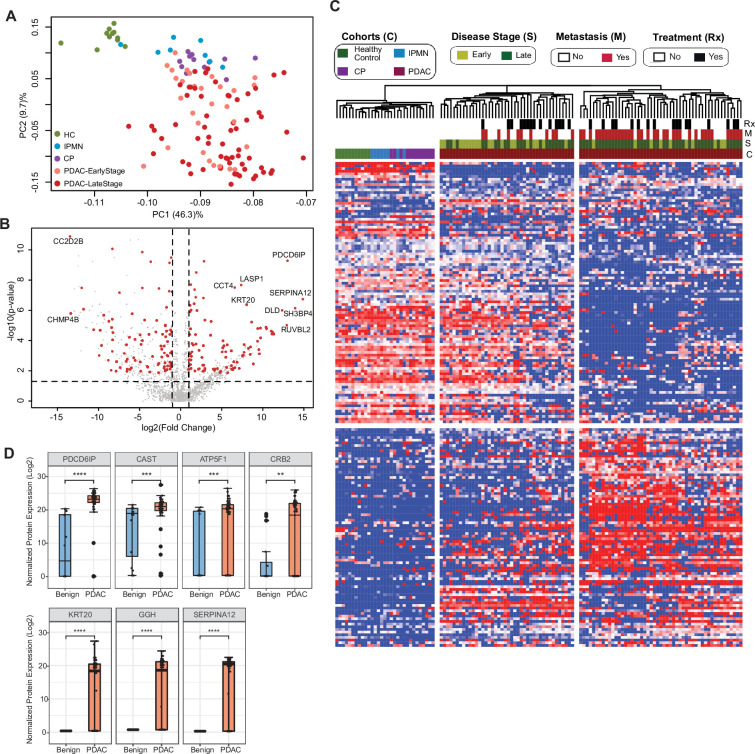
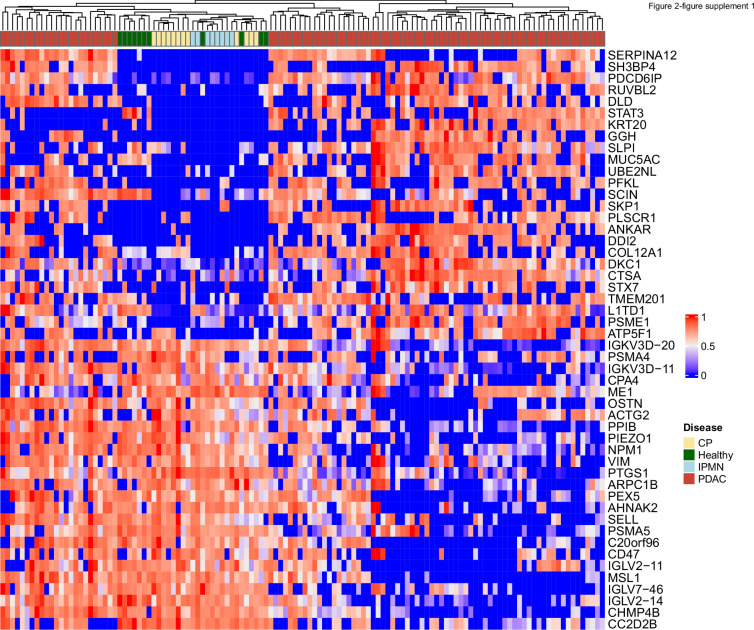
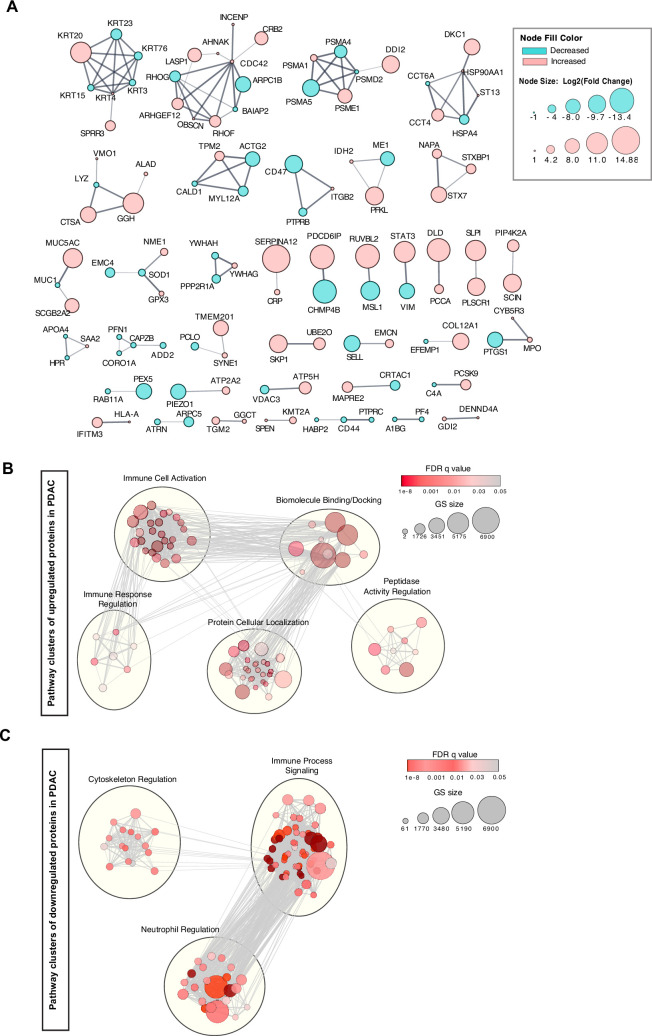
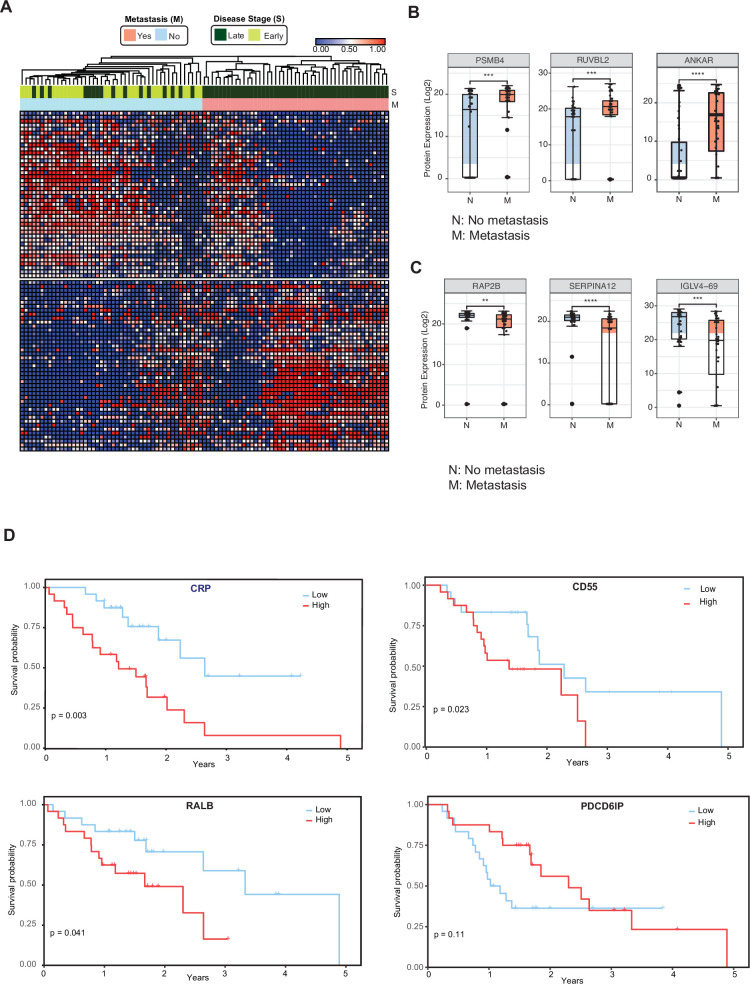
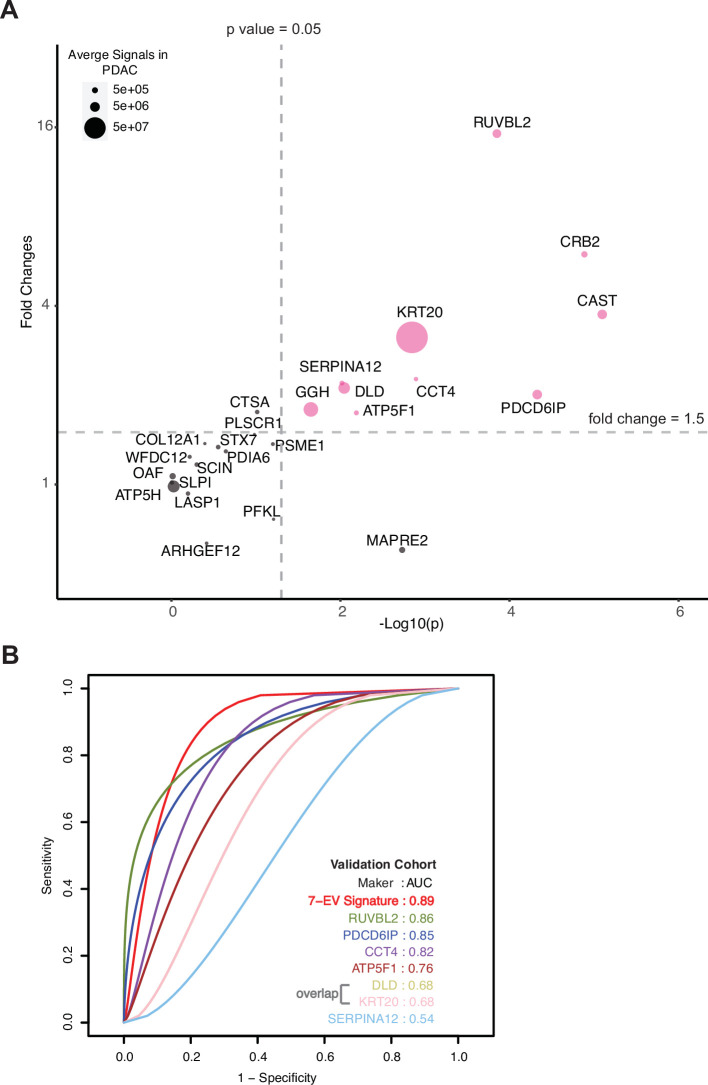
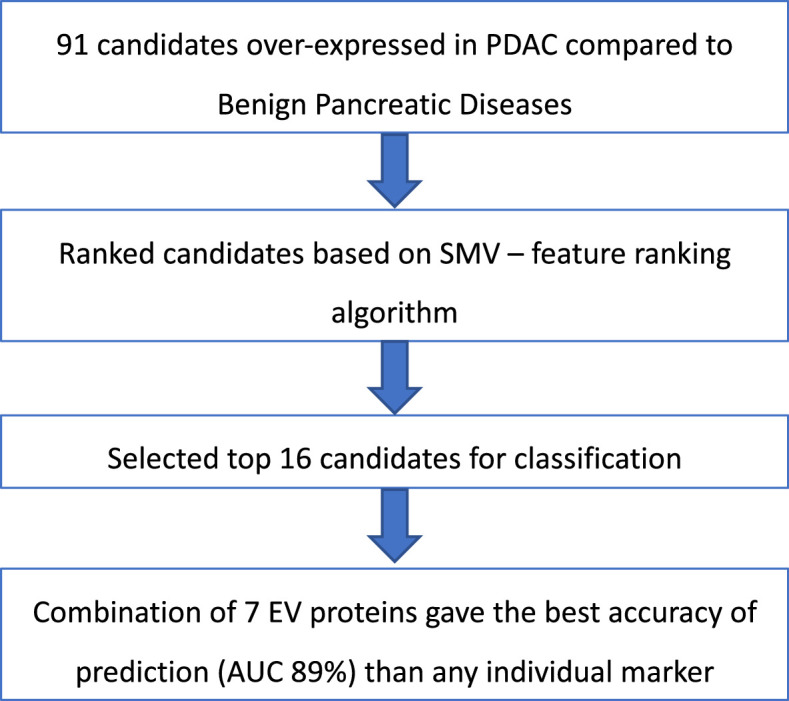
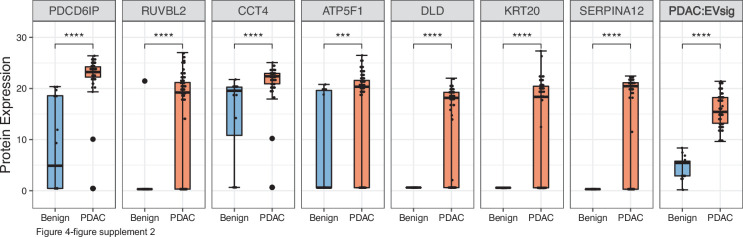
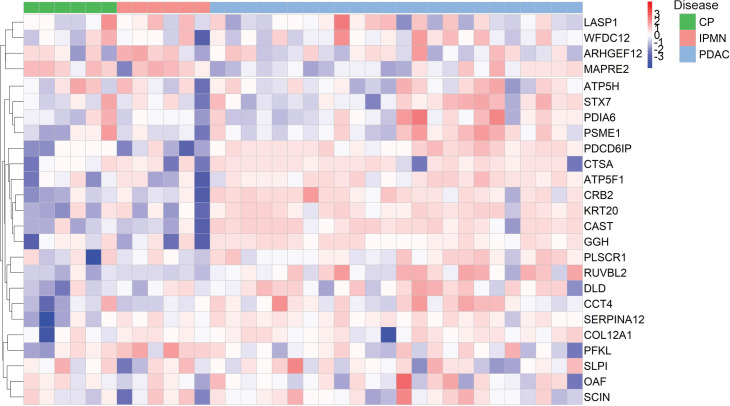
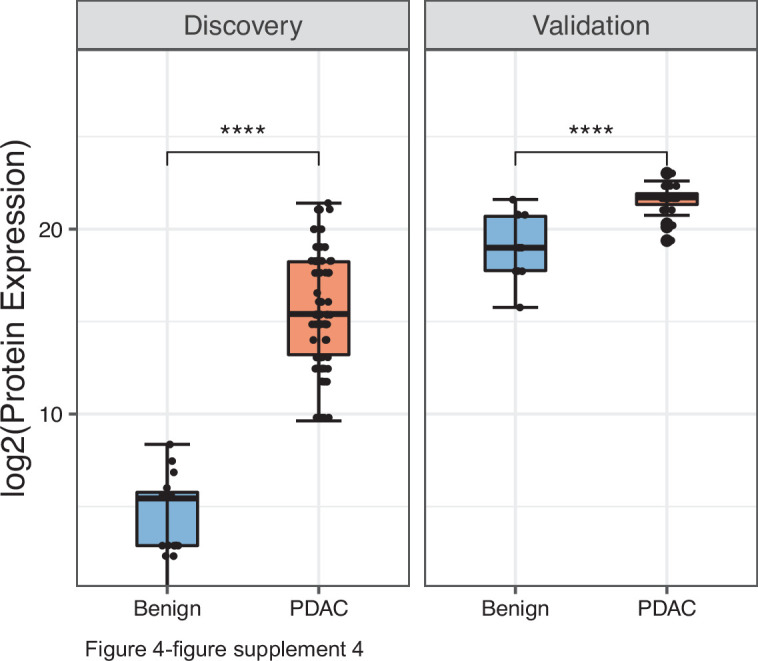
Pancreatic cancer has the worst prognosis of all common tumors. Earlier cancer diagnosis could increase survival rates and better assessment of metastatic disease could improve patient care. As such, there is an urgent need to develop biomarkers to diagnose this deadly malignancy. Analyzing circulating extracellular vesicles (cEVs) using 'liquid biopsies' offers an attractive approach to diagnose and monitor disease status. However, it is important to differentiate EV-associated proteins enriched in patients with pancreatic ductal adenocarcinoma (PDAC) from those with benign pancreatic diseases such as chronic pancreatitis and intraductal papillary mucinous neoplasm (IPMN). To meet this need, we combined the novel EVtrap method for highly efficient isolation of EVs from plasma and conducted proteomics analysis of samples from 124 individuals, including patients with PDAC, benign pancreatic diseases and controls. On average, 912 EV proteins were identified per 100 µL of plasma. EVs containing high levels of PDCD6IP, SERPINA12, and RUVBL2 were associated with PDAC compared to the benign diseases in both discovery and validation cohorts. EVs with PSMB4, RUVBL2, and ANKAR were associated with metastasis, and those with CRP, RALB, and CD55 correlated with poor clinical prognosis. Finally, we validated a seven EV protein PDAC signature against a background of benign pancreatic diseases that yielded an 89% prediction accuracy for the diagnosis of PDAC. To our knowledge, our study represents the largest proteomics profiling of circulating EVs ever conducted in pancreatic cancer and provides a valuable open-source atlas to the scientific community with a comprehensive catalogue of novel cEVs that may assist in the development of biomarkers and improve the outcomes of patients with PDAC.

Keywords: biomarker; cancer biology; extracellular vesicles; human; pancreatic cancer; pancreatitis.


Conflict of interest statement

BB, LM, LH, WT, MH, AI, SM Inventor on a pending patent application (US20220291222A1) for pancreatic cancer detection, based on data generated from this publication, MH, CM, LT, RG, JW, AB, RB, SP, MS, SF No competing interests declared, JG Employee of Agenus Inc, SN Employee of Deciphera Pharmaceuticals

Figures

Figure 1.
Figure 1.. Study design.
The discovery cohort was comprised of 124 individuals, including pancreatic ductal adenocarcinoma (PDAC, N=93), chronic pancreatitis (CP, N=12), intraductal papillary mucinous neoplasm (IPMN, N=8) and healthy controls (N=11). Plasma samples were processed for EV isolation using EVtrap and analyzed by liquid chromatography-tandem mass spectrometry (LC-MS/MS).
Figure 1—figure supplement 1.
Figure 1—figure supplement 1.. EVtrap isolation of extracellular vesicles.
(A) Transmission electron microscopy (TEM) images collected of a single EV and multiple EVs captured from plasma by EVtrap. TEM imaging of EVs was carried out on a HITACHI H-8100 electron microscope (Hitachi, Tokyo, Japan) with an accelerating applied potential of 200 kV. (B) Nanoparticle tracking analysis (NTA) of EVs after elution off EVtrap beads. NTA was carried out using ZetaView instrument (Particle Metrix) after calibration with 100 nm polystyrene particles.
Figure 1—figure supplement 2.
Figure 1—figure supplement 2.. EV proteomics analytical performance.
(A) Reproducibility of the method. A standard plasma sample was processed in six replicates and performed a Pearson correlation analysis that revealed a very high correlation between replicates. (B) Number of quantified EV proteins per sample according to different patient cohort.
Figure 2.
Figure 2.. Identification of cEV proteins differentially expressed in disease groups.
(A) Principal component analysis of cEV proteins differentially expressed in the plasma of patients with pancreatic diseases compared to controls. Each dot indicates one individual enrolled in the study: green, controls; blue, patients with intraductal papillary mucinous neoplasm (IPMN); purple, patients with chronic pancreatitis (CP); salmon, early stage (stages I and II) pancreatic ductal adenocarcinoma (PDAC); red, late stage (stages III and IV) PDAC. (B) Volcano plot of circulating EV proteins enriched in the plasma of patients with PDAC versus benign pancreatic diseases. X-axis, log base 2 of fold changes; Y-axis, negative of the log base 10 of p values. (C) Heatmap of cEV proteins differentially expressed in the plasma of patients with pancreatic diseases compared to controls. Designations of clinical parameters were indicated at the top of the heatmap. (D) Expression of enriched cEV proteins in patients with PDAC (N=93) versus benign pancreatic diseases (N=20). Each dot indicates the target protein signal from one patient. Y-axis, normalized log base 2 of protein signals detected by mass spectrometry; Error bars, min and max values; lines in boxes, median values. * p≤0.05, ** p≤0.01, *** p≤0.001, **** p≤0.0001.
Figure 2—figure supplement 1.
Figure 2—figure supplement 1.. Heatmap of abundance of 25 proteins enriched and 25 proteins reduced in EVs from PDAC patients compared to EVs from patients without cancer.
Protein abundances were normalized across patients for each protein.
Figure 2—figure supplement 2.
Figure 2—figure supplement 2.. Network analyses of cEV proteins differentially expressed in PDAC compared to benign pancreatic diseases.
(A) Functional association of proteins identified by STRING database. Red, cEV proteins enriched in PDAC patients as compared to benign pancreatic diseases. Green, cEV proteins decreased in patients with PDAC as compared to benign pancreatic diseases. Red, cEV proteins increased in PDAC as compared to benign pancreatic diseases. Thickness of lines indicate confidence of association. (B, C) Clustering of cEV protein pathways enriched (B) or downregulated (C) in PDAC cohorts. Pathways were identified using Gene Ontology database and REACTOME database.
Figure 3.
Figure 3.. Circulating EV proteomics reveal markers associated with metastasis and worse prognosis.
(A) Heatmap showing EV proteins differentially expressed in the plasma of metastatic versus non-metastatic PDAC. Designations of clinical parameters are indicated at the top of the heatmap. (B) Expression patterns of cEV proteins associated with metastatic disease. Y-axis, normalized log base 2 of protein signals detected by mass spectrometry; N, non-metastatic PDAC group (N=46); M, metastatic PDAC group (N=47). Each dot indicated the target protein signal from one patient. Error bars, min and max values; lines in boxes, median values. * p≤0.05, ** p≤0.01, *** p≤0.001, **** p≤0.0001. (C) As is (B), except for cEV markers with increased expression in non-metastatic PDAC. (D) Correlation of cEV marker expression with survival. Kaplan–Meier curves and log-rank test p values of representative survival cEV markers quantified in the discovery cohort.
Figure 4.
Figure 4.. Validation of cEV markers and identification of seven EV protein signature for PDAC diagnosis.
(A) Differences of cEV protein abundances between patients with PDAC (n=24) and benign pancreatic diseases (chronic pancreatitis and IPMN) (n=12). x axis, minus log p values of protein abundance differences between PDAC and benign groups; y axis, average fold changes of proteins in PDAC group compared to benign group. Size of bubbles indicate average protein abundances in PDAC group. Pink color, proteins that had at least twofold enrichment in PDAC group (p<0.05). (B) ROC curves were calculated for individual cEV markers as well as for the seven EV protein PDAC signature combination to determine optimum diagnostic performance.
Figure 4—figure supplement 1.
Figure 4—figure supplement 1.. Summary of selection process to develop EV signature for pancreatic cancer diagnosis.
Figure 4—figure supplement 2.
Figure 4—figure supplement 2.. Diagnostic performance of the seven EV protein signature compared to performance of each of the seven individual marker in patients with benign pancreatic diseases (N=12) or PDAC (N=24).
Each dot indicated the target protein signal from one patient. Error bars, min and max values; lines in boxes, median values. * p≤0.05, ** p≤0.01, *** p≤0.001, **** p≤0.0001.
Figure 4—figure supplement 3.
Figure 4—figure supplement 3.. Validation of individual cEV proteins in an independent cohort of patients.
Expression of biomarker candidates detected by Parallel Reaction Monitoring (PRM) analyses. A total of 25 cEV proteins with significant overexpression in PDAC in the discovery cohorts were quantified by PRM in a separate validation cohort of patients.
Figure 4—figure supplement 4.
Figure 4—figure supplement 4.. Performance of PDAC EV signature in both discovery (benign =20, PDAC=93) and validation (benign =12, PDAC=24) cohorts.
Each dot indicated the target protein signal from one patient. Error bars, min and max values; lines in boxes, median values. * p≤0.05, ** p≤0.01, *** p≤0.001, **** p≤0.0001.

Update of

References

    1. Amin MB, Greene FL, Edge SB, Compton CC, Gershenwald JE, Brookland RK, Meyer L, Gress DM, Byrd DR, Winchester DP. The Eighth Edition AJCC Cancer Staging Manual: Continuing to build a bridge from a population-based to a more “personalized” approach to cancer staging. CA. 2017;67:93–99. doi: 10.3322/caac.21388. - DOI - PubMed
    1. Benjamini Y, Hochberg Y. Controlling the false discovery rate: A practical and powerful approach to multiple testing. Journal of the Royal Statistical Society Series B. 1995;57:289–300. doi: 10.1111/j.2517-6161.1995.tb02031.x. - DOI
    1. Bockorny B, Grossman JE, Hidalgo M. Facts and hopes in immunotherapy of pancreatic cancer. Clinical Cancer Research. 2022;28:4606–4617. doi: 10.1158/1078-0432.CCR-21-3452. - DOI - PubMed
    1. Castillo J, Bernard V, San Lucas FA, Allenson K, Capello M, Kim DU, Gascoyne P, Mulu FC, Stephens BM, Huang J, Wang H, Momin AA, Jacamo RO, Katz M, Wolff R, Javle M, Varadhachary G, Wistuba II, Hanash S, Maitra A, Alvarez H. Surfaceome profiling enables isolation of cancer-specific exosomal cargo in liquid biopsies from pancreatic cancer patients. Annals of Oncology. 2018;29:223–229. doi: 10.1093/annonc/mdx542. - DOI - PMC - PubMed
    1. Chen IH, Xue L, Hsu CC, Paez JSP, Pan L, Andaluz H, Wendt MK, Iliuk AB, Zhu JK, Tao WA. Phosphoproteins in extracellular vesicles as candidate markers for breast cancer. PNAS. 2017;114:3175–3180. doi: 10.1073/pnas.1618088114. - DOI - PMC - PubMed

Substances