. 2025 Apr 1;156(7):1439-1456.
doi: 10.1002/ijc.35295. Epub 2024 Dec 18.

A novel mouse model of upper tract urothelial carcinoma highlights the impact of dietary intervention on gut microbiota and carcinogenesis prevention despite carcinogen exposure

Affiliations

A novel mouse model of upper tract urothelial carcinoma highlights the impact of dietary intervention on gut microbiota and carcinogenesis prevention despite carcinogen exposure

Akinaru Yamamoto et al. Int J Cancer. .

Abstract

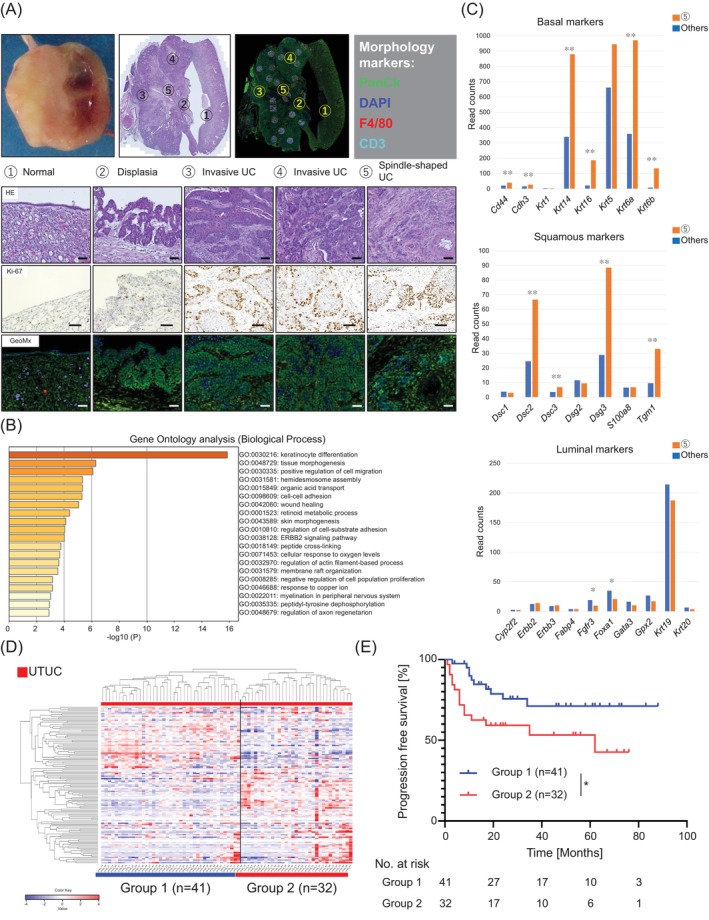
Animal models of N-butyl-N-(4-hydroxy butyl) nitrosamine (BBN)-induced urothelial carcinoma (UC), particularly bladder cancer (BC), have long been established. However, the rare incidence of BBN-induced upper urinary tract UC (UTUC), which originates from the same urothelium as BC, remains elusive. The scarcity of animal models of UTUC has made it challenging to study the biology of UTUC. To address this problem, we tried to establish a novel mouse model of UTUC by treating multiple mice strains and sexes with BBN. The molecular consistency between the UTUC mouse model and human UTUC was confirmed using multi-omics analyses, including whole-exome, whole-transcriptome, and spatial transcriptome sequencing. 16S ribosomal RNA metagenome sequencing, metabolome analysis, and dietary interventions were employed to assess changes in the gut microbiome, metabolome, and carcinogenesis of UTUC. Of all treated mice, only female BALB/c mice developed UTUC over BC. Multi-omics analyses confirmed that the UTUC model reflected the molecular characteristics and heterogeneity of human UTUC with poor prognosis. Furthermore, the model exhibited increased Tnf-related inflammatory gene expression in the upper urinary tract and a low relative abundance of Parabacteroides distasonis in the gut. Dietary intervention, mainly without alanine, led to P. distasonis upregulation and successfully prevented UTUC, as well as suppressed Tnf-related inflammatory gene expression in the upper urinary tract despite the exposure to BBN. This is the first report to demonstrate a higher incidence of UTUC than BC in a non-engineered mouse model using BBN. Overall, this model could serve as a useful tool for comprehensively investigating UTUC in future studies.

Keywords: N‐butyl‐N‐(4‐hydroxybutyl) nitrosamine; animal model; cancer prevention; microbiome; upper tract urothelial carcinoma.


Conflict of interest statement

The authors declare that they have no competing interests.

Figures

FIGURE 1
FIGURE 1
UTUC developed only in BALB/c female mice. (A) BALB/c and C57BL/6j male and female mice were administered 0.05% BBN and BALB/c female control mice were given tap water for 18 weeks. (BALB/c female: n = 29, BALB/c male: n = 13, C57BL/6j female: n = 6, C57BL/6j male: n = 5). (B) Changes in weight during the BBN administration period for each strain and sex (BALB/c female: n = 29, BALB/c male: n = 13, C57BL/6 female: n = 6, C57BL/6 female: n = 5). (C) Macroscopic and histopathological representations for each strain and sex. Scale bars for macroscopic images and histopathological images represent 1 cm and 200 μm, respectively. (D) Probability of UTUC or BC for each strain and sex. Ten BALB/c females and two BALB/c males were excluded due to unexpected death (BALB/c female: n = 19, BALB/c male: n = 11, C57BL/6 female: n = 6, C57BL/6 female: n = 5). (E) The left panel shows immunochemical staining for Ki‐67 and γH2A.X in a representative normal ureter from a BALB/c female mouse administered tap water, a macroscopically negative ureter, and UTUC from a BBN‐treated BALB/c female mouse. Scale bars represent 200 μm. The right graph shows the number of Ki‐67‐ and γH2A.X‐positive cells in the normal, negative ureter, and UTUC per high power fields (HPF) (normal ureter: n = 3, negative ureter: n = 5 or 6, UTUC: n = 6). Nor, normal ureter; Neg, negative ureter. Mann–Whitney U test was used. *p < 0.05. **p < 0.01. (F) Kaplan–Meier curves for each strain and sex. (BALB/c female: n = 29, BALB/c male: n = 13, C57BL/6 female: n = 6, C57BL/6 female: n = 5). The log‐rank test corrected with the Bonferroni method was performed. *p < 0.05. **p < 0.01. [Correction added on 10 January 2025, after first online publication: The Figure 1(A) has been replaced in this version.].
FIGURE 2
FIGURE 2
Profile of BALB/c female with UTUC using multi‐omics. (A) Sample preparation design from BALB/c female mice for whole exome sequencing (WES), whole transcriptome sequencing (WTS), and metabolome analysis. UT: ureter tumor indicates the cancerous side of the upper tract ureter of BBN‐treated BALB/c female mice. UN: ureter negative indicates the non‐cancerous side of the upper tract ureter of BBN‐treated BALB/c female mice. U: ureter indicates the normal ureter of healthy BALB/c female mice administered tap water. (B) The count of single nucleotide variants in the UN and UT samples, including synonymous variants (SV) and non‐synonymous variants (NSV) using WES data (UT: n = 11, UN: n = 5). Spleen samples for each individual were used for annotation. (C) Averaged single base substitution (SBS) signatures for UN (upper) and UT (lower) using WES data (UT: n = 11, UN: n = 5). (D) Absolute contribution of each SBS‐like pattern to UN (upper) and UT (lower) using WES data (UT: n = 11, UN: n = 5). (E) Mouse UT mutational plot using the gene list of the TCGA human UTUC cohort (UT: n = 11). The gene list contains over 10% frequent mutation genes in the TCGA human UTUC cohort. Red characters and red underlined genes are oncogenes. 37/47 genes were mutated in the model's UT sample. (F) Principal component analysis (PCA) of U, UN, and UT using WTS data (UT: n = 10, UN: n = 7, U: n = 6). (G) Molecular subtype by the Fantini‐Gene set using WTS data (UT: n = 10, UN: n = 7, U: n = 6). (H) The differentially expressed genes (DEGs) compared UT and UN using WTS data (UT: n = 10, UN: n = 7). Red dots indicate genes upregulated in UT (n = 238), and blue dots indicate genes upregulated in UN (n = 355). |FC| >2.0, FDR <0.1 were significant. FC, fold change. (I) Clustering analysis of human UTUC and adjacent normal upper urinary tract (AN) samples using 502 gene sets obtained from the model's DEGs analysis compared UT and UN. (UTUC: n = 74, AN: n = 73). Cluster 1 comprised 77 samples (71 UTUC samples and 6 AN samples) and cluster 2 comprised 70 samples (3 UTUC samples and 67 AN samples).
FIGURE 3
FIGURE 3
BALB/c female UTUC mimics human UTUC in multiple aspects. (A) A representative sample was analyzed by spatial transcriptome sequencing. (Upper) Overall appearance of macroscopic, histopathological, and fluorescence immunostaining. (Lower) Representative microscopic appearance of histopathological, Ki‐67 staining, and fluorescence immunostaining from each region of interest (ROI). ROI ①: Normal urothelium (n = 2), ROI ②: Dysplasia (n = 2), ROI ③: Invasive UC (n = 12), ROI ④: Invasive UC (n = 3), ROI ⑤: Invasive UC with spindle‐shaped cell (n = 5). In the fluorescence immunostaining, Green: PanCK, Blue: DAPI, Red: F4/80, Light blue: CD3. Scale bars represent 50 μm. (B) GO enrichment analysis in ⑤ versus ②–④ showed that ⑤ was enriched of GOs involved in cancer malignancy, such as keratinocyte differentiation, tissue morphogenesis, and cell migration and adhesion. ROI ①: Normal urothelium (n = 2), ROI ②: Dysplasia (n = 2), ROI ③: Invasive UC (n = 12), ROI ④: Invasive UC (n = 3), ROI ⑤: Invasive UC with spindle‐shaped cell (n = 5). (C) Evaluation of gene expression characteristic of human UTUC molecular subtypes in comparison ⑤ versus ②–④ revealed that basal markers (upper) and squamous markers (middle) were upregulated in ⑤, while luminal markers (lower) were downregulated in ⑤. Mann–Whitney U test was used. *p <0.05. **p <0.01. (D) Clustering analysis of patients with UTUC (n = 73) using 123 gene sets obtained from the model's DEGs analysis compared ROI ⑤ and ROI ①, ② and ROI ③, ④. Group 2 shows significantly upregulated genes from ROI ⑤. (E) Progression‐free survival (PFS) of Groups 1 and 2 analyzed by the Kaplan–Meier method. The log‐rank test was used. *p <0.05.
FIGURE 4
FIGURE 4
Elevated inflammatory gene expression in the upper urinary tract is a feature of this model. (A) Pathway enrichment analysis of UT versus UN based on the KEGG database using WTS data (UT: n = 10, UN: n = 7). (B) Expression of four Tnf‐related inflammatory genes (Tnf, Tnfrsf1b, Il1b, and Il6) in UN and UT samples determined by qPCR (UN: n = 3, UT: n = 5). The Mann–Whitney U test was used. *p < 0.05. (C) Representative region of each ROI ③, ④, and ⑤; the same image of Figure 3A. ROI ① and ② were removed from assessment because CD3‐ or F4/80‐positive cells were not detected. Blue: PanCK. Green: CD3. Red: F4/80. (D) Comparative analysis of relative read counts of CD3 (upper) or F4/80 (lower) positive cells across ROI ③, ④, and ⑤ (ROI ③: n = 12, ROI ④: n = 3, and ROI ⑤: n = 5). The Kruskal–Wallis test was used. n.s. means not significant. **p <0.01. ***p <0.005. (E) Experimental schema for varying BBN exposure durations (2‐, 4‐, and 8‐weeks) in BALB/c females, and microscopic and immunochemical staining of representative samples. (2 weeks: n = 5, 4 weeks: n = 5, 8 weeks: n = 5.) Scale bars represent 200 μm. (F) Four Tnf‐related inflammatory genes (Tnf, Tnfrsf1b, Il1b, and Il6) expression by qPCR using visibly normal ureter of BALB/c female treated 4 weeks BBN (UN4: n = 5–6) and healthy ureter of BALB/c female given 4 weeks tap water (U4: n = 3). Mann–Whitney U test was used. *p <0.05.
FIGURE 5
FIGURE 5
Dietary intervention increases the abundance of Parabacteroides distasonis in BALB/c female mice feces. (A) Taxa‐bar plot at the order level (o) from 16S rRNA‐seq data. BALB/c female treated with BBN for 18 weeks: n = 10. BALB/c male treated with BBN for 18 weeks: n = 6. C57BL/6j female treated with BBN for 18 weeks: n = 6. C57BL/6j male treated with BBN for 18 weeks: n = 5). (B) Identification of gut microbiota more and less abundant in BALB/c females than in the others (BALB/c male, C57BL/6j female and male) treated with BBN for 18 weeks, as well as, in BALB/c females treated with BBN and those administered with tap water (BALB/c female treated with BBN: n = 10, Others treated with BBN: n = 17, BALB/c female treated without BBN: n = 3). 15 microbes, including the genus Parabacteroides, showed reduced abundances in BALB/c females treated with BBN for 18 weeks. (C) The relative abundance of genus Parabacteroides was significantly reduced in BALB/c females treated with BBN for 18 weeks compared to BALB/c females without BBN treatment (upper). The relative abundance of Parabacteroides distasonis was significantly reduced in BALB/c female treated with BBN for 18 weeks compared to others (BALB/c female treated with BBN: n = 10, Others treated with BBN: n = 17, BALB/c female treated without BBN: n = 3). Kruskal–Wallis test was used. n.s. means not significant. *p <0.05. **p <0.01. (D) Differentially expressed metabolites between BALB/c female treated with tap water (H: healthy) and with BBN water (U: UTUC) in fecal (UTUC: n = 10, Healthy: n = 3). Student's t‐test was used. |FC| >1.5, p <0.05 were significant. (E) Random forest analysis of fecal samples from UTUC and healthy BALB/c female mice (UTUC: n = 10, Healthy: n = 3). Red bubble: Upregulated in UTUC mice. Blue bubble: upregulated in Healthy mice. (F) Correlation analysis between differentially expressed fecal metabolites and genus Parabacteroides in BALB/c female treated with or without BBN (n = 13). An analysis was performed using the Pearson product–moment correlation coefficient. *p <0.05. **p <0.01. ***p <0.005. (G) Experimental design for BALB/c female with dietary intervention (n = 3) or normal diet (n = 3). (H) Linear discriminant analysis effect size (LEfSe). Comparison of the abundance of gut microbiota between BALB/c females with dietary intervention (n = 3) versus normal diet (n = 3) in circle plot (left) and bar chart (right). Red underlined microbiota indicates the genus Parabacteroides. Green bar: upregulated in the normal diet group. Red bar: upregulated in the dietary intervention group. k, kingdom; p, phylum; c, class; o, order; f, family; g, genus; s, species. (I) The relative abundance of genus Parabacteroides was significantly increased in BALB/c females with dietary intervention (n = 3) than in the normal diet group (n = 3, upper). The relative abundance of Parabacteroides distasonis was significantly increased in BALB/c females in the dietary intervention (n = 3) than in the normal diet group (n = 3, lower). Mann–Whitney U test was used. †p <0.1. *p <0.05.
FIGURE 6
FIGURE 6
Dietary intervention can prevent UTUC carcinogenesis in BALB/c female mice. (A) Experimental design for BBN administration for BALB/c female with dietary intervention or normal diet for 17 weeks (dietary intervention group: n = 15, normal diet group: n = 14). (B) Weight changes during BBN administration in BALB/c females with dietary intervention or normal diet (dietary intervention group: n = 15, normal diet group: n = 14). Mann–Whitney U test was used. n.s. means not significant. *p < 0.05. **p < 0.01. (C) Macroscopic and histopathological appearance of BALB/c female treated with BBN on dietary intervention or normal diet for 17 weeks. Scale bars of macroscopic images and histopathological images represent 1 cm and 200 μm, respectively. (D) The frequency of UTUC in each group. In BALB/c females with normal diet (upper), 63.6% (7/11) had UTUC in the right upper urinary tract, 45.5% (5/11) had UTUC in the left upper urinary tract, and 18.2% (2/11) had UTUC bilaterally. Thus, the carcinogenic rate of UTUC is 91.0% (7 + 5 − 2/11). 18.2% (2/11) had BC. In BALB/c females with dietary intervention (lower), 0.0% (0/13) had UTUC in the right upper urinary tract and 0.0% (0/13) had UTUC in the left upper urinary tract. Thus, the carcinogenic rate of UTUC is 0.0% (0/13). 46.2% (6/13) had BC. (E) Linear discriminant analysis effect size (LEfSe) identified bacteria with common changes in the comparison with UTUC versus others treated with BBN from Figure 5B and BALB/c female with dietary intervention versus normal diet treated with BBN (dietary intervention group: n = 8, normal diet group: n = 8). Green bar: upregulated in BALB/c females with a normal diet. Red bar: upregulated in BALB/c female with an alanine‐free diet. p, phylum; c, class; o, order; f, family; g, genus; s, species. (F) The relative abundance of both genus Parabacteroides (upper) and Parabacteroides distasonis (lower) were significantly increased in BALB/c females treated with BBN on dietary intervention (n = 8) compared to normal diet (n = 8, upper). Mann–Whitney U test was used. ***p < 0.005. (G) Expression of four Tnf‐related inflammatory genes (Tnf, Tnfrsf1b, Il1b, and Il6) were assessed by qPCR in UT of BALB/c female treated with BBN on normal diet, and ureter of BALB/c female treated with BBN on dietary intervention (normal diet group: n = 5, dietary intervention group: n = 10). The Mann–Whitney U test was used. **p < 0.01. ***p < 0.005. (H) Experimental design for BBN administration for BALB/c female with dietary intervention or normal diet for 4 weeks (dietary intervention group 4: n = 6, normal diet group 4: n = 5). (I) Macroscopic and histopathological appearance of BALB/c female treated with BBN on dietary intervention or normal diet for 4 weeks. Scale bars of macroscopic images and histopathological images represent 1 cm and 200 μm, respectively. (J) Expression of four Tnf‐related inflammatory genes (Tnf, Tnfrsf1b, Il1b, and Il6) were assessed by qPCR in UN of BALB/c female treated with BBN on a normal diet, and ureter of BALB/c female treated with BBN on dietary intervention (normal diet group 4: n = 5–6, dietary intervention group 4: n = 10). The Mann–Whitney U test was used. ***p < 0.005.

Similar articles

References

    1. Siegel RL, Miller KD, Wagle NS, Jemal A. Cancer statistics, 2023. CA Cancer J Clin. 2023;73:17‐48. - PubMed
    1. Gontero P, Compérat E, Dominguez JL, et al. Non‐muscle‐invasive bladder cancer (TaT1 and CIS) EAU Guidelines on. 2023.
    1. Rouprêt M, Babjuk M, Burger M, et al. European Association of Urology guidelines on upper urinary tract urothelial carcinoma: 2020 update. Eur Urol. 2021;79:62‐79. - PubMed
    1. Leow JJ, Chong KT, Chang SL, Bellmunt J. Upper tract urothelial carcinoma: A different disease entity in terms of management. ESMO Open. 2017;1:e000126. - PMC - PubMed
    1. Chen CH, Dickman KG, Moriya M, et al. Aristolochic acid‐associated urothelial cancer in Taiwan. Proc Natl Acad Sci USA. 2012;109:8241‐8246. - PMC - PubMed

LinkOut - more resources