. 2025 Mar 6;148(3):985-1000.
doi: 10.1093/brain/awae411.

Loss of glymphatic homeostasis in heart failure

Affiliations

Loss of glymphatic homeostasis in heart failure

Marios Kritsilis et al. Brain. .

Abstract

Heart failure is associated with progressive reduction in cerebral blood flow and neurodegenerative changes leading to cognitive decline. The glymphatic system is crucial for the brain's waste removal, and its dysfunction is linked to neurodegeneration. In this study, we used a mouse model of heart failure, induced by myocardial infarction, to investigate the effects of heart failure with reduced ejection fraction on the brain's glymphatic function. Using dynamic contrast-enhanced MRI and high-resolution fluorescence microscopy, we found increased solute influx from the CSF spaces to the brain, i.e. glymphatic influx, at 12 weeks post-myocardial infarction. Two-photon microscopy revealed that cerebral arterial pulsatility, a major driver of the glymphatic system, was potentiated at this time point, and could explain this increase in glymphatic influx. However, clearance of proteins from the brain parenchyma did not increase proportionately with influx, while a relative increase in brain parenchyma volume was found at 12 weeks post-myocardial infarction, suggesting dysregulation of brain fluid dynamics. Additionally, our results showed a correlation between brain clearance and cerebral blood flow. These findings highlight the role of cerebral blood flow as a key regulator of the glymphatic system, suggesting its involvement in the development of brain disorders associated with reduced cerebral blood flow. This study paves the way for future investigations into the effects of cardiovascular diseases on the brain's clearance mechanisms, which may provide novel insights into the prevention and treatment of cognitive decline.

Keywords: cardiovascular disease; cerebral blood flow; cerebrospinal fluid.


Conflict of interest statement

The authors report no competing interests.

Figures

Figure 1
Figure 1
Systolic dysfunction of the left ventricle following myocardial infarction. (A) Schematic representation of the experiment. Three-month-old male C57BL/6N mice underwent either myocardial infarction (MI) or sham surgery [inset highlights the left anterior descending (LAD) artery ligation and infarct] and 12 weeks post-surgery, their left ventricular function was assessed using a 2D-UTE MRI sequence. (BE) Representative slice images from a sham (top) and a MI (bottom) mouse cardiac scan showing the long axis view of the left ventricle (B), the short axis view of the left ventricle (LV) at the end-systolic phase (C) and the magnified short axis views of the left ventricle at the end-systolic (D) and the end-diastolic phase (E) (LV volume marked with yellow dashed line). (F) LV end-diastolic volume at 12 weeks post-MI or sham surgery [unpaired two-tailed Student’s t-test, t(63) = 3.904, P = 0.0002, n = 28 sham, n = 37 MI]. (G) LV end-systolic volume at 12 weeks post-MI or sham surgery [unpaired two-tailed Welch’s t-test, t(52.46) = 6.146, P < 0.0001, n = 28 sham, n = 37 MI]. (H) LV stroke volume at 12 weeks post-MI or sham surgery [unpaired two-tailed Student’s t-test, t(63) = 2.282, P = 0.0259, n = 28 sham, n = 37 MI]. (I) LV ejection fraction at 12 weeks post-MI or sham surgery [unpaired two-tailed Welch’s t-test, t(57.13) = 7.786, P < 0.0001, n = 28 sham, n = 37 MI]. (J) Heart rate at 12 weeks post-MI or sham surgery (two-tailed Mann-Whitney test, U = 414, P = 0.1704, n = 28 sham, n = 37 MI). (K) Cardiac output at 12 weeks post-MI or sham surgery [unpaired two-tailed Student’s t-test, t(63) = 1.531, P = 0.1308, n = 28 sham, n = 37 MI]. Scale bars in B and C  = 2 mm; D and E  = 1 mm. Box plots represent median, quartiles, min and max values, with individual animals shown as coloured dots. *P < 0.05, ***P < 0.001, ****P < 0.0001. 2D-UTE = two-dimensional ultrashort echo time.
Figure 2
Figure 2
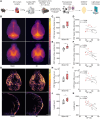
Heart failure increases CSF tracer distribution in the brain at 12 weeks post-myocardial infarction. (A) Schematic representation of the experimental timeline. (B) Representative images of CSF tracer distribution at the dorsal (top) and ventral (bottom) brain surfaces from a sham and a myocardial infarction (MI) mouse. (C) Quantification of mean fluorescence intensity of CSF tracer influx at the dorsal brain surface [unpaired two-tailed Student’s t-test, t(9) = 2.169, P = 0.0582, n = 5 sham, n = 6 MI]. (D) Correlation between ejection fraction and mean fluorescence intensity at the dorsal brain surface (Pearson’s correlation, r = −0.2438, R2 = 0.05944, P = 0.4700, n = 11). (E) Quantification of mean fluorescence intensity of CSF tracer influx at the ventral brain surface [unpaired two-tailed Student’s t-test, t(9) = 2.771, P = 0.0217, n = 5 sham, n = 6 MI]. (F) Correlation between ejection fraction and mean fluorescence intensity at the ventral brain surface (Pearson’s correlation, r = −0.6084, R2 = 0.3702, P = 0.047, n = 11). (G) Representative 3D reconstructed images of fluorescent tracer influx in the optically cleared whole brain, dorsal view (top) and maximum projection of a 500-μm thick coronal section around bregma (bottom). (H) Quantification of sum fluorescence intensity of CSF tracer influx at the optically cleared whole brain [unpaired two-tailed Student’s t-test, t(9) = 2.021, P = 0.074, n = 5 sham, n = 6 MI]. (I) Correlation between ejection fraction and sum fluorescence intensity of CSF tracer influx at the optically cleared whole brain (Pearson’s correlation, r = −0.3242, R2 = 0.1051, P = 0.3308, n = 11). (J) Quantification of average length of vessels with perivascular influx at the dorsolateral cortex [unpaired two-tailed Student’s t-test, t(9) = 2.545, P = 0.0315, n = 5 sham, n = 6 MI]. (K) Correlation between ejection fraction and average length of vessels with perivascular influx (Pearson’s correlation, r = −0.6234, R2 = 0.3887, P = 0.0404, n = 11). Scale bars in B = 2 mm; G = 1 mm (top), 500 μm (bottom). Colour map: B and G = inferno. Box plots represent median, quartiles, min and max values, with individual animals shown as coloured dots. Individual animals are represented as coloured circles in the correlation graphs, red (MI) and grey (sham). *P < 0.05. 2D-UTE = two-dimensional ultrashort echo time; CM = cisterna magna; EF = ejection fraction; iDISCO = immunolabelling-enabled 3D imaging of solvent-cleared organs; K/X = ketamine/xylazine; PFA = paraformaldehyde.
Figure 3
Figure 3
Heart failure leads to increased glymphatic influx at ventral brain regions after 12 weeks post-myocardial infarction. (A) Schematic representation of the experimental timeline. (B) Overview of DCE-MRI protocol consisting of two baseline measurements, followed by four time points during the injection of 10 μl of Dotarem® in the cisterna magna (CM) at a rate of 1 µl/min and 20 more time points of CSF contrast agent circulation. (C) Representative coronal images of parenchymal contrast agent infiltration 20 min after the end of the CM injection, at the level of the anterior cerebral artery (ACA) from a sham (top) and a myocardial infarction (MI) (bottom) mouse. Signal enhancement was quantified by parenchymal volumes of interest (VOIs, white circles) positioned right above the ACA (ACA 1) and 1 mm dorsally (ACA 2). Insets highlight the CSF tracer influx at the ventral brain area. (DG) Characteristics of the CSF tracer influx at the ACA 1 VOI, including the time − mean enhancement curve [two-tailed repeated measures two-way ANOVA, Time × Group: F(25,225) = 3.587, P < 0.0001; Time: F(1.926,17.33) = 66.04, P < 0.0001; Group: F(1,9) = 19.94, P = 0.0016, n = 5 sham, n = 6 MI] (D), the area under the curve (AUC) [unpaired two-tailed Student’s t-test, t(9) = 4.515, P = 0.0015, n = 5 sham, n = 6 MI] (E), the peak enhancement [unpaired two-tailed Student’s t-test, t(9) = 4.174, P = 0.0024, n = 5 sham, n = 6 MI] (F) and the correlation between the AUC and the ejection fraction (EF) (Pearson’s correlation, r = −0.6543, R2 = 0.4282, P = 0.0289, n = 11) (G). (HK) Characteristics of the CSF tracer influx at the ACA 2 VOI, including the time − mean enhancement curve [two-tailed repeated measures two-way ANOVA, Time × Group: F(25,225) = 7.096, P < 0.0001; Time: F(2.439,21.95) = 139.5, P < 0.0001; Group: F(1,9) = 7.956, P = 0.0200, n = 5 sham, n = 6 MI] (H), the AUC [unpaired two-tailed Student’s t-test, t(9) = 2.917, P = 0.0171, n = 5 sham, n = 6 MI] (I), the peak enhancement [unpaired two-tailed Student’s t-test, t(9) = 4.101, P = 0.0027, n = 5 sham, n = 6 MI] (J) and the correlation between the AUC and the ejection fraction (Pearson’s correlation, r = −0.3403, R2 = 0.1158, P = 0.3059, n = 11) (K). (L) Representative coronal images of parenchymal contrast agent infiltration 20 min after the end of the CM injection, at the level of the hypothalamus (HT) from a sham (top) and a MI (bottom) mouse. Signal enhancement was quantified by parenchymal volumes of interest (VOI, white circles) positioned at the ventral surface of the hypothalamus (HT 1) and 1 mm dorsally (HT 2). Insets highlight the CSF tracer influx at the ventral brain area. (MP) Characteristics of the CSF tracer influx at the HT 1 VOI, including the time − mean enhancement curve [two-tailed repeated measures two-way ANOVA, Time × Group: F(25,225) = 2.566, P = 0.0001; Time: F(1.786,16.08) = 73.01, P < 0.0001; Group: F(1,9) = 9.585, P = 0.0128, n = 5 sham, n = 6 MI] (M), the AUC [unpaired two-tailed Student’s t-test, t(9) = 3.119, P = 0.0123, n = 5 sham, n = 6 MI] (N), the peak enhancement [unpaired two-tailed Student’s t-test, t(9) = 2.449, P = 0.0368, n = 5 sham, n = 6 MI] (O) and the correlation between the AUC and the ejection fraction (Pearson’s correlation, r = −0.8009, R2 = 0.6415, P = 0.0031, n = 11) (P). (QT) Characteristics of the CSF tracer influx at the HT 2 VOI, including the time − mean enhancement curve [two-tailed repeated measures two-way ANOVA, Time × Group: F(25,225) = 3.521, P < 0.0001; Time: F(1.699,15.29) = 99.49, P < 0.0001; Group: F(1,9) = 5.697, P = 0.0408, n = 5 sham, 6 MI] (Q), the AUC [unpaired two-tailed Student’s t-test, t(9) = 2.334, P = 0.0444, n = 5 sham, n = 6 MI] (R), the peak enhancement [unpaired two-tailed Student’s t-test, t(9) = 2.298, P = 0.0471, n = 5 sham, n = 6 MI] (S) and the correlation between the AUC and the ejection fraction (Pearson’s correlation, r = −0.4749, R2 = 0.2256, P = 0.1399, n = 11) (T). Scale bars in C and L = 1 mm; insets = 1 mm. Colour map: C and L = inferno (CSF tracer) overlaid on greyscale (mean anatomical image). Curves are presented as mean ± standard error of the mean (SEM). Level of significance is calculated by two-tailed repeated measures two-way ANOVA with Geisser-Greenhouse correction and represents the P-value of the comparison between the Time × Group coefficients, given that there is a significant difference between both the time and group coefficients separately. Box plots represent median, quartiles, min and max values, with individual animals shown as coloured dots. Individual animals are represented as coloured circles in the correlation graphs, red (MI) and grey (sham). *P < 0.05, **P < 0.01, ***P < 0.001, ****P < 0.0001. 2D-UTE = two-dimensional ultrashort echo time; DCE-MRI = dynamic contrast enhanced-magnetic resonance imaging; K/X = ketamine/xylazine.
Figure 4
Figure 4
CSF nasal efflux is not affected at 12 weeks post-myocardial infarction. (A) Representative sagittal view of contrast agent distribution 20 min after the end of the cisterna magna (CM) injection (left). Close-up view of the white box, highlighting the olfactory neuron bundles crossing the cribriform plate (top right) and the same area with the nasal turbinates (NT) mask and the significantly enhancing voxels mask overlaid (bottom right). (B) Representative sagittal images of contrast agent distribution 20 min after the end of the CM injection, at the level of the NT from a sham (top) and a myocardial infarction (MI) (bottom) mouse. (CE) Characteristics of the mean signal enhancement of the significantly enhancing voxels of the nasal turbinates, including the time − mean enhancement curve [two-tailed repeated measures two-way ANOVA, Time × Group: F(25,225) = 1.531, P = 0.0565, n = 5 sham, n = 6 MI] (C), the area under the curve (AUC) (two-tailed Mann-Whitney test, U = 9, P = 0.329, n = 5 sham, n = 6 MI) (D) and the peak enhancement (two-tailed Mann-Whitney test, U = 6, P = 0.1255, n = 5 sham, n = 6 MI) (E). (F) Correlation between the AUC and the ejection fraction (Pearson’s correlation, r = −0.1216, R2 = 0.01478, P = 0.7217, n = 11). (G) Correlation between the peak enhancement and the ejection fraction (Spearman’s correlation, r = −0.3462, P = 0.2947, n = 11). Scale bars in A and B = 1 mm. Colour map: A and B = inferno (CSF tracer) overlaid on greyscale (mean anatomical image). Curves are presented as mean ± standard error of the mean (SEM). Box plots represent median, quartiles, min and max values, with individual animals shown as coloured dots. Individual animals are represented as coloured circles in the correlation graphs, red (MI) and grey (sham). EF = ejection fraction; OB = olfactory bulbs.
Figure 5
Figure 5
Cerebral arterial pulsatility increases at 12 weeks post-myocardial infarction. (A) Schematic representation of the experimental timeline. (B) Top: Representative in vivo two-photon fluorescence microscopy image of a pial artery after intravenous injection of FITC-dextran (white arrowheads show vascular segments labelled with FITC-dextran). The blue box indicates the vascular segment used for arterial pulsatility analysis. Bottom: The magnified vascular segment from which the vascular diameter oscillations are measured. (C) Arterial pulsatility amplitude, normalized to the vessel diameter, in awake mice (two-tailed Mann-Whitney test, U = 28, P = 0.2973, n = 9 sham, n = 9 MI). (D) Slow vasomotion amplitude, normalized to the vessel diameter, in awake mice [unpaired two-tailed Student’s t-test, t(16) = 0.8545, P = 0.4055, n = 9 sham, n = 9 MI]. (E) Arterial pulsatility amplitude, normalized to the vessel diameter, under K/X anaesthesia (two-tailed Mann-Whitney test, U = 16, P = 0.0315, n = 9 sham, n = 9 MI). (F) Slow vasomotion amplitude, normalized to the vessel diameter, under K/X anaesthesia [unpaired two-tailed Student’s t-test, t(16) = 0.4223, P = 0.6784, n = 9 sham, n = 9 MI]. (G) Correlation between arterial pulsatility amplitude in awake mice and arterial pulsatility amplitude, under K/X anaesthesia (Spearman’s correlation, r = 0.5397, P = 0.0208, n = 18). (H) Representative ex vivo images of the perivascular space (visualized with BSA-647) around cerebral vessels (visualized with WGA-488 lectin) from a sham (top) and a MI (bottom) mouse. (I) Quantification of the perivascular space index. Perivascular space size was calculated by subtracting the lectin signal diameter from the BSA-647 tracer signal diameter. The perivascular space index ratio was then calculated by dividing the tracer signal diameter with the lectin signal diameter. Three diameter measurements across each vessel from four individual vessels were analysed per mouse [unpaired two-tailed Student’s t-test, t(16) = 1.873, P = 0.0795, n = 9 sham, n = 9 MI]. (J) Plasma norepinephrine concentration [unpaired two-tailed Student’s t-test, t(16) = 0.7407, P = 0.4696, n = 9 sham, n = 9 MI]. Scale bar in H = 20 μm. Values in parentheses indicate the frequency range for each measurement. Box plots represent median, quartiles, min and max values, with individual animals shown as coloured dots. Individual animals are represented as coloured circles in the correlation graph, red (MI) and grey (sham). *P < 0.05. 2D-UTE = two-dimensional ultrashort echo time; CM = cisterna magna; K/X = ketamine/xylazine; MI = myocardial infarction; WGA = wheat germ agglutinin.
Figure 6
Figure 6
Glymphatic clearance is independent of ejection fraction but decreases with reduced CBF. (A) Schematic representation of the experimental timeline. (B) Representative 3D reconstructed images of optically cleared brains that were isolated 48 h after fluorescent BSA-647 tracer was injected in the striatum of sham (top) and myocardial infarction (MI) (bottom) mice, dorsal view (left), right posterolateral view (middle) and close-up anterior view (right). (C) Quantification of sum fluorescence intensity around the injection site of the tracer [unpaired two-tailed Student’s t-test, t(14) = 0.1367, P = 0.8932, n = 6 sham, n = 10 MI]. (D) Quantification of interstitial tracer volume remaining around the injection site [unpaired two-tailed Welch’s t-test, t(12.51) = 0.1416, P = 0.8897, n = 6 sham, n = 10 MI]. (E) Correlation between ejection fraction (EF) and sum fluorescence intensity around the injection site (Pearson’s correlation, r = 0.3252, R2 = 0.1057, P = 0.2191, n = 16). (F) Representative cerebral blood flow (CBF) maps acquired using a FAIR-EPI MRI sequence at 12 weeks post-surgery at the level of the striatum (ST, left) and the hypothalamus (HT, right) from sham (top) and MI (bottom) mice. (G) Mean CBF at the ventral striatum at 12 weeks post-MI or sham surgery [unpaired two-tailed Student’s t-test, t(14) = 1.191, P = 0.2535, n = 5 sham, n = 11 MI]. (H) Mean CBF at the hypothalamus at 12 weeks post-MI or sham surgery (two-tailed Mann-Whitney test, U = 8, P = 0.0275, n = 5 sham, n = 11 MI). (I) Correlation between mean CBF at the ventral striatum and sum fluorescence intensity around the injection site (Pearson’s correlation, r = −0.5552, R2 = 0.3083, P = 0.0317, n = 15). (J) Correlation between mean CBF at the ventral striatum and tracer volume remaining around the injection site (Pearson’s correlation, r = −0.6547, R2 = 0.4287, P = 0.0081, n = 15). Scale bars in B, left = 2 mm, middle = 2 mm, right = 1 mm; F = 2 mm. Colour map: B = inferno (BSA-647) overlaid on greyscale (anatomical reference); F = inferno. Box plots represent median, quartiles, min and max values, with individual animals shown as coloured dots. Individual animals are represented as coloured circles in the correlation graphs, red (MI) and grey (sham). *P < 0.05, **P < 0.01. FAIR-EPI = Flow-sensitive Alternating Inversion Recovery Echo-Planar Imaging; iDISCO = immunolabelling-enabled 3D imaging of solvent-cleared organs.
Figure 7
Figure 7
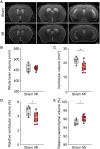
Proportionately larger brain parenchyma and smaller cerebral ventricles at 12 weeks post-myocardial infarction. (A) Representative coronal brain images acquired using a RARE sequence at 12 weeks post-surgery at three levels along the anteroposterior axis from a sham (top) and a myocardial infarction (MI) (bottom) mouse (brain masks marked with white lines and ventricular masks marked with white dashed lines). (B) Whole brain volume at 12 weeks post-MI or sham surgery [unpaired two-tailed Welch’s t-test, t(4.712) = 0.06554, P = 0.9504, n = 5 sham, n = 11 MI]. (C) Ventricular volume at 12 weeks post-MI or sham surgery [unpaired two-tailed Student’s t-test, t(14) = 2.685, P = 0.0178, n = 5 sham, n = 11 MI]. (D) Relative ventricular volume at 12 weeks post-MI or sham surgery [unpaired two-tailed Student’s t-test, t(14) = 2.608, P = 0.0207, n = 5 sham, n = 11 MI]. (E) Relative brain parenchymal volume at 12 weeks post-MI or sham surgery [unpaired two-tailed Student’s t-test, t(14) = 2.608, P = 0.0207, n = 5 sham, n = 11 MI]. Scale bar in A  = 1 mm. Box plots represent median, quartiles, min and max values, with individual animals shown as coloured dots. RARE = rapid acquisition with refocused echoes.

Comment in

References

    1. Groenewegen A, Rutten FH, Mosterd A, Hoes AW. Epidemiology of heart failure. Eur J Heart Fail. 2020;22:1342–1356. - PMC - PubMed
    1. Wu Y, Chen L, Zhong F, et al. Cognitive impairment in patients with heart failure: Molecular mechanism and therapy. Heart Fail Rev. 2023;28:807–820. - PubMed
    1. Qiu C, Winblad B, Marengoni A, Klarin I, Fastbom J, Fratiglioni L. Heart failure and risk of dementia and Alzheimer disease: A population-based cohort study. Arch Intern Med. 2006;166:1003–1008. - PubMed
    1. Vogels RL, Scheltens P, Schroeder-Tanka JM, Weinstein HC. Cognitive impairment in heart failure: A systematic review of the literature. Eur J Heart Fail. 2007;9:440–449. - PubMed
    1. Cannon JA, Moffitt P, Perez-Moreno AC, et al. Cognitive impairment and heart failure: Systematic review and meta-analysis. J Card Fail. 2017;23:464–475. - PubMed