Review
. 2025 Jan 8;229(1):1-108.
doi: 10.1093/genetics/iyae167.

Detecting gene expression in Caenorhabditis elegans

Affiliations
Review

Detecting gene expression in Caenorhabditis elegans

John A Calarco et al. Genetics. .

Abstract

Reliable methods for detecting and analyzing gene expression are necessary tools for understanding development and investigating biological responses to genetic and environmental perturbation. With its fully sequenced genome, invariant cell lineage, transparent body, wiring diagram, detailed anatomy, and wide array of genetic tools, Caenorhabditis elegans is an exceptionally useful model organism for linking gene expression to cellular phenotypes. The development of new techniques in recent years has greatly expanded our ability to detect gene expression at high resolution. Here, we provide an overview of gene expression methods for C. elegans, including techniques for detecting transcripts and proteins in situ, bulk RNA sequencing of whole worms and specific tissues and cells, single-cell RNA sequencing, and high-throughput proteomics. We discuss important considerations for choosing among these techniques and provide an overview of publicly available online resources for gene expression data.

Keywords: FISH; RNA sequencing; WormBook; gene expression; live-cell reporters; single-cell RNA sequencing.


Conflict of interest statement

Conflicts of interest: The authors declare no competing interests.

Figures

Fig. 1.
Fig. 1.
Transcriptional reporters. a) Native gene structure with presumptive upstream regulatory region for target gene (blue) abutting adjacent gene (black). b) Promoter fusion constructed from upstream regulatory region fused to GFP coding sequence includes synthetic introns to enhance expression of fluorescent reporter protein (GFP) (Okkema et al. 1993). c) Bicistronic reporter constructed by insertion of SL2 transcriptional leader splice site and GFP coding region between target gene stop codon and native 3′ UTR. SL2 trans-splicing results in separate coding RNAs for the native protein and GFP. GFP coding regions contain synthetic introns (not shown) to enhance expression. Created in BioRender. Miller, D. (2024) BioRender.com/u86y953.
Fig. 2.
Fig. 2.
Labeling transcripts in situ by hybridization methods. Colorimetric detection: a fixed and permeabilized preparation is hybridized with a cDNA probe labeled with digoxigenin UTP (DIG-UTP) and reacted with an anti-DIG antibody coupled to alkaline phosphatase that catalyzes the production of a colored product. smFISH uses a series of cDNA probes each labeled with a fluorescent dye to detect single transcripts (bottom) that appear as distinct puncta expressed in ventral cord motor neurons (top) VA2 (marked with GFP) and VB3 (Smith et al. 2024). smiFISH uses a 2-step hybridization strategy. Probes complementary to the target transcript include a universal adapter sequence for hybridization to fluorescently labeled probe. HCR probes with a universal adapter initially hybridize to the target transcript. Hybridization of the H1 sequence to the adapter opens the H1 hairpin for hybridization with the H2 sequence. Subsequent rounds of hybridization between the H1 and H2 hairpins build a lattice that amplifies the fluorescent signal. MERFISH uses a combinatorial barcoding strategy for simultaneous detection of multiple different transcripts. Probes for each target transcript are tagged with readout sequences that are detected by successive rounds of hybridization with fluorescently labeled probes. Confocal images are collected after each round to build a hybridization “code” that should be unique to a given transcript. Error correction is achieved by excluding potentially ambiguous signals at the expense of reducing sensitivity. Adapted from Pichon et al. (2018). Created in BioRender. Miller, D. (2024) BioRender.com/o28t897.
Fig. 3.
Fig. 3.
Live-cell reporters for RNA localization. a) The viral MS2 coat protein is fused to GFP and a nuclear localization signal, where it can interact with MS2 stem loops fused to a transcribed RNA of interest. Upon export to the cytoplasm, the MS2 coat protein::GFP-RNA complex can be monitored by microscopy in live animals. The use of 24 stem loops can enhance signal-to-noise ratios for single RNA molecule tracking. b) The MS2 coat protein is fused to 24 copies of the SunTag, a short peptide recognized by a scFv antibody, that recruits 24 copies of GFP to the MS2 coat protein (top left schematic). Two MS2 coat proteins in turn recognize a single MS2 stem loop, leading to a maximum of 48 GFP molecules recruited to each stem loop (top right schematic). Finally, 8 stem loops are inserted into the 3′ UTR of a native gene of interest, yielding a theoretical maximum of 384 GFP molecules recruited to a single mRNA. Created in BioRender. Calarco, J. (2023) https://BioRender.com/m94z673.
Fig. 4.
Fig. 4.
Alternative splicing and 3′UTR regulatory output reporters. a) Two-color splicing reporter, which relies on the alternative translation of 2 FPs (EGFP and mCherry). An alternative exon (yellow) and its flanking introns and constitutively spliced exons (gray) are located upstream of the FP ORFs. A single nucleotide is inserted into the alternative exon, such that exon inclusion vs skipping results in 2 different reading frames for either mCherry or EGFP. Each FP is flanked by an N- and C-terminal nuclear localization signal (light blue), which concentrates the reporter signal in the nucleus, and an upstream 2A peptide (pink), which uncouples the 2X NLS-fused FP from the translated reporter. The relative amounts of red/green fluorescence provide an indirect readout of alternative splicing. b) A bicistronic dual 3′ UTR readout reporter. Two UTR isoforms of the same gene (yellow and extended light blue; short and long UTR variants created by alternative polyadenylation, respectively) are positioned downstream of one of 2 FPs fused to H2B. After transcription, the reporter pre-mRNA is trans-spliced through an SL2 regulatory sequence (pink), yielding 2 mature mRNAs, each containing a unique FP::H2B::3′ UTR fusion. GFP/RFP fluorescence ratios reveal the role of each UTR on FP expression. Since the longer UTR contains the signal elements directing 3′ end cleavage and polyadenylation to create the shorter 3′ UTR, the upstream polyA signal must be mutated (red star) to ensure that only the longer variant is produced. c) A bicistronic single 3′ UTR readout reporter. In this design, a single UTR variant (either a long or short UTR, for simplicity only the long 3′ UTR is shown) is cloned downstream of the destabilized GFP::PEST fusion. After transcription and trans-splicing through the SL2 regulatory sequence, 2 mRNAs are produced, one encoding mCherry to serve as an internal normalization control and the other encoding GFP::PEST, representing the translational readout of the 3′ UTR being tested. To ensure selection of a distal polyadenylation signal and longer UTR usage, the upstream polyadenylation signal for the shorter UTR variant is mutated. Created in BioRender. Calarco, J. (2024) https://BioRender.com/n74n884.
Fig. 5.
Fig. 5.
Cell dissociation and FACS for bulk RNA-seq. a) Synchronized populations of worms are grown on solid media (150 mm plates) and are (b) dissociated by successive treatments of SDS–DTT and Protease (Pronase) to produce a single-cell suspension. c) Cells labeled with a genetically expressed fluorescent reporter gene (e.g. RFP) (box) are well separated (top) from auto-fluorescent cells (arrow) detected in an N2 control in FACS scatter plots (bottom). The DNA-specific dye, DAPI, is used to exclude damaged cells. d) Target cells are captured in TRIZOL and can be stored at −80 C for RNA isolation. e) Bioanalysis detects intact 18S and 28S ribosomal peaks in RNA preparation before (f) library construction for bulk RNA-seq analysis (Taylor et al. 2024). Created in BioRender. Miller, D. (2024) https://BioRender.com/w02x332.
Fig. 6.
Fig. 6.
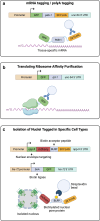
Affinity-based methods for transcriptome analysis. a) For mRNA/polyA tagging, a GFP::PAB-1::3xFLAG fusion protein is expressed in specific cell types using available promoters. After cell lysis, PAB-1 and associated polyadenylated RNA are immunoprecipitated with anti-FLAG antibodies, enriching for the repertoire of mRNAs expressed in specific cells. b) In TRAP, a large ribosomal protein, usually RPL-1 (in diagram) or RPL-22 in somatic cells and preferably RPL-4 or RPL-9 in the germline, is epitope tagged and expressed in specific cell types using available promoters. Animals are lysed for immunoprecipitation of GFP-tagged ribosomes to capture actively translated mRNAs. c) Two transgenes are used for the In INTACT method. One transgene expresses a nuclear pore protein (NPP-9) fused with mCherry, a BLRP (gray) and a 3xFLAG tag under the control of a cell type–specific promoter. A second transgene expresses the biotin ligase BirA under a broad and strong his-72 promoter. BirA biotinylates the NPP-9 fusion protein only in cells that express both fusion proteins. Finally, animals are lysed and nuclei are purified by streptavidin-conjugated beads. Both RNA and chromatin can be recovered from these isolated nuclei. Created in BioRender. Calarco, J. (2024) https://BioRender.com/l36h760.
Fig. 7.
Fig. 7.
cDNA library amplification strategies. a) Light blue panels outline 3′ biased sequencing, which is useful for routine differential expression analysis and 3′ UTR annotation. b) Full-length cDNAs are produced by the SMART approach (green panels), which uses a poly-dT primer + adapter at the 3′ end and a template switching oligo + adapter at the 5′ end of the first-strand cDNA. PCR amplification uses primers for the adapters sequences at each end. c) For more uniform coverage of transcripts, mRNA can be purified, followed by fragmentation and random priming to synthesize cDNA (yellow panels). d) A rRNA depletion strategy. cDNA libraries are generated from total RNA. Annealing with oligonucleotides (dashed line) targeting C. elegans rRNA sequences produces hybrid double-stranded fragments that are then enzymatically cleaved to remove rRNA sequences. Created in BioRender. Calarco, J. (2024) https://BioRender.com/d27j880.
Fig. 8.
Fig. 8.
A small RNA library amplification strategy. A series of enzymatic manipulations are performed to modify 5′ termini of small RNAs (Li, Dai, et al. 2020). An adenylylated linker is ligated to the 3′ end of small RNAs, and the phosphatase PIR-1 removes triphosphate groups from a subset of small RNA species. Next, an RT primer is annealed followed by removal of the 5′ cap by the decapping enzyme hDCP2 and ligation of a 5′ linker. Reverse transcription generates cDNA, which is then amplified and sequencing adapters added by PCR. To prevent concatenation of linkers, the 5′ linker has 5′ and 3′ OH groups and the 3′ linker has a 3′ dideoxycytidine (ddC) base. Created in BioRender. Calarco, J. (2024) https://BioRender.com/o43v276.
Fig. 9.
Fig. 9.
Bulk RNA-seq analysis pipeline. Schematic guide for processing sequence data and common downstream bioinformatic analyses for assigning functional importance to identified networks of DE genes. Key steps include quality control of the read data, mapping reads to gene models, producing gene-centered count tables, normalization, and differential gene expression across samples. Examples of downstream analysis: differential splicing, gene clustering based on shared expression profiles, GO/GSEA enrichment tests for biological functions, and integration with other large-scale datasets such as protein interaction data. Created in BioRender. Calarco, J. (2024) https://BioRender.com/z83e856.
Fig. 10.
Fig. 10.
Short-read vs long-read sequencing to study transcript diversity. The slo-1 gene displays 4 different sites of alternative splicing (pink exons; 3 exon skipping events involving exons 3, 13, and 15 and a mutually exclusive splicing event involving exons 10a and 10b). With short-read sequencing (top panel), junction-spanning reads typically map across only 1 or a few junctions, thus defining “local splicing variation’ but not correlated splicing patterns across distal portions of the gene. In contrast, long-read sequences (bottom panel) can be used to map complete exon junction connectivity across the full transcript. In these examples, correlated splicing patterns between different exons are defined by long reads that span each slo-1 transcript. Created in BioRender. Calarco, J. (2023) https://BioRender.com/s48s490.
Fig. 11.
Fig. 11.
Single-cell RNA-sequencing methods. a) Single cells or nuclei can be generated by cell dissociation, dounce homogenization (for nuclei) or physical dissection. Single-cell or single-nucleus suspensions can be used immediately after preparation or fixed for later encapsulation. Additionally, specific cell types can be enriched by FACS prior to encapsulation. b) Barcoding of RNAs from single cells can be accomplished by droplet-based methods (left) or combinatorial indexing (right). In droplet-based approaches, cells are distributed by microfluidic devices into individual aqueous droplets within oil emulsions (e.g. 10X Genomics, VASA-Seq) or by vortexing (Fluent Biosciences). In both cases, polyadenylated mRNAs are captured by oligo-d(T) primers containing UMIs, cell barcodes (BCs), and PCR primers. In combinatorial indexing approaches, fixed cells are randomly distributed into microtitre plate wells for RT and labeling with a first index barcode (BC1). Cells are then pooled and split randomly into wells for ligation of a second barcoding index (BC2). Cells are pooled and split a third time to generate unique combinations of barcodes for each cell (BC3). c) Droplet-based approaches use oligo-d(T) sequences to capture RNA, and library preparation enriches for the 3′ end of the transcript resulting in strong 3′ bias in gene body coverage. Combinatorial indexing approaches use oligo-d(T) primers and random hexamers to capture RNA, leading to whole gene body coverage and the possibility of assessing alternative splicing. Created in BioRender. Taylor, S. (2023) BioRender.com/l25h265.
Fig. 12.
Fig. 12.
Single-cell RNA-sequencing analysis pipeline. Read mapping assigns reads to specific genomic loci. Reads are grouped by cellular barcodes for gene quantification, generating a gene by barcode matrix, with each entry indicating the number of UMIs for each gene with each barcode. Barcodes for actual cells are distinguished from “empty droplets” containing only ambient, cell-free RNA. Ambient RNA correction excludes background RNA. Quality control removes low-quality cells (e.g. high mitochondrial gene content, low UMI/gene counts). Data normalization accounts for variation in gene and UMI count across cells. Data from multiple samples can be integrated. Dimensionality reduction, involving PCA, then UMAP, t-SNE, or PHATE, affords visualization and clustering. Cell annotation assigns anatomical identity to individual scRNA-seq clusters. Examples of downstream analyses include developmental age or changes in cell state (trajectory inference), differential expression between cell types or experimental conditions, identification of gene regulatory networks, DNA binding motif discovery, and integration with orthogonal datasets, e.g. ChIP-seq, ATAC-seq, or Connectome. Created in BioRender. Taylor, S. (2024)  BioRender.com/j17z849.
Fig. 13.
Fig. 13.
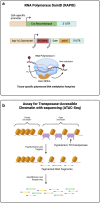
RAPID and ATAC-seq approaches. a) In the RNA polymerase DamID (RAPID) approach, the RPB-6 subunit (a component of all 3 eukaryotic RNA polymerases) is fused to the DNA adenine methyltransferase (Dam) enzyme, which methylates the adenine base within a GATC recognition sequence. Thus, any DNA recognition sequences in the vicinity of a polymerase will be methylated, and methylated regions can be selectively purified, amplified, and sequenced. Cre recombinase enzyme, driven by a cell-specific promoter, activates expression of the Dam::RPB-6 protein only in corresponding cells. b) In ATAC-seq, open chromatin regions (depicted by areas lacking orange histones) are more accessible to a hyperactive Tn5 DNA transpose. When the transposase is conjugated with linker sequences, tagging and fragmentation of (‘tagmentation’) of the accessible regions occur, enabling downstream amplification of these DNA fragments for quantification by high-throughput sequencing. Created in BioRender. Calarco, J. (2024) https://BioRender.com/u66g665.
Fig. 14.
Fig. 14.
Detecting protein expression through 2A peptide reporters and immunostaining. a) A 2A peptide ORF is inserted between the coding sequence of a gene of interest and the ORF of a reporter (e.g. a histone H2B::GFP fusion). During translation, when the ribosome encounters the 2A amino acid sequence, ribosome skipping occurs, releasing the upstream polypeptide while continuing translation of the downstream ORF. In this example, ribosome skipping results in fusion of the 2A peptide with the upstream protein and a separate H2B::GFP fusion protein, both produced at near stochiometric levels. b) For immunostaining, animals are fixed and permeabilized, incubated with a primary antibody recognizing a native or epitope-tagged protein, and then incubated with a secondary antibody labeled with a fluorophore. After incubation and washing steps, protein localization can be visualized by fluorescence microscopy. Created in BioRender. Calarco, J. (2024) https://BioRender.com/y50n430.
Fig. 15.
Fig. 15.
Cell type–specific protein detection using recombinases and split FPs. FLP-on strategies for cell-specific expression of C-terminal fusion (a) or N-terminal fusion (b) proteins. a) In the C-terminal fusion configuration, a heterologous 3′ UTR is inserted downstream of the coding sequence of a gene of interest, followed by a GFP and the native 3′ UTR. The heterologous 3′ UTR is flanked by FRT sites for excision by cell-specific expression of FLP recombinase. With excision, GFP is fused downstream of the coding sequence of the target gene, resulting in cell-specific expression. b) In the N-terminal fusion configuration, GFP is inserted upstream of the coding sequence of a gene of interest. A PEST domain and SL2 trans-splicing region, flanked by FRT sites, is placed between the FP and gene coding sequence. In the absence of FLP recombinase, GFP and the protein of interest are expressed as separate polypeptides by trans-splicing and the GFP degraded through the PEST domain. With FLP expression, the PEST domain and SL2 region are excised such that the GFP ORF is placed in frame with the coding region of the target gene resulting in a GFP-labeled protein. c) In the split-GFP approach, the smaller GFP11 fragment coding sequence is inserted in frame at an endogenous locus (e.g. at the 3′ end of the gene). The larger GFP1-10 fragment is expressed under the control of a cell type–specific promoter. Thus, fluorescent signal will only be detected in cells where both the GFP1-10 and GFP11 proteins are co-expressed. Insertion of multiple copies of the gfp11 cassette can amplify the GFP signal. Created in BioRender. Calarco, J. (2024) https://BioRender.com/m11t259.
Fig. 16.
Fig. 16.
Cell type–specific proteomic methods. a) Three methods for labeling proteins: BONCAT uses mutant tRNA synthetase to incorporate the noncanonical amino acid Azf that enables subsequent protein purification. APX uses the enzyme APX to attach biotin to nearby proteins. For TurboID, a mutant BirA ligase catalyzes the addition of biotin to nearby proteins. b) Cell-type specificity (left) is accomplished by expressing the modifying enzymes (e.g. TurboID) under cell-specific promoters. Subcellular specific labeling (center) by tagging modifying enzymes with NLSs or nuclear export signals (NES). Protein–protein interactions by attaching enzymes (TurboID, APX) to specific proteins to biotinylate interacting proteins. c) Modified proteins are isolated by affinity-based methods (e.g. streptavidin) for quantitative MS to establish protein identity and abundance. Created in BioRender. Taylor, S. (2024)  BioRender.com/v38e940.

References

    1. Aburaya S, Yamauchi Y, Hashimoto T, Minakuchi H, Aoki W, Ueda M. 2020. Neuronal subclass-selective proteomic analysis in Caenorhabditis elegans. Sci Rep. 10(1):13840. doi:10.1038/s41598-020-70692-w. - DOI - PMC - PubMed
    1. Aeschimann F, Kumari P, Bartake H, Gaidatzis D, Xu L, Ciosk R, Großhans H. 2017. LIN41 Post-transcriptionally silences mRNAs by two distinct and position-dependent mechanisms. Mol Cell. 65(3):476–489.e4. doi:10.1016/j.molcel.2016.12.010. - DOI - PubMed
    1. Aeschimann F, Xiong J, Arnold A, Dieterich C, Großhans H. 2015. Transcriptome-wide measurement of ribosomal occupancy by ribosome profiling. Methods San Diego Calif. 85:75–89. doi:10.1016/j.ymeth.2015.06.013. - DOI - PubMed
    1. Ahier A, Jarriault S. 2014. Simultaneous expression of multiple proteins under a single promoter in Caenorhabditis elegans via a versatile 2A-based toolkit. Genetics. 196(3):605–613. doi:10.1534/genetics.113.160846. - DOI - PMC - PubMed
    1. Ahmad R, Budnik B. 2023. A review of the current state of single-cell proteomics and future perspective. Anal Bioanal Chem. 415(28):6889–6899. doi:10.1007/s00216-023-04759-8. - DOI - PMC - PubMed

MeSH terms

Substances

LinkOut - more resources