. 2024 Dec 20;10(51):eadr3530.
doi: 10.1126/sciadv.adr3530. Epub 2024 Dec 18.

Regional differences in three-dimensional fiber organization, smooth muscle cell phenotype, and contractility in the pregnant mouse cervix

Affiliations

Regional differences in three-dimensional fiber organization, smooth muscle cell phenotype, and contractility in the pregnant mouse cervix

Christopher J Hansen et al. Sci Adv. .

Abstract

The orientation and function of smooth muscle in the cervix may contribute to the important biomechanical properties that change during pregnancy. Thus, this study examined the three-dimensional structure, smooth muscle phenotype, and mechanical and contractile functions of the upper and lower cervix of nongravid (not pregnant) and gravid (pregnant) mice. In gravid cervix, we uncovered region-specific changes in the structure and organization of fiber tracts. We also detected a greater proportion of contractile smooth muscle cells (SMCs), but an equal proportion of synthetic SMCs, in the upper versus lower cervix. Furthermore, we revealed that the lower cervix had infrequent spontaneous contractions, distension had a minimal effect on contractility, and the upper cervix had forceful contractions in response to labor-inducing agents (oxytocin and prostaglandin E2). These findings identify regional differences in cervix contractility related to contractile SMC content and fiber organization, which could be targeted with diagnostic technologies and for therapeutic intervention.


Figures

Fig. 1.
Fig. 1.. 3D fiber architecture and tractography of nongravid and term-gravid mouse cervix.
Representative ex vivo DT-MRI of intact lower uterine horns and whole cervix from nongravid (A) and term-gravid (B; day 19) mice. Transverse (left panels) and coronal slices (right panels) of the lower uterine horn and upper and lower cervix. MRI shows the in-plane section of the tissue (threshold FA map, rendered in grayscale). Transverse slice positions are indicated by black cross-sectional planes in the 3D tractography (middle) model of fiber orientation. Fiber orientation is indicated by color (right-left, green; anterior-posterior, blue; superior-inferior, red; hence a fiber at 45° to both the right-left and superior-inferior axes is rendered in yellow). Scale bars, 0.75 mm.
Fig. 2.
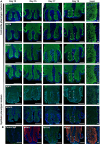
Fig. 2.. Regional and phenotypic assessment of smooth muscle content in gravid mouse cervix.
(A) To visualize SMCs, transverse sections of whole cervices from days 12, 15, 17, and 19 gravid mice (n ≥ 3) were immunofluoresently stained with specific markers for a contractile (MYH11 and SMTN) or synthetic phenotype (RBP1 and MYH10). Sections were also stained with CNN1 and α-SMA, which are markers of contractile smooth muscle and myofibroblasts. The grayscale bar (left) is a schematic representation of markers associated with a particular SMC phenotype. Green indicates positive immunostaining for each marker; blue indicates nuclei counterstained with 4′,6-diamidino-2-phenylindole (DAPI). (B) Control immunoglobulin G (IgG; left) was used as a control for the primary antibodies, and primary antibodies were omitted as controls for the secondary antibodies. Representative dual immunostaining of MYH10 (green) and MYH11 (red). Scale bars, 1000 μm; inset scale bars, 60 μm. Inset depicts high-power view of select regions (dashed box) of interest, which show longitudinal- and circumferentially oriented contractile SMCs, as well as synthetic SMCs in the broad subepithelial region and diffusely throughout the stroma.
Fig. 3.
Fig. 3.. Quantification of MYH11-positive contractile and MYH10-positive synthetic smooth muscle in upper and lower cervix during mid-late pregnancy.
(A) To visualize and quantify SMCs, coronal sections of whole cervices from days 12, 15, 17, and 19 gravid mice were immunofluoresently stained with specific markers for contractile (MYH11) and synthetic (MYH10) phenotypes. Scale bars, 1000 micron; inset scale bar, 60 micron). (B) Representative dual-immunostaining of MYH10 (green) and MYH11 (red) with DAPI (nuclei; blue). (C) Area of MYH11-positive and MYH10-positive staining relative to DAPI-positive (nuclei) area. Cervix sections from three to six mice on days 12, 15, 17, and 19 were analyzed. Data are shown as means ± SD. A two-way analysis of variance (ANOVA) was used to determine the effect of gestation day and region (upper versus lower) followed by Tukey’s post hoc analysis for multiple comparisons. *P < 0.05, **P < 0.01, and ***P < 0.001.
Fig. 4.
Fig. 4.. Comparative ex vivo biomechanical properties of the upper and lower cervix during mid-late pregnancy.
(A) Whole cervix of pregnant (days 12, 15, 17, and 19) mice were excised (orange box, left) and dissected from the uterus until the appearance of a single canal and then cut into upper and lower segments. The tissue was submerged between two hooks in an organ bath for biomechanical testing using force transducers and stepper motors (right). (B) Histology and MYH11 staining of a representative cervical bullet excised for biomechanical studies. (C) Representative tracing collected from stress-relaxation biomechanical tests. Data collected for each cervix were analyzed for equilibrium and impulse stiffness, initial and total dilation, as well as the area under the curve (AUC). Average exponential fits to the impulse stiffness and equilibrium stiffness results are shown. Unloaded initial dilation and total dilation of ex vivo cervical tissues before tissue failure are shown. Significant differences in biomechanical parameters were noted between the upper and lower cervices at a given gestation using a Student’s t test, with advancing gestation within upper or lower cervices of n = 9 mice by two-way ANOVA. *P < 0.05, **P < 0.01, ***P < 0.001, and ****P < 0.0001.
Fig. 5.
Fig. 5.. Spontaneous contractility of the upper and lower cervix during mid-late pregnancy.
(A) Representative recordings of ex vivo spontaneous contractility of the upper and lower cervices of pregnant (days 12, 15, 17, and 19) mice. (B) Recordings of cervical contractility (n ≥ 5 mice per gestational day) were analyzed for the AUC, amplitude, or frequency for a 10-min duration. A two-way ANOVA followed by a post hoc Tukey’s multiple comparison test was used to determine the effect of gestation day and region (upper versus lower) on contractility. Data are shown as means ± SD. P values represent significant regional (black) and distension (red) effects. *P < 0.05, **P < 0.01, ***P < 0.001, and ****P < 0.0001.
Fig. 6.
Fig. 6.. The effect of distension on the contractility of the upper and lower cervix.
The upper and lower cervix of day 19 pregnant mice (n ≥ 5 mice per group) were allowed to spontaneously contract before increasing distension to 3, 6, or 9 mm. Representative ex vivo contractility tracings (A) were analyzed for the AUC, amplitude, or frequency for a 5-min duration (B). A two-way ANOVA followed by a post hoc Tukey’s multiple comparison test was used to determine the effect of region (upper versus lower) and distension (3, 6, and 9 mm). Data are shown as means ± SD. P values shown in black represent significant effects of distension, and P values in colors represent significant effects of region. *P < 0.05, **P < 0.01, and ***P < 0.001.
Fig. 7.
Fig. 7.. The effect of PGE2 and OT during labor on contractility of the uterus vs upper and lower cervix.
The uterus and the upper and lower cervix of day 19 WT gravid mice were allowed to spontaneously (S) contract before treatment with increasing concentrations of either PGE2 (A), OT (OT) (B), or vehicle control. The same tissues from day 19 Oxtr−/− mice were also examined for their spontaneous contractility and response to OT. Representative ex vivo contractility recordings of cervical contractility before and after treatment (n ≥ 5 mice per group) were analyzed for the AUC relative to a 10-min duration. Dose-response curves were analyzed using a three-parameter log fit to determine whether one curve fits the datasets using the extra sum-of-squares s test. Data are shown as means ± SD.

Similar articles

References

    1. Yu S. Y., Tozzi C. A., Babiarz J., Leppert P. C., Collagen changes in rat cervix in pregnancy-polarized light microscopic and electron microscopic studies. Proc. Soc. Exp. Biol. Med. 209, 360–368 (1995). - PubMed
    1. Leppert P. C., Cerreta J. M., Mandl I., Orientation of elastic fibers in the human cervix. Am. J. Obstet. Gynecol. 155, 219–224 (1986). - PubMed
    1. Cooley A., Madhukaran S., Stroebele E., Colon Caraballo M., Wang L., Akgul Y., Hon G. C., Mahendroo M., Dynamic states of cervical epithelia during pregnancy and epithelial barrier disruption. iScience 26, 105953 (2023). - PMC - PubMed
    1. Garcia-Flores V., Romero R., Peyvandipour A., Galaz J., Pusod E., Panaitescu B., Miller D., Xu Y., Tao L., Liu Z., Tarca A. L., Pique-Regi R., Gomez-Lopez N., A single-cell atlas of murine reproductive tissues during preterm labor. Cell Rep. 42, 111846 (2023). - PMC - PubMed
    1. Barnum C. E., Shetye S. S., Fazelinia H., Garcia B. A., Fang S., Alzamora M., Li H., Brown L. M., Tang C., Myers K., Wapner R., Soslowsky L. J., Vink J. Y., The non-pregnant and pregnant human cervix: A systematic proteomic analysis. Reprod. Sci. 29, 1542–1559 (2022). - PubMed