. 2024 Dec 20;10(51):eadq4194.
doi: 10.1126/sciadv.adq4194. Epub 2024 Dec 18.

Future spinal reflex is embedded in primary motor cortex output

Affiliations

Future spinal reflex is embedded in primary motor cortex output

Tatsuya Umeda et al. Sci Adv. .

Abstract

Mammals can execute intended limb movements despite the fact that spinal reflexes involuntarily modulate muscle activity. To generate appropriate muscle activity, the cortical descending motor output must coordinate with spinal reflexes, yet the underlying neural mechanism remains unclear. We simultaneously recorded activities in motor-related cortical areas, afferent neurons, and forelimb muscles of monkeys performing reaching movements. Motor-related cortical areas, predominantly primary motor cortex (M1), encode subsequent afferent activities attributed to forelimb movement. M1 also encodes a subcomponent of muscle activity evoked by these afferent activities, corresponding to spinal reflexes. Furthermore, selective disruption of the afferent pathway specifically reduced this subcomponent of muscle activity, suggesting that M1 output drives muscle activity not only through direct descending pathways but also through the "transafferent" pathway composed of descending plus subsequent spinal reflex pathways. Thus, M1 provides optimal motor output based on an internal forward model that prospectively computes future spinal reflexes.


Figures
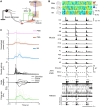
Fig. 1.
Fig. 1.. Multiregional recordings during voluntary upper limb movements.
(A) Experimental setup. (B) Simultaneous recordings in three trials. Top: Power spectrograms in MCx. Second: Activity of forelimb muscles. Third: Forelimb joint angles along the extension-flexion axis. Bottom: Raster plots of peripheral afferent activity. (C) Modulation of cortical and peripheral activity in monkey T aligned to movement onset. The average activity across 130 trials. Top to third: High-gamma cortical activity. Fourth: Forelimb muscles. Fifth: Joint angles. Bottom: Instantaneous firing rate of peripheral afferents. Thin lines represent the activity in each electrode (PMd, PMv, and M1), and units (afferent), and thick lines their respective averages. A vertical line represents the time of movement onset.
Fig. 2.
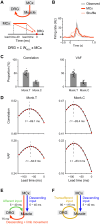
Fig. 2.. MCx encodes reafferent signals.
(A) Top: Model accounting for afferent activity in DRGs from MCx activity. Bottom: Temporal relationship between the descending input and afferent activity calculated from the input. (B) The observed activity of one example afferent, reconstruction using activity in MCx, and shuffled control data aligned to movement onset. The shaded areas indicate the SEM. (C) Proportion of afferents whose activities were more accurately reconstructed from MCx activity than from the shuffled data in the correlation coefficients and variances accounted for (VAFs) between the observed and reconstructed traces (monkey T, 21 sessions; and monkey C, 7 sessions). Data are the means ± SD. (D) Correlation coefficients and VAFs plotted against the lag times between afferent and MCx activity. The correlation coefficient or VAF of the model were averaged from the data of afferents for which the correlation coefficient or VAF of the model was superior to that of models built using a surrogate shuffled control and showed high accuracy (correlation coefficient greater than 0.4 and VAF greater than 0.15). The black line represents the fit to a quadratic curve. The vertical dotted lines indicate the lag time at the maximum value of the fitted curve. (E) Schematic illustrating a plausible sequence of information flow from MCx to muscles during voluntary movements. (F) Same as in (E), but MCx signals activate muscles via the descending pathway (blue) and via the transafferent pathway (yellow).
Fig. 3.
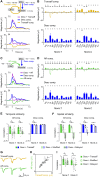
Fig. 3.. Multivariate information decomposition elucidates subcomponents.
(A) Models accounting for muscle activity evoked by descending and transafferent inputs. (B) Temporal relationship between the descending and transafferent inputs and muscle activity calculated from these inputs. (C) The observed muscle activity (triceps), its reconstruction using descending and transafferent inputs, and each subcomponent aligned to movement onset. Correlation coefficient between the observed muscle activity and the reconstruction using descending and transafferent inputs was 0.95. The shaded areas indicate the SEM. (D to F) Same as in (A) to (C) but for descending and afferent inputs, respectively. Correlation coefficient between the observed muscle activity and the reconstruction using descending and afferent inputs was 0.96.
Fig. 4.
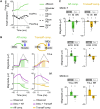
Fig. 4.. MCx encodes the activation of muscles through the spinal reflex pathway.
(A) Reconstruction using descending and transafferent inputs and each subcomponent aligned to movement onset. (B) Size of subcomponents (monkey T, 21 sessions; monkey C, 7 sessions). (C and D) Same as in (A) and (B) but for the descending and afferent components, respectively. (E) Temporal similarity between afferent and transafferent components (left) or across descending components (right) for different models (monkey T, 12 muscles; and monkey C, 10 muscles). (F) Same as in (E) but for the spatial similarity of afferent (left) or descending (right) components across muscles for different models (monkey T, 21 sessions; and monkey C, 7 sessions). (G) Transafferent and afferent components in three datasets. (H) Scatter plots of the size of transafferent versus afferent components. Dot, a single dataset. (I) Average correlation between afferent and transafferent components in the scatter plot for the different models (monkey T, 12 muscles; and monkey C, 10 muscles). In (B) and (D), data are the means ± SD. * and **P < 0.05, unpaired two-tailed t test for positive and negative values, respectively. In (E), (F), and (I), data are the means ± SEM. P < 0.05, one-way repeated-measures analysis of variance (ANOVA); *P < 0.05, paired two-tailed t test. P values are described in tables S1 to S5.
Fig. 5.
Fig. 5.. The effects of transafferent input on muscles are accounted for by the stretch reflex and reciprocal inhibition.
(A) Afferent activity and forelimb joint angles of monkey C when the monkey began to reach. EF, extension/ flexion; PS, pronation/supination. (B) Left: The observed muscle activity of monkey C, its reconstruction using descending and afferent inputs, and the afferent component of the reconstruction. The vertical lines indicate the time of movement onset. Right: The observed muscle activity, its reconstruction using descending and transafferent inputs, and transafferent component in the reconstruction. (C) Size of afferent (left column) and transafferent (right column) components for antagonistic muscle pairs (ext, extensor; and flex, flexor) in a period from the beginning of the reaching movement [55 to 100 ms around movement onset; shown in the green and yellow areas in (B), monkey T, 21 sessions; monkey C, 7 sessions]. Data are the means ± SD. *P < 0.05, unpaired two-tailed t test. P values are described in table S6.
Fig. 6.
Fig. 6.. M1 is a major predictor of muscle activity by descending and transafferent pathways.
(A) The thick, colored arrows show the inputs for which the modulation is represented in (B) to (D). (B) Top and second: Reconstruction of muscle activity using descending and transafferent inputs and subcomponents calculated from the activity in each cortical area aligned to the movement onset of monkey T. Bottom: Reconstruction of afferent activity using MCx activity and subcomponents calculated from the activity in each cortical area aligned to the movement onset of monkey T. (C) Size of subcomponents calculated from the activity in each cortical area for the prediction of muscle or afferent activity (monkey T, 12 muscles or 702 afferents). (D) Color maps representing the size of subcomponents calculated from the activity at each electrode for the prediction of muscle or afferent activity in monkey T. The size of each subcomponent is normalized by the extent of the reconstruction of muscle activity using the descending and transafferent inputs or the reconstruction of afferent activity using the descending input. CS, central sulcus; AS, arcuate sulcus. In (C), data are the means ± SEM. P < 0.05, one-way repeated-measures ANOVA, *P < 0.05, paired two-tailed t test. P values are described in table S7.
Fig. 7.
Fig. 7.. Sectioning of peripheral afferents impairs the transafferent activation of muscles by MCx.
(A) Experimental setup. (B) Left: Example of somatosensory evoked potentials (SEPs) elicited by electrical stimulation of a forelimb muscle (EDC). Right: Sizes of SEPs recorded over the primary somatosensory cortex (monkey P, 13 muscles; and monkey B, 12 muscles). (C) The observed muscle activity, its reconstruction using descending and transafferent inputs, and each subcomponent aligned to movement onset before dorsal rhizotomy. (D) Same as in (C), but after dorsal rhizotomy. (E) Total muscle activity (gray) and size of descending (blue) and transafferent (yellow) components before and after dorsal rhizotomy. The muscle activity and the sizes of descending and transafferent components after dorsal rhizotomy were compared to those observed before dorsal rhizotomy (monkey P, 13 muscles; and monkey B, 12 muscles). (F) Ratio of the size of the transafferent component to that of the descending component was compared before and after dorsal rhizotomy (monkey P, 13 muscles; and monkey B, 12 muscles). In (B), (E), and (F), data are the means ± SEM. *P < 0.05, paired two-tailed t test. P values are described in tables S8 to S10.

Similar articles

References

    1. Merel J., Botvinick M., Wayne G., Hierarchical motor control in mammals and machines. Nat. Commun. 10, 5489 (2019). - PMC - PubMed
    1. Felleman D. J., Van Essen D. C., Distributed hierarchical processing in the primate cerebral cortex. Cereb. Cortex 1, 1–47 (1991). - PubMed
    1. Schwartz A. B., Useful signals from motor cortex. J. Physiol. 579, 581–601 (2007). - PMC - PubMed
    1. Lemon R. N., Descending pathways in motor control. Annu. Rev. Neurosci. 31, 195–218 (2008). - PubMed
    1. Alstermark B., Isa T., Circuits for skilled reaching and grasping. Annu. Rev. Neurosci. 35, 559–578 (2012). - PubMed

LinkOut - more resources