Comparative Study
. 2024 Dec 20;10(51):eadq0645.
doi: 10.1126/sciadv.adq0645. Epub 2024 Dec 18.

A global comparison of surface and subsurface microbiomes reveals large-scale biodiversity gradients, and a marine-terrestrial divide

Affiliations
Comparative Study

A global comparison of surface and subsurface microbiomes reveals large-scale biodiversity gradients, and a marine-terrestrial divide

S Emil Ruff et al. Sci Adv. .

Abstract

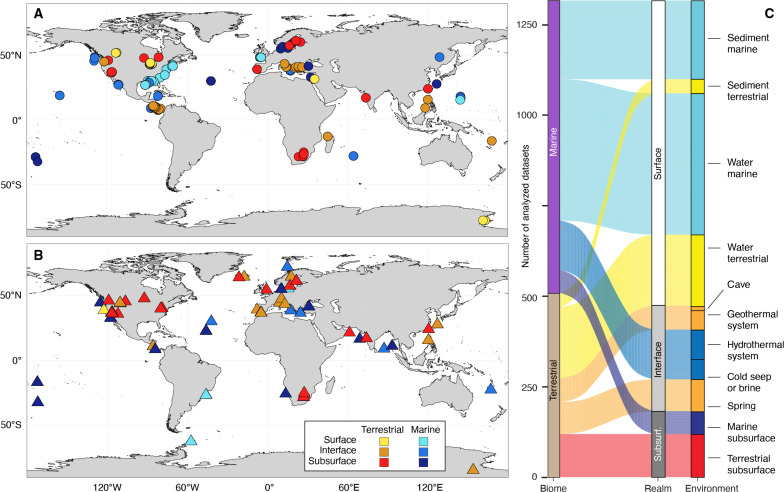
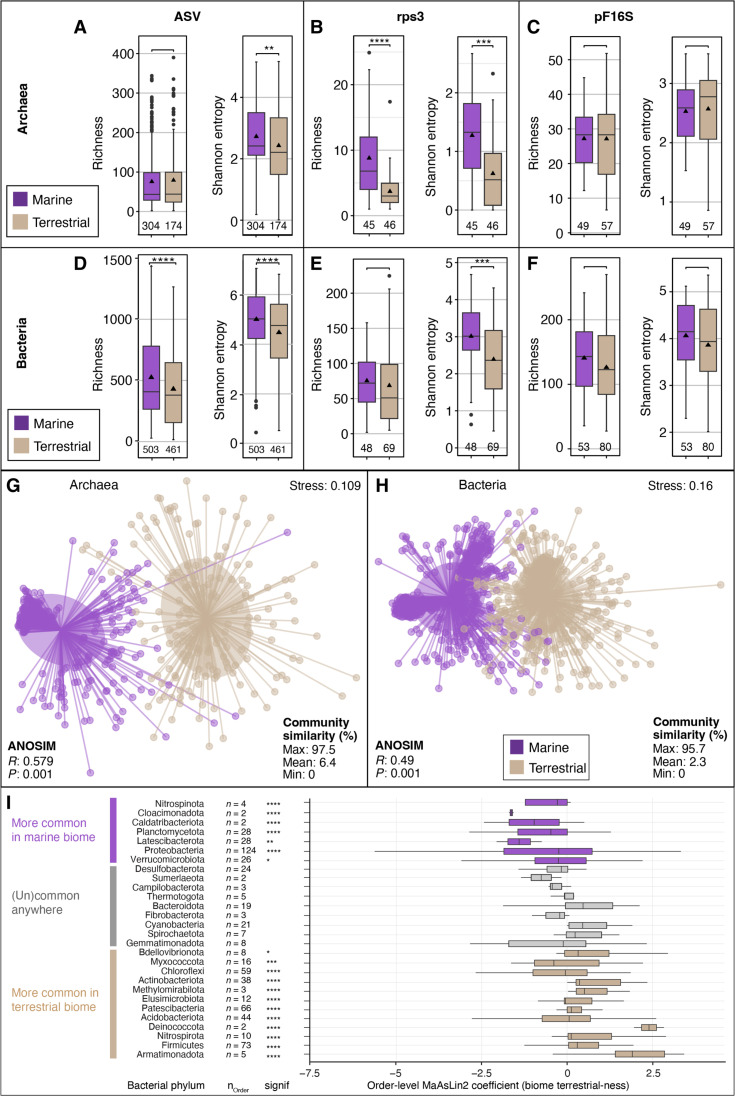
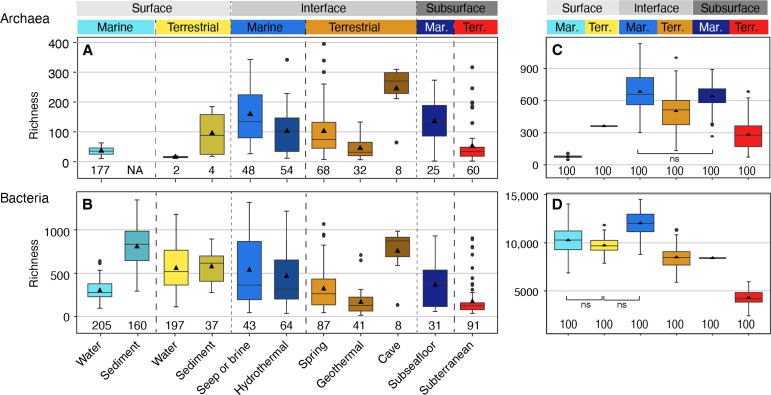
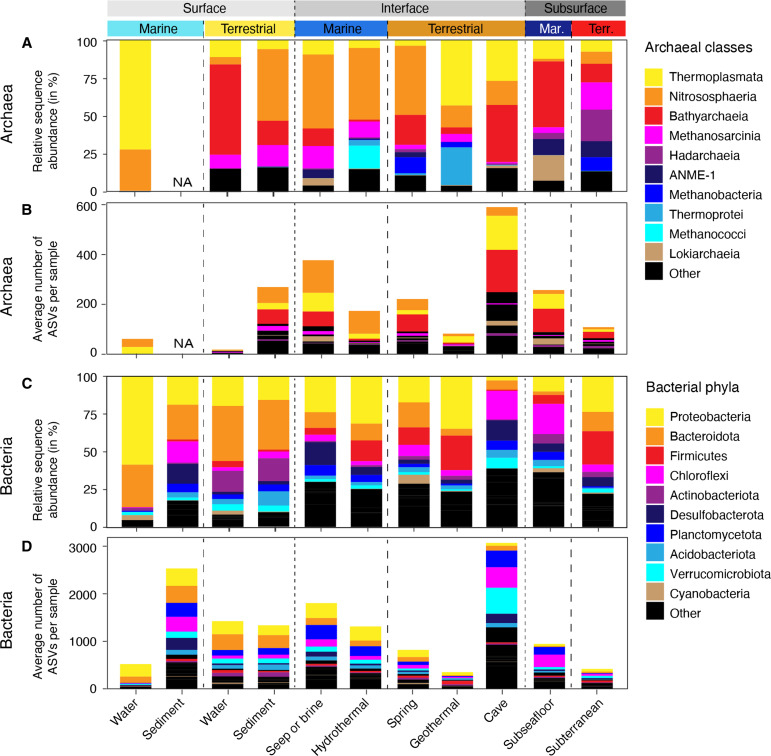
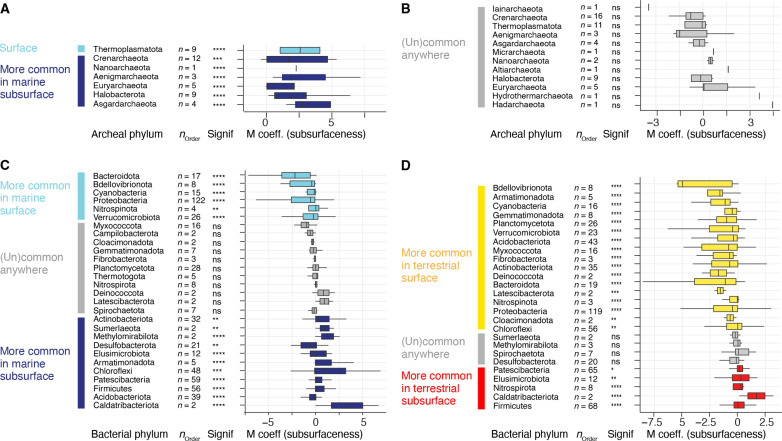
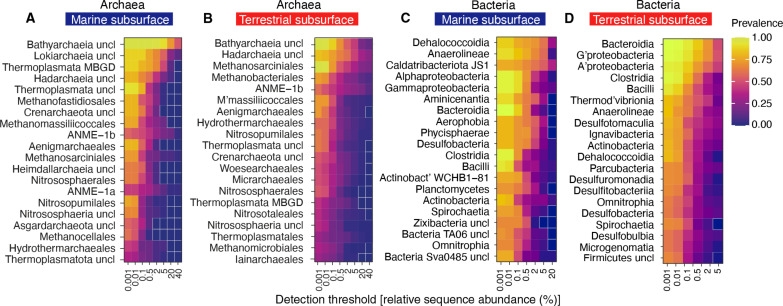
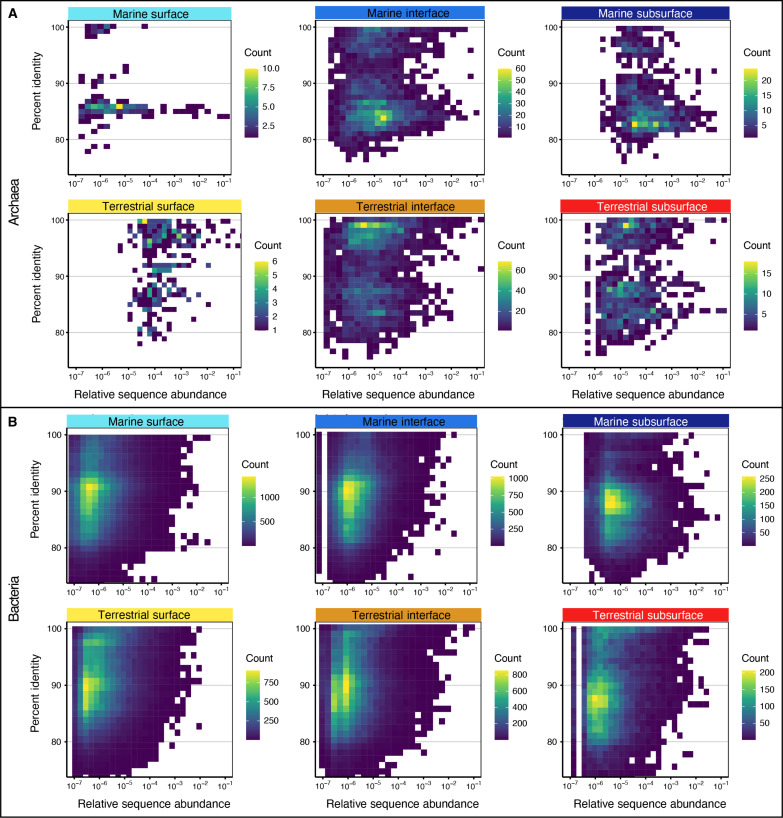
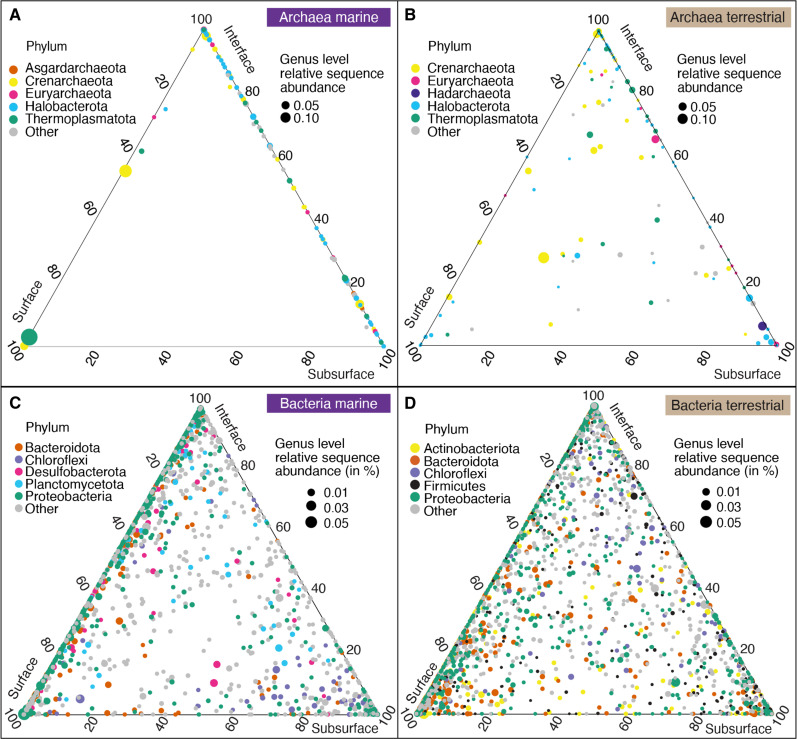
Subsurface environments are among Earth's largest habitats for microbial life. Yet, until recently, we lacked adequate data to accurately differentiate between globally distributed marine and terrestrial surface and subsurface microbiomes. Here, we analyzed 478 archaeal and 964 bacterial metabarcoding datasets and 147 metagenomes from diverse and widely distributed environments. Microbial diversity is similar in marine and terrestrial microbiomes at local to global scales. However, community composition greatly differs between sea and land, corroborating a phylogenetic divide that mirrors patterns in plant and animal diversity. In contrast, community composition overlaps between surface to subsurface environments supporting a diversity continuum rather than a discrete subsurface biosphere. Differences in microbial life thus seem greater between land and sea than between surface and subsurface. Diversity of terrestrial microbiomes decreases with depth, while marine subsurface diversity and phylogenetic distance to cultured isolates rivals or exceeds that of surface environments. We identify distinct microbial community compositions but similar microbial diversity for Earth's subsurface and surface environments.


Figures

Fig. 1.
Fig. 1.. Geographic location and origin of samples.
Maps of samples used for metabarcoding of 16S rRNA gene amplicon taxonomic marker genes (A) and shotgun metagenomic analyses of unassembled and de novo assembled taxonomic marker genes (B). Each symbol represents one project, which comprises multiple individual samples. Both terrestrial and marine samples may contain rock, sediment, or water samples. Further maps showing sample material, pH, and temperature are included in fig. S1. (C) Overview of sample origins derived from marine and terrestrial biomes, depth realms, and environments.
Fig. 2.
Fig. 2.. Microbial diversity in marine and terrestrial biome.
Archaeal (A to C) and bacterial (D to F) alpha diversity (per sample community richness and evenness) in marine and terrestrial biomes using 16S rRNA gene ASVs [(A) and (D)], as well as metagenome-derived ribosomal protein S3 genes [rpS3; (B) and (E)] and 16S rRNA gene sequences detected by phyloFlash (pF16S). To allow comparison, the datasets were subsampled to the same number of reads. Pairwise comparisons were performed using a Wilcoxon rank sum test. Significance: **P < 0.01, ***P < 0.001, ****P < 0.0001. The number of analyzed datasets is shown below the boxplots. Community dissimilarity between marine and terrestrial communities was shown by nonmetric multidimensional scaling ordinations of ASV-based dissimilarity matrices using 478 archaeal (G) and 964 bacterial datasets (H). Each dot represents the community structure of a dataset and is connected to the group centroid (weighted average mean of within-group distances); ellipses depict 1 SD of the centroid. Statistical testing using ANOSIM showed that the groups are overlapping but significantly different (R ∼ 0.5, P < 0.001). (I) Differential sequence abundance analyses of marine versus terrestrial bacterial phyla. The phyla are ordered from top to bottom based on increasing phylum level MaAsLin2 coefficient, i.e., likeliness of their occurrence in terrestrial-derived samples (“terrestrialness”). Boxplots summarize order level MaAsLin2 coefficients, i.e., terrestrialness, within the listed phyla. Note that due to ease of visualization, boxplots are also shown for very small number (n) of orders. Significance levels are: *P < 0.01, **P < 0.001, ***P < 0.0001, and ****P < 0.00001. Additional phyla, particularly those that lack cultured representatives, are shown in fig. S6.
Fig. 3.
Fig. 3.. Observed archaeal and bacterial richness across environments based on 16S rRNA gene ASVs.
Archaeal (A) and bacterial (B) richness found in the 11 studied environments (n: number of included samples). Environments are grouped on the basis of biome (marine, terrestrial) and depth realm (surface, interface, subsurface). Note that Archaeal terrestrial water and sediment samples contain too few datapoints for robust visualization using boxplots, yet the plots were retained for completeness. NA, no value available. Total archaeal (C) and bacterial richness (D) using a subsampling approach to account for different group sizes (100 iterations using 1142 archaeal or 2271 bacterial reads, respectively). Normalized gamma diversity corroborates that archaeal diversity is highest in marine interface and subsurface ecosystems even when different group sizes are considered. All pairwise comparisons were significantly different (P < 0.001) except for those indicated with ns (not significant). Shannon entropy values and a subsampling approach using 50,000 reads show the same trends (fig. S11). The diversity found in individual subsurface environments and their comparison to surface and interface environments is shown in the fig. S14.
Fig. 4.
Fig. 4.. Relative sequence abundance and richness of most important lineages across environments.
Relative sequence abundance of top 10 most sequence abundant archaeal classes (A) and bacterial phyla (C) in the 11 studied environments. Contribution of most sequence abundant lineages to average number of archaeal (B) and bacterial (D) ASVs per sample (richness). Note that the most abundant clades do not necessarily show the highest richness, e.g., Planctomycetota are the seventh most sequence abundant clade [(C)] yet the third most diverse [(D)].
Fig. 5.
Fig. 5.. Multivariate association analyses of microbial lineages.
Analyses compare the occurrence of archaeal (A and B) bacterial (C and D) in marine [(A) and (C)] and terrestrial [(B) and (D)] surface versus subsurface realms. The phyla are ordered from top to bottom based on increasing likeliness of their occurrence in subsurface-derived samples (increasing MaAsLin2 coefficients; “subsurfaceness”). Boxplots summarize order level MaAsLin2 coefficients within the listed phyla. Note that due to ease of visualization, boxplots are even shown for very small number (n) of orders. The significance of the MaAsLin2 phylum level coefficient is shown in the column denoted “signif.” Significance levels are: not significant (ns), *P < 0.05, **P < 0.01, ***P < 0.001, and ****P < 0.0001. An analysis based on all surface versus subsurface samples regardless of the biome of origin is shown in fig. S18, and additional bacterial phyla are shown in figs. S19 to S21.
Fig. 6.
Fig. 6.. Subsurface core microbiomes.
The heatmaps show potential archaeal order level core microbiomes in the marine (A) and terrestrial subsurface (B), as well as bacterial class level core microbiomes in the marine (C) and terrestrial subsurface (D). The 20 most relevant lineages, regarding their prevalence and RSAs, are shown as rows, and each column color represents the lineages prevalence at a certain RSA threshold. Uncultured/unclassified lineages are denoted by “uncl,” and the closest known phylogenetic level or the closest phylogenetic level with an isolated representative is shown. For example, Bathyarchaeia uncl are all uncultured/unclassified/order-level clades in the class Bathyarchaeia. Fields that are zero have a white outline.
Fig. 7.
Fig. 7.. Microbial phylogenetic distance relative to cultured organisms.
Percent identity values (PIVs) of archaeal (A) and bacterial (B) ASVs relative to their closest cultured relative for the studied biomes and realms. Each square in the density plot represents one ASV and depicts its PIV (y axis) and RSA (x axis, logarithmic). The color gradient shows how many ASVs have identical PIV and RSA. The more yellow, the more ASVs are represented by the square.
Fig. 8.
Fig. 8.. Genus-level diversity within and between depth realms.
Ternary plots show archaeal (A and B) and bacterial genus-level diversity (C and D) in the marine [(A) and (C)] and terrestrial biome [(B) and (D)]. Each circle is a genus-level clade, circle size is average RSA in the respective biome, and circle colors represent to which of the top 5 phyla the lineage belongs. The location of the circle shows the proportional average RSA in each depth realm (surface, interface and subsurface) scaled to sum 100%. For example, if a circle lies exactly in the center of the plot, then the respective lineage has an equal RSA in each of the three depths, if it lies at one of the corners (e.g., surface), then it means it occurs only in the surface, and circles that lie on the sides of the plot occur in only two of the three depths.

References

    1. Takai K., Nakamura K., Toki T., Tsunogai U., Miyazaki M., Miyazaki J., Hirayama H., Nakagawa S., Nunoura T., Horikoshi K., Cell proliferation at 122°C and isotopically heavy CH4 production by a hyperthermophilic methanogen under high-pressure cultivation. Proc. Natl. Acad. Sci. U.S.A. 105, 10949–10954 (2008). - PMC - PubMed
    1. Merino N., Aronson H. S., Bojanova D. P., Feyhl-Buska J., Wong M. L., Zhang S., Giovannelli D., Living at the extremes: Extremophiles and the limits of life in a planetary context. Front. Microbiol. 10, 780 (2019). - PMC - PubMed
    1. Edgcomb V. P., Molyneaux S. J., Böer S., Wirsen C. O., Saito M., Atkins M. S., Lloyd K., Teske A., Survival and growth of two heterotrophic hydrothermal vent archaea, Pyrococcus strain GB-D and Thermococcus fumicolans, under low pH and high sulfide concentrations in combination with high temperature and pressure regimes. Extremophiles. 11, 329–342 (2007). - PubMed
    1. Ando N., Barquera B., Bartlett D. H., Boyd E., Burnim A. A., Byer A. S., Colman D., Gillilan R. E., Gruebele M., Makhatadze G., Royer C. A., Shock E., Wand A. J., Watkins M. B., The molecular basis for life in extreme environments. Annu. Rev. Biophys. 50, 343–372 (2021). - PubMed
    1. Bar-On Y. M., Phillips R., Milo R., The biomass distribution on Earth. Proc. Natl. Acad. Sci. U.S.A. 115, 6506–6511 (2018). - PMC - PubMed

Publication types

LinkOut - more resources