. 2025 Apr 2;15(4):717-732.
doi: 10.1158/2159-8290.CD-24-0916.

Stratified Medicine Pediatrics: Cell-Free DNA and Serial Tumor Sequencing Identifies Subtype-Specific Cancer Evolution and Epigenetic States

Affiliations

Stratified Medicine Pediatrics: Cell-Free DNA and Serial Tumor Sequencing Identifies Subtype-Specific Cancer Evolution and Epigenetic States

Sally L George et al. Cancer Discov. .

Abstract

In tumors of childhood, we identify mutations in epigenetic genes as drivers of relapse, with matched cfDNA sequencing showing significant intratumor genetic heterogeneity and cell-state specific patterns of chromatin accessibility. This highlights the power of cfDNA analysis to identify both genetic and epigenetic drivers of aggressive disease in pediatric cancers.


Conflict of interest statement

S.L. George reports other support from Recordati outside the submitted work. C.M. Sauer reports grants and personal fees from Marie Skłodowska-Curie Actions during the conduct of the study. M. Oostveen reports grants from Cancer Research UK during the conduct of the study. S.C. Clifford reports grants from Cancer Research UK during the conduct of the study. D.A. Tweddle reports grants from Cancer Research UK/Blood Cancer UK during the conduct of the study. G.A.A. Burke reports other support from Novartis and AstraZeneca outside the submitted work. J. Turnbull reports other support from government during the conduct of the study. S. Wilson reports personal fees from Norgine and Bayer outside the submitted work. S.A. Gatz reports other support from EMD Serono/Merck KgaA, Amgen, Gilead, GSK, and Schroedinger Therapeutics, grants and other support from AstraZeneca, and grants from Bayer outside the submitted work. L.V. Marshall reports grants from Cancer Research UK during the conduct of the study. T.A. Graham reports other support from DAiNA Therapeutics and Genentech outside the submitted work, as well as a patent for GB2305655.9 pending and a patent for GB2317139.0 pending. B. Al-Lazikani reports grants from Cancer Research UK during the conduct of the study, as well as other support from Excientia PLC now part of Recursion Pharmaceuticals, AstraZeneca, GSK, Astex pharmaceuticals, Stante Ventures, and Astellas Pharmaceuticals outside the submitted work; serving as a member of the scientific committee for Fight Kids Cancer. P. Kearns reports grants from Cancer Research UK during the conduct of the study. D. Hargrave reports personal fees from Novartis, Day One Therapeutics, Ipsen, Biodexa, and Kestrel Therapeuatics and grants and personal fees from Alexion/AstraZeneca outside the submitted work. T.S. Jacques reports grants from Cancer Research UK during the conduct of the study, as well as The Brain Tumor Charity, NIHR, The Olivia Hodson Cancer Foundation, and Children with Cancer UK, other support from Neuropath Ltd and Repath Ltd, and personal fees from Wiley and Elsevier outside the submitted work. M. Hubank reports personal fees from AstraZeneca, Janssen, Alira Health, Servier, Seagen, Qiagen, Roche, and Novartis and nonfinancial support from Guardant Health outside the submitted work. L. Chesler reports grants from Cancer Research UK, Children with Cancer UK, Christopher’s Smile, Abbie’s Fund, and Aoife’s Bubbles and other support from HEFCE/RAE during the conduct of the study. No disclosures were reported by the other authors.

Figures
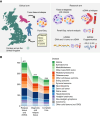
Figure 1.
Figure 1.
Study design. A, Schematic of the study design. Clinical arm, left: rapid turn-around reporting of sequence and CNVs from Panel-Seq of relapse tissue from 20 centers across the United Kingdom. Research arm, right: comparative studies between diagnostic or relapse tissue samples and cfDNA at relapse. Panel-Seq and lcWGS were performed for all analytes if possible, with Panel-Seq taking priority. lcWGS was utilized for CNA, tumor purity/ctDNA content estimation, and fragmentomics of cfDNA. B, Diagnoses of the patients included in the study for whom paired analysis was performed. Tumor types with less than five samples are grouped together. Totals are indicated at the top of each bar.
Figure 2.
Figure 2.
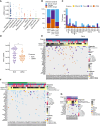
The genomic landscape of matched primary and relapse pediatric tumor samples. A, Oncoplot of mutations detected in tissue at diagnosis and relapse, excluding clinically defined hypermutator SMP0342 (n = 276). Only cases with at least one SNV or indel are shown (n = 149). Sample purity was estimated by lcWGS and patient demographics are annotated (top). The purity is shown in white when no lcWGS sample was available. Histograms at the top and right indicate the total number of mutations in each patient and gene, respectively (purple—detected in both primary and relapse, blue—primary only, orange—relapse only, and yellow—different mutations in the same gene between diagnosis and relapse). B, Genes with mutations acquired at relapse and ordered by the frequency of relapse-specific mutations in the whole cohort (n = 276, variant positive n = 149), in patients with (C) sarcoma (n = 78, variant positive n = 44), and (D) in patients with neuroblastoma (n = 58, variant positive n = 36).
Figure 3.
Figure 3.
Pediatric cancers at relapse show enrichment of mutations in epigenetic modifiers. A, The number of mutations detected in primary (blue) and relapse (orange) tissue using Panel-Seq. n = 276 pairs, *** Wilcoxon test, P = 0.000646. B, Fraction of genome altered at primary and relapse estimated by lcWGS for pairs with purity ≥0.1, n= 126, ** Wilcoxon test, P = 0.0015. A horizontal bar is drawn at the median FGA. C–E, Mirror plots depicting the frequency of CNVs observed across the genome in C primary tumors, D relapsed tumors, and E in the comparison of primary with relapse tumors. Only cases with purity >0.15 were included, n = 119. Amplifications (red), gains (light red), deletions (blue), and losses (light blue). Key clinically relevant genes with focal CNVs are labeled at their cytogenetic location. Gene labels above or below the x-axis are amplified or lost, respectively. Only genes altered in five or more patients are shown. F, Confidence intervals of dN/dS for missense (red) and truncating mutations (blue). For paired cases, n = 275, mutations were pooled for primary or relapse samples. “Unique to relapse” mutations were collected by removing the mutations found in the primary sample in each pair. Samples from patients with an abundance of synonymous mutations (SMP0342 and SMP0448) were excluded from dN/dS analysis. G, Scatterplots comparing dN/dS at primary and relapse for missense (red) and truncating mutations (blue). Genes with positive selection for nonsynonymous mutations at relapse but not at diagnosis are labeled and colored. The top two genes with the greatest selection for nonsynonymous mutations at both diagnosis and relapse are labeled. CDKN2A.p16ink4a and CDKN2A.p14arf are both labeled CDKN2A.
Figure 4.
Figure 4.
Sequencing of high-purity cfDNA at the time of relapse better reflects tumor heterogeneity than tissue sequencing. A, Fraction of total cfDNA that is tumor derived, estimated by lcWGS, split according to diagnostic group. B, The proportion of variants detected in cfDNA only, tissue only, and both samples across the whole cohort, regardless of cfDNA purity in high-purity cfDNA samples (>10% ctDNA by lcWGS) and low-purity cfDNA samples (<10% ctDNA by lcWGS). C, Bar chart showing genes with the most cfDNA-specific variants detected across the cohort as a whole, ordered by the number of cfDNA-unique variants. D, Average VAF of cfDNA-specific variants vs. variants that were present in both tissue and cfDNA (***, Wilcoxon test P = 0.0002. E, Oncoplot showing comparison of tissue and cfDNA sequencing in patients with neuroblastoma. F, Oncoplot showing comparison of tissue and cfDNA sequencing in patients with brain tumors. G, Oncoplot showing comparison of tissue and cfDNA sequencing in patients with lymphoma.
Figure 5.
Figure 5.
cfDNA analysis identifies aggressive subclones and predicts relapse in neuroblastoma. A, Copy number phylogeny from patient SMP0083. B, lcWGS copy number profiles of patient SMP0083 with neuroblastoma: primary and relapse tissue sample biopsies at primary thoracic site, cfDNA sample at relapse, and additional relapse tissue biopsy sample collected from a metastatic lesion in the liver. C, Tissue and cfDNA purity of samples harboring cfDNA-exclusive UHR mutations and tissue-exclusive UHR mutations. D, The distribution of UHR mutations in cfDNA and tissue. E, Levels of ALK mutation detected by Panel-Seq and total cfDNA levels (ng/ml of plasma) from patient SMP0409 while on treatment. The % VAF of ALK mutation detected in cfDNA is shown in black circles with the y axis on the left. At three timepoints indicated by asterisks, cfDNA sequencing was of suboptimal depth (<250×); therefore, VAF should be interpreted with caution. Total cfDNA levels shown in grey with the y axis on the right. Treatment starting points are indicated by dark red arrows and progression as indicated by MRI scan is highlighted with bright red arrows. F, Levels of mutations (as indicated by the key) detected by Panel-Seq and total cfDNA levels (ng/ml of plasma) in a patient LB001 while on treatment. The % VAF of ALK mutation detected in cfDNA is shown by back circles and the y axis on the left. Total cfDNA levels shown in grey with the y axis on the right. Progression as indicated by MRI scan is highlighted with bright red arrows. GD2, anti-GD2 immunotherapy; temo, Temozolomide; topo, Topotecan.
Figure 6.
Figure 6.
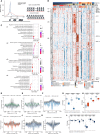
Nucleosome profiling of cfDNA lcWGS reveals signals associated with pediatric cancer subtype. A, Fragmentomics schematic showing that cfDNA is enriched for subnucleosome fragments (120–180 bp). cfDNA preferentially fragments at open chromatin leading to a loss of reads. Therefore, coverage can be used to infer active sites and nucleosome positioning. B, Hierarchically clustered heatmap of the normalized composite coverage for TFBS which showed significantly disease-dependent variance as determined by Wilcoxon rank-sum tests. Disease type, ctDNA content (purity), MYCN amplification, and the presence of fusion gene are annotated at the top. Disease-specific clusters are labeled c1–c4. Genes of interest are labeled. Only cfDNA samples with a ctDNA content of over 20% were used and those belonging to a diagnostic group with less than three patients were not included (n = 85). C, Gene ontology analysis for clusters c1–c4. D–F, Composite normalized coverage for 1 kb ± TFBSs. The solid lines show the mean and the ribbons indicate the range from the 10th to the 90th percentile. Average coverage for a specific disease group is plotted with all other samples with >20% ctDNA content as indicated by the key. Additionally, a third line for ctDNA content <10% is plotted in D and E. The TFBSs plotted are indicated by the x-axis title. G and H, Box plots comparing coverage at disease-specific CRC TBFSs in hepatoblastoma (G) and rhabdomyosarcoma (H). I–K, Composite-normalized coverage for 1 kb ± TFBSs. The solid lines show the mean and the ribbons indicate the range from the 10th to the 90th percentile. Average coverage for a specific disease group is plotted with all other samples with >20% ctDNA content as indicated by the key. The TFBSs plotted are indicated by the x-axis title. L, Box plots comparing coverage at disease-specific CRC TBFSs in neuroblastoma. Wilcoxon rank-sum test: *, P < 0.05; **, P < 0.01; ***, P < 0.001; ****, P < 0.0001.

References

    1. Goldstick JE, Cunningham RM, Carter PM. Current causes of death in children and adolescents in the United States. N Engl J Med 2022;386:1955–6. - PMC - PubMed
    1. Kyu HH, Stein CE, Boschi Pinto C, Rakovac I, Weber MW, Dannemann Purnat T, et al. . Causes of death among children aged 5–14 years in the WHO European Region: a systematic analysis for the Global Burden of Disease Study 2016. Lancet Child Adolesc Health 2018;2:321–37. - PMC - PubMed
    1. Perkins SM, Shinohara ET, DeWees T, Frangoul H. Outcome for children with metastatic solid tumors over the last four decades. PLoS One 2014;9:e100396. - PMC - PubMed
    1. Ceschel S, Casotto V, Valsecchi MG, Tamaro P, Jankovic M, Hanau G, et al. . Survival after relapse in children with solid tumors: a follow-up study from the Italian off-therapy registry. Pediatr Blood Cancer 2006;47:560–6. - PubMed
    1. Berlanga P, Pierron G, Lacroix L, Chicard M, Adam de Beaumais T, Marchais A, et al. . The European MAPPYACTS trial: precision medicine program in pediatric and adolescent patients with recurrent malignancies. Cancer Discov 2022;12:1266–81. - PMC - PubMed