

Cumulative deficits frailty index and relationship status predict survival in multiple myeloma
- PMID: 39693516
- PMCID: PMC11914168
- DOI: 10.1182/bloodadvances.2024014624
Cumulative deficits frailty index and relationship status predict survival in multiple myeloma
Abstract
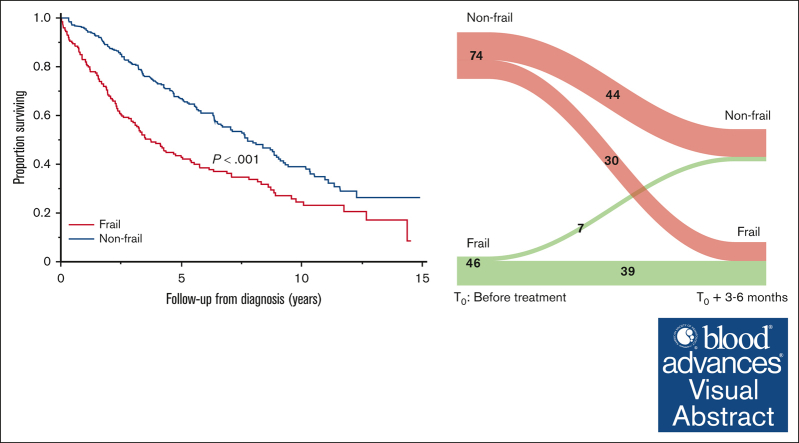
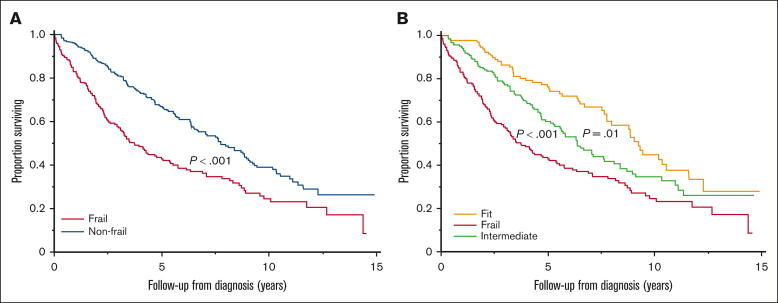
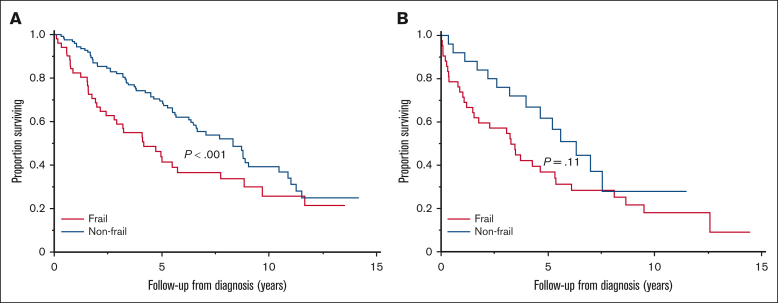
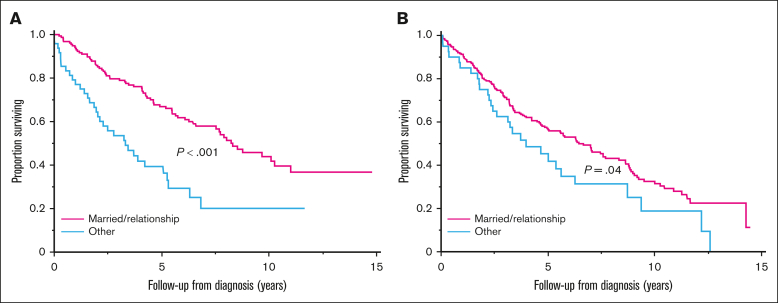
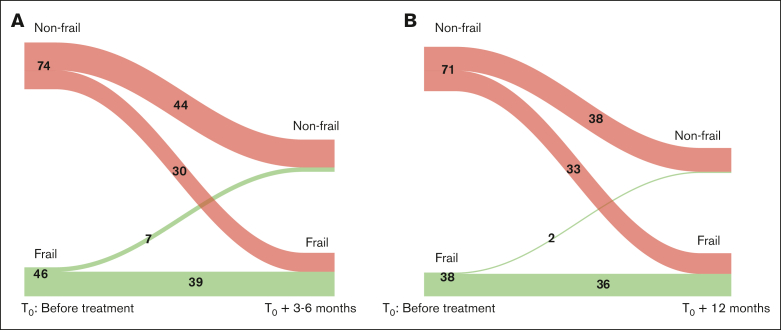
Several tools have been proposed for assessing frailty in multiple myeloma (MM), but most are based on clinical trial data sets. There are also limited data on the association between frailty and patient-reported outcomes and on the prognostic value of social determinants of health. This study evaluates the prognostic impact of frailty, based on the cumulative deficit frailty index (FI), and relationship and socioeconomic status (SES) in patients with newly diagnosed MM. This retrospective study included 515 patients with MM seen at Mayo Clinic (Rochester, MN) at diagnosis between 2005 and 2018. The FI was calculated using patient-reported data on activities of daily living and comorbidity data, with items scored as 0, 0.5, or 1, in which 1 indicated a deficit. The FI was calculated by dividing the total score by the number of nonmissing items. Frailty was defined as FI ≥0.15; 61% were nonfrail, and 39% were frail. Frailty and nonmarried/relationship status were associated with higher disease stage, decreased the likelihood of early transplantation, and independently associated with decreased survival. SES was not independently associated with survival. Frail patients reported worse scores for fatigue, pain, and quality of life. Approximately a quarter of patients had a deterioration in frailty status at 3 to 12 months, and <10% had improvement. In conclusion, a cumulative deficit FI was associated with higher symptom burden and decreased survival in a real-world cohort of patients with newly diagnosed MM. Frailty status is dynamic and should be reassessed during treatment. Social support has prognostic value and should be evaluated in clinical practice.
© 2025 American Society of Hematology. Published by Elsevier Inc. Licensed under Creative Commons Attribution-NonCommercial-NoDerivatives 4.0 International (CC BY-NC-ND 4.0), permitting only noncommercial, nonderivative use with attribution. All other rights reserved.
Conflict of interest statement
Conflict-of-interest disclosure: A.D. received research funding from Celgene, Millennium Pharmaceuticals, Pfizer, and Janssen, and a travel grant from Pfizer. M.A.G. served as a consultant for Millennium Pharmaceuticals and received honoraria from Celgene, Millennium Pharmaceuticals, Onyx Pharmaceuticals, Novartis, GlaxoSmithKline, Prothena, Ionis Pharmaceuticals, and Amgen. M.Q.L. received research funding from Celgene. S.V.R. received grants from the National Institutes of Health and research funding from Celgene for clinical trials. S.K.K. served as a consultant for Celgene, Millennium Pharmaceuticals, Onyx Pharmaceuticals, Janssen, and Bristol Myers Squibb, and received research funding from Celgene, Millennium Pharmaceuticals, Novartis, Onyx Pharmaceuticals, AbbVie, Janssen, and Bristol Myers Squibb. The remaining authors declare no competing financial interests.
Figures
Similar articles
-
Assessing frailty in patients with relapsed/refractory multiple myeloma: A comparison between the patient-reported frailty phenotype and the International Myeloma Working Group frailty index.J Geriatr Oncol. 2025 Jul;16(6):102266. doi: 10.1016/j.jgo.2025.102266. Epub 2025 Jun 4. J Geriatr Oncol. 2025. PMID: 40472573
-
Systemic pharmacological treatments for chronic plaque psoriasis: a network meta-analysis.Cochrane Database Syst Rev. 2021 Apr 19;4(4):CD011535. doi: 10.1002/14651858.CD011535.pub4. Cochrane Database Syst Rev. 2021. Update in: Cochrane Database Syst Rev. 2022 May 23;5:CD011535. doi: 10.1002/14651858.CD011535.pub5. PMID: 33871055 Free PMC article. Updated.
-
Prognostic impact of patient-reported symptoms in multiple myeloma.Blood Adv. 2025 Feb 25;9(4):884-892. doi: 10.1182/bloodadvances.2024014232. Blood Adv. 2025. PMID: 39637309 Free PMC article.
-
A rapid and systematic review of the clinical effectiveness and cost-effectiveness of paclitaxel, docetaxel, gemcitabine and vinorelbine in non-small-cell lung cancer.Health Technol Assess. 2001;5(32):1-195. doi: 10.3310/hta5320. Health Technol Assess. 2001. PMID: 12065068
-
Comparison of Two Modern Survival Prediction Tools, SORG-MLA and METSSS, in Patients With Symptomatic Long-bone Metastases Who Underwent Local Treatment With Surgery Followed by Radiotherapy and With Radiotherapy Alone.Clin Orthop Relat Res. 2024 Dec 1;482(12):2193-2208. doi: 10.1097/CORR.0000000000003185. Epub 2024 Jul 23. Clin Orthop Relat Res. 2024. PMID: 39051924
References
-
- National Cancer Institute; Surveillance, Epidemiology, and End Results Program Cancer Stat Facts: Myeloma. 2020. https://seer.cancer.gov/statfacts/html/mulmy.html
-
- Binder M, Nandakumar B, Rajkumar SV, et al. Mortality trends in multiple myeloma after the introduction of novel therapies in the United States. Leukemia. 2022;36(3):801–808. - PubMed
-
- Gavriatopoulou M, Fotiou D, Koloventzou U, et al. Vulnerability variables among octogenerian myeloma patients: a single-center analysis of 110 patients. Leuk Lymphoma. 2019;60(3):619–628. - PubMed
-
- Mian HS, Kouroukis CT, Pond GR, Seow H, Sussman J. Undertreatment of older patients with newly-diagnosed multiple myeloma: real world evidence from a Canadian registry cohort. Blood. 2019;134(suppl 1):268.
MeSH terms
Grants and funding
LinkOut - more resources
Full Text Sources
Medical
