. 2025 Feb 20;145(8):881-896.
doi: 10.1182/blood.2024024540.

Oral inflammation and microbiome dysbiosis exacerbate chronic graft-versus-host disease

Affiliations

Oral inflammation and microbiome dysbiosis exacerbate chronic graft-versus-host disease

Yui Kambara et al. Blood. .

Abstract

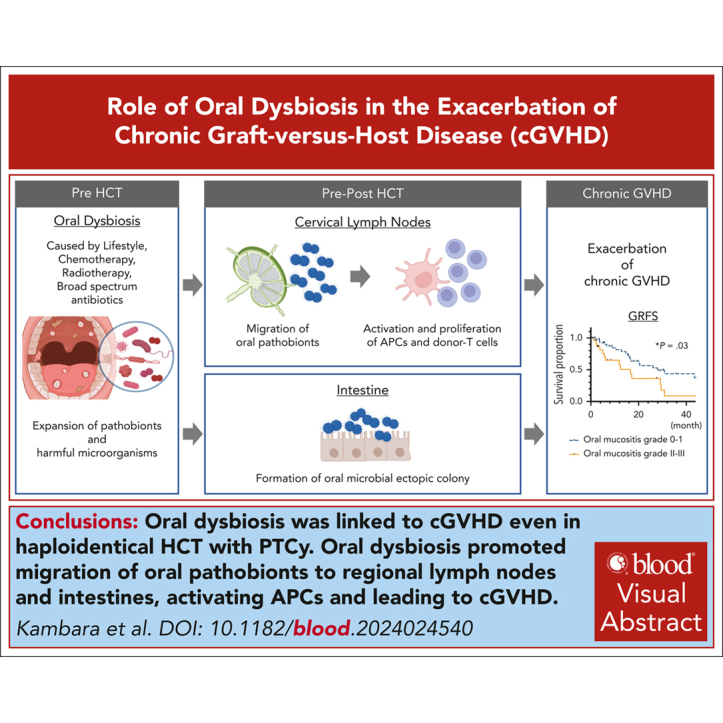
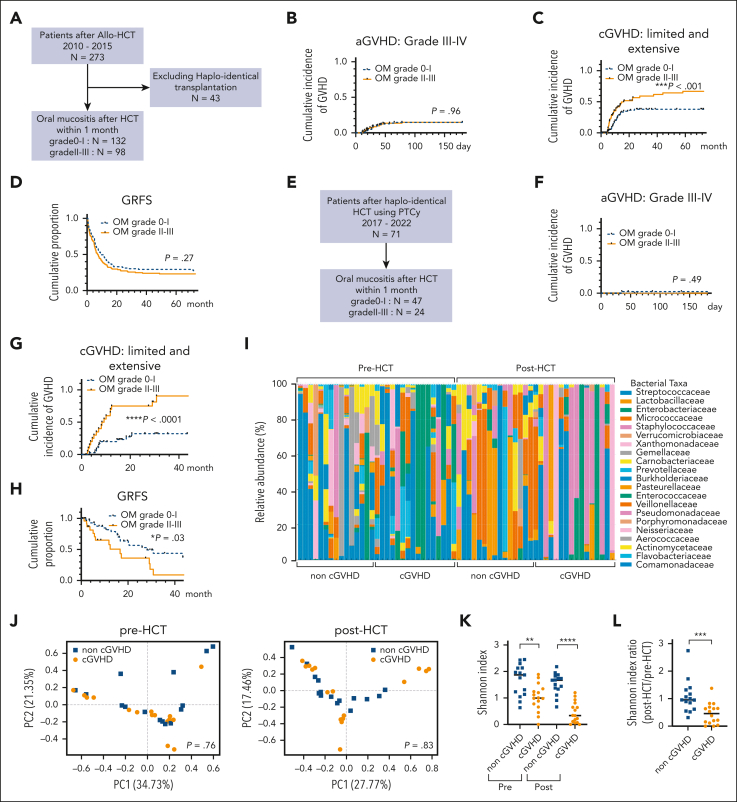
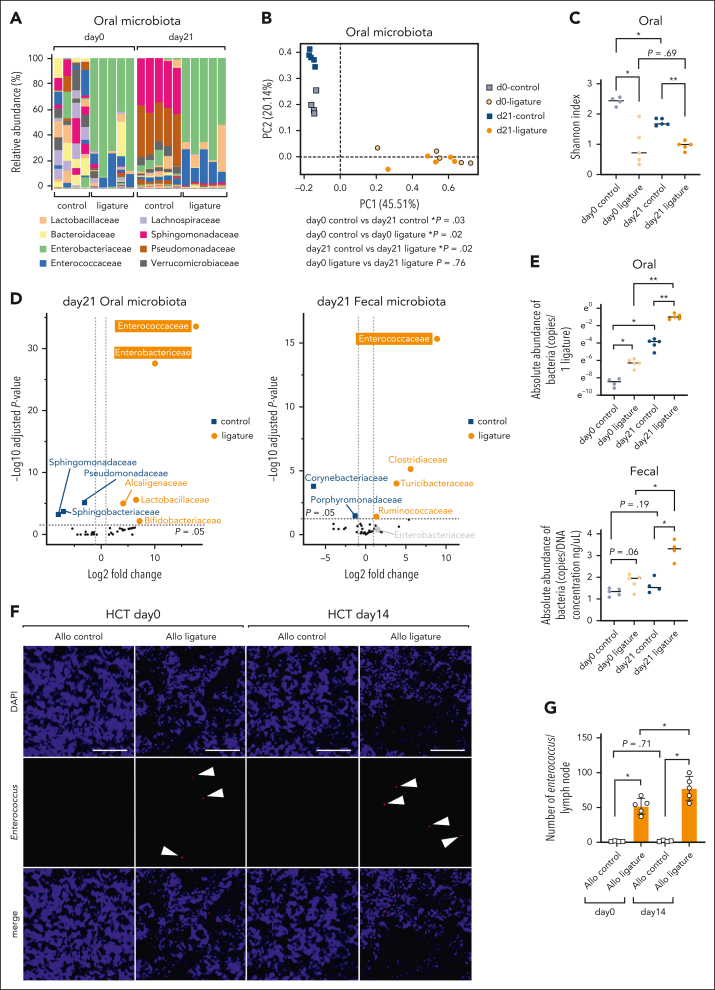
The oral microbiota, second in abundance to the gut, is implicated in chronic systemic diseases, but its specific role in graft-versus-host disease (GVHD) pathogenesis has been unclear. Our study finds that mucositis-induced oral dysbiosis in patients after hematopoietic cell transplantation (HCT) associated with increased chronic GVHD (cGVHD), even in patients receiving posttransplant cyclophosphamide. In murine HCT models, oral dysbiosis caused by bilateral molar ligatures exacerbated cGVHD and increased bacterial load in the oral cavity and gut, with Enterococcaceae significantly increasing in both organs. In this model, the migration of Enterococcaceae to cervical lymph nodes both before and after transplantation activated antigen-presenting cells, thereby promoting the expansion of donor-derived inflammatory T cells. Based on these results, we hypothesize that pathogenic bacteria increase in the oral cavity might not only exacerbate local inflammation but also enhance systemic inflammation throughout the HCT course. Additionally, these bacteria translocated to the gut and formed ectopic colonies, further amplifying systemic inflammation. Furthermore, interventions targeting the oral microbiome mitigated murine cGVHD. Collectively, our findings highlight the importance of oral dysbiosis in cGVHD and suggest that modulation of the oral microbiome during transplantation may be an effective approach for preventing or treating cGVHD.


Conflict of interest statement

Conflict-of-interest disclosure: N.A. reports research funding from Novartis, Japan and honoraria from Novartis, Japan; AbbVie, Japan; Astellas, Japan; Asahi Kasei, Japan; Chugai, Japan; and Otsuka, Japan. D.E. reports research funding from Nippon Shinyaku, Japan; Chugai, Japan; and Otsuka, Japan; and honoraria from Eisai, Japan; Chugai, Japan; Kyowa Kirin, Japan; SymBio, Japan; and Bristol Myers Squibb, Japan. The remaining authors declare no competing financial interests.

Figures

None
Graphical abstract
Figure 1.
Figure 1.
OM and dysbiosis correlated with cGVHD in allo-HCT recipients. (A) The study flow chart for the retrospective cohort of allo-HCT recipients excluding those that received a haploidentical HCT with antithymocyte globulin due to persistent disease and a high-risk comorbidity index is shown. Outcomes for patients with (grades 2-3) or without moderate-to-severe OM are shown (B-D). The statistical significance between the 2 groups in panels B and C was assessed using the Gray test to account for competing risks. (B) The cumulative incidence of aGVHD (grades 3-4) 180 days after allo-HCT between the 2 groups described in panel A is shown. (C) The cumulative incidence of cGVHD (limited and extensive) 60 months after allo-HCT is shown for patients with (grades 2-3) or without moderate-to-severe OM. (D) The cumulative proportion of GRFS 60 months after allo-HCT is shown for the patient groups described in panel A. Statistical significance between the 2 groups was determined using the log-rank test with aGVHD (grades 3-4), cGVHD (extensive), relapse, and death as events. (E) The study flow chart for the retrospective cohort of patients receiving a haplo-PTCy is shown. Outcomes for patients with (grades 2-3) or without moderate-to-severe OM are shown (F-H). The statistical significance between the 2 groups in panels F and G was assessed using the Gray test to account for competing risks. (F) The cumulative incidence of aGVHD (grades 3-4) 180 days after haplo-PTCy is shown for the patient groups described in panel E. (G) The cumulative incidence of cGVHD (limited and extensive) at 36 months after haplo-PTCy is shown for the patient groups described in panel E. (H) Cumulative proportion of GRFS at 36 months after haplo-PTCy is shown for the patient groups described in panel E. Statistical significance between the 2 groups was determined using the log-rank test with aGVHD (grades 3-4), cGVHD (extensive), relapse, and death as events. (I) The relative abundance of buccal mucosa microbiota (family level) preconditioning and at engraftment for patients who did or did not go on to develop cGVHD (n = 15 without cGVHD, n = 16 with cGVHD) is shown. (J) Principal coordinate analysis (PCoA) by analysis of molecular variance (AMOVA) of buccal mucosa microbiota family composition from each patient before conditioning and at engraftment for patients who did or did not go on to develop cGVHD (n = 15 without cGVHD, n = 16 with cGVHD) is shown. (K) α-Diversity (Shannon index) of buccal mucosa microbiota before and after HCT for each group are shown. Statistical significance between those with (n = 16) and without (n = 15) cGVHD was determined using the Mann-Whitney U test (∗∗P < .01; ∗∗∗P < .001). Error bars represent the mean ± the standard deviation (SD). (L) Changes in α-diversity (Shannon index) of buccal mucosa microbiota before conditioning and at engraftment for each group are shown. Shannon index ratio = Shannon index at engraftment/Shannon index before conditioning. Statistical significance between those with (n = 16) and without (n = 15) cGVHD was determined using the Mann-Whitney U test (∗∗P < .01). Error bars represent the mean ± the SD. PC, principal coordinate.
Figure 2.
Figure 2.
Murine OLP leads to local inflammation and oral dysbiosis. (A) OLP using a 5-0 silk suture with 2 knots (∼1 mm apart) located on both sides of the gap between the first and second molars (pointed out with orange dotted ellipse) bilaterally is depicted. (B) Representative tartrate-resistant acid phosphatase (TRAP)–stained sections of gingival tissues harvested at each time point after ligature placement at low (original magnification ×100; scale bar, 100 μm) and high (enlarged yellow frame, original magnification ×400; scale bar, 50 μm) magnifications are shown (1 = the first molar; 2 = the second molar; B = alveolar bone; G = gingival epithelium; arrowheads mark osteoclasts). (C) Total number of osteoclasts per TRAP-stained slide at the ligature site for each time point after ligature insertion. Results represent the mean ± the SD (n = 3 per group, ∗P < .05; ∗∗∗P < .001; and ∗∗∗∗P < .0001 determined using the Mann-Whitney U test). (D) Representative sagittal 3-dimensional and bidimensional (yellow dotted frame) views of the maxillary molars 0 and 14 days after insertion of ligatures are shown. Double-headed yellow arrows mark the distance from the cementoenamel junction to the alveolar bone crest (CEJ-ABC). (E) CEJ-ABC length on the buccal side of the ligature site at each time point after insertion of ligatures is depicted. Bars show the mean ± the SD (n = 6 per group, ∗∗∗P < .001 determined using the Mann-Whitney U test). (F-J) For the isolation of oral bacteria, ligatures were collected from mice 3 hours after ligature placement (day 0) or 14 days after ligature placement (day 14). (F) The relative abundance of microbiota (family level) in the oral cavity and fecal contents at each time point after insertion of ligatures analyzed by 16S rRNA sequencing are shown. (G-H) PCoA by AMOVA of family composition for oral (G) and fecal (H) microbiota from each mouse (n = 4-5 per group). (I) α-Diversity (Shannon index) of oral and fecal microbiota at day 0 and day 14 after OLP is shown (n = 4-5 per group, ∗P < .05 determined using the Mann-Whitney U test). Data are shown as means ± SDs. (J) Volcano plots of differential expression sequencing 2 (DESeq2) analysis showing the amplicon sequence variants identified to the family level features of oral and fecal microbiota that are differentially abundant between the control and OLP groups on day 0 of allo-HCT (n = 4-5 per group). Blue-square (control) and orange-circle (OLP) dots represent bacterial families that significantly differ (log2-fold change of >1, adjusted P value < .05) between each group. The black dots represent families whose abundance is similar between the 2 groups (P value is not significant or the log2-fold change is <1). (K) Body weight change of mice after mock or OLP are shown. Data are presented as the mean ± SD (n = 5 per group). Statistical significance was tested using the Mann-Whitney U test. (L) Representative hematoxylin and eosin–stained histology sections of skin, liver, small intestine, and large intestine at days 0 and 14 after OLP are shown. No significant differences were observed between naïve and OLP mice in any of the tissues examined. Scale bar, 100 μm. (M) Pathological scores of the skin, liver, small intestine, and large intestine at day 0 and day 14 after OLP. The pathology score is based on the diagnostic criteria for cGVHD and reflects the extent of inflammation (day 0 vs day 14, n = 5 per group). Panels B through E and K through M are representative data of 2 independent experiments.
Figure 3.
Figure 3.
Oral dysbiosis before allo-HCT worsens cGVHD. (A) The experimental procedure for HCT of OLP or control mice is shown. Recipient mice received oral ligatures 14 days before HCT. Spleen T cells and T cell–depleted bone marrow cells from donor mice were injected into irradiated recipients (control and OLP mice, n = 5 per group). Ligatures were kept during the HCT period. Mice were euthanized at day 21 after HCT for analysis. (B-C) The clinical aGVHD score and OS of BALB/c recipients of C57BL/6 donors are shown. The clinical aGVHD score was analyzed using a Wilcoxon matched-pairs signed-rank test, and the data represent the mean ± standard error (SE; control allogeneic mice vs OLP allogeneic mice, n = 5 per group). OS data were analyzed by the log-rank test (control allogeneic mice vs OLP allogeneic mice, n = 5 per group). (D) Representative images of systemic symptoms (ruffled fur and hunched posture), skin damage, and diarrhea of BALB/c recipient mice with or without ligatures at day 21 after HCT using either syngeneic (BALB/c) or allogeneic (B10.D2) donors. The OLP allogeneic recipient mice developed more severe signs of cGVHD than control mice, such as hunch (orange arrow), skin injury, blepharitis, and keratinization (orange arrowheads), and diarrhea (orange cross). (E-F) Representative cGVHD skin score and OS for BALB/c recipients of B10.D2 donor grafts are shown. The cGVHD skin score was analyzed using a Wilcoxon matched-pairs signed-rank test. Data represent the mean ± SE (control allogeneic mice vs OLP allogeneic mice, n = 5 per group). OS data were combined from 6 independent experiments and were analyzed by log-rank test (control allogeneic mice vs OLP allogeneic mice, n = 30 per allogeneic group, n = 18 per syngeneic group). (G-H) Representative cGVHD skin scores and OS of B6D2F1 recipients transplanted with C57BL/6 grafts are depicted. Chronic GVHD skin scores were analyzed using the Wilcoxon matched-pairs signed-rank test and are depicted as means ± SE (control allogeneic mice vs OLP allogeneic mice, n = 5 per group). OS data shown are combined from 4 independent experiments and were analyzed using the log-rank test (control allogeneic mice vs OLP allogeneic mice, n = 20 per allogeneic group, n = 12 per syngeneic group). (I-J) Representative cGVHD skin scores and OS of B6D2F1 recipients transplanted with C57BL/6 grafts using PTCy are depicted. Chronic GVHD skin scores were analyzed using a Wilcoxon matched-pairs signed-rank test with the data shown as means ± SE (n = 5 per group). OS data were analyzed by the log-rank test (n = 5 per group). (K) Representative images of the skin, liver, small intestine, large intestine, and salivary gland stained by hematoxylin and eosin of BALB/c recipients transplanted with B10.D2 grafts at day 21 after HCT. Scale bar, 100 μm. (L) Pathological cGVHD scores of the skin, liver, small intestine, large intestine, and salivary gland at day 21 after HCT. Pathological scores were analyzed by the Mann-Whitney U test and are represented as means ± SD (control allogeneic mice vs OLP allogeneic mice, n = 4-6 per allogeneic group, n = 3 per syngeneic group, ∗P < .05; and ∗∗P < .01). Panels B through E, G, and I through L are representative data of 3 independent experiments. Syn, syngeneic.
Figure 4.
Figure 4.
Oral dysbiosis activated cervical LN APCs before allo-HCT and systemic inflammatory T-cell responses after allo-HCT. (A) The percentage and absolute number as well as expression of activation markers in cervical LN APCs of BALB/c control or OLP mice 14 days after ligature placement (n = 5-8 per group, ∗P < .05; ∗∗P < .01; and ∗∗∗P < .001, determined by the Mann-Whitney U test). Data represent means ± SDs. (B) DCs from cervical LNs of BALB/c control or OLP mice 14 days after ligature placement were used to stimulate T cells isolated from C57BL/6 mice in mixed lymphocyte reactions (MLRs) for 48 hours. CD3, CD4, and CD8 T-cell proliferation are depicted as the percent that divided at least once determined by CellTrace violet dilution (n = 8 per group, ∗∗P < .01; and ∗∗∗P < .001, determined by the Mann-Whitney U test). Data are shown as means ± SDs. (C-D) The percentage and absolute number of CD4+/IL-17+ and CD8+/IFN-γ+ cells of BALB/c recipients from B10.D2 donor grafts at day 21 after allogeneic HCT in (C) the cervical, axillary, and inguinal LNs, and (D) the spleen are shown (n = 9-14 per group, ∗P < .05; ∗∗P < .01; and ∗∗∗P < .001, determined using a Mann-Whitney U test). Data represent means ± SDs. Panels A and B show data representative of 2 independent experiments, and panels C and D show data representative of 3 independent experiments. IFN-γ+, interferon-gamma positive; IL-17+, interleukin-17 positive.
Figure 5.
Figure 5.
Oral dysbiosis enhanced Enterococcaceae expansion and translocation. (A) Relative abundance of oral microbiota (family level) in control and OLP mice at day 0 and day 21 after allogeneic (BALB/c recipients from B10.D2 donor grafts) HCT (n = 4-5 per group). (B) PCoA by AMOVA of family compositions of oral microbiota in the control and OLP group at day 0 and day 21 after allogeneic (BALB/c recipients from B10.D2 donor grafts) HCT (n = 4-5 per group). (C) α-Diversity (Shannon index) of oral microbiota in the control and OLP group at day 0 and day 21 after allogeneic (BALB/c recipients from B10.D2 donor grafts) HCT (n = 4-5 per group, ∗P < .05; and ∗∗P < .01 determined by the Mann-Whitney U test). Data represent means ± SDs. (D) Volcano plots of DESeq2 analysis showing the amplicon sequence variants identified to the family level features of oral and fecal microbiota that are differentially abundant between the control and OLP groups on day 21 after allo-HCT (BALB/c recipients from B10.D2 donor grafts, n = 4 to 5 per group). Blue- square (control) and orange-circle (OLP) dots represent family entities that are significantly abundant in each group with log2-fold change of >1. The black dots represent the family features whose abundance is similar between the 2 groups for which the P value is not significant or the log2-fold change is <1. (E) Quantitative polymerase chain reaction (qPCR) results for the absolute abundance of total microbiota attached to 1 ligature and fecal samples in the control and OLP groups on days 0 and 21 after allo-HCT (BALB/c recipients from B10.D2 donor grafts). Data show the mean ± SD (n = 4-5 per group, ∗P < .05; and ∗∗P < .01, estimated by the Mann-Whitney U test). Each dot indicates an individual mouse. (F) Representative Enterococcus immunofluorescence images in the cervical LNs of BALB/c recipients from B10.D2 donor grafts at day 0 and day 14 after HCT are shown. The top row shows nuclei stained with DAPI (4′,6-diamidino-2-phenylindole). The middle row shows Enterococcus stained with AF594 (arrowheads point to Enterococcus). The bottom row shows the merger of the top and middle rows (scale bar, 30 mm). (G) The number of Enterococcus in 1 cervical LN from control and ligature mice at day 0 and day 14 after allogeneic (BALB/c recipients from B10.D2 donor grafts) HCT, respectively, are shown (n = 4-5 per group, ∗P < .05 determined by the Mann-Whitney U test). Data represent means ± SDs. Panels F and G show data representative of 3 independent experiments.
Figure 6.
Figure 6.
Removing ligatures and applying oral antibiotic ointment improved cGVHD by reducing allogeneic immune responses. (A) Improvement of CEJ-ABC measurement after removing ligatures without HCT. Day −14 is the day ligatures were inserted. Day 0 is the day ligatures were removed. Days 7, 14, and 21 indicate the time points after removing ligatures (day 0 vs each time point, n = 4-6 per group, ∗∗P < .01; and ∗∗∗P < .001 determined using a Mann-Whitney U test). Data represent means ± SDs. (B) The experiment protocol for ligature-removal experiments (C-H) is shown. “Ligature-removal” mice had ligatures inserted 28 days before HCT and removed 14 days before HCT. By contrast, ligatures were inserted 14 days before HCT in OLP mice and remained in place throughout HCT. (C-D) Representative cGVHD skin scores and OS of BALB/c recipients of B10.D2 donor grafts are shown. Statistical significance of cGVHD skin scores were analyzed using the Wilcoxon matched-pairs signed-rank test. Data represent means ± SEs (OLP allogeneic mice vs ligature-removal allogeneic mice, n = 5 per group). OS data were combined from 2 independent experiments. Statistical significance was determined using the log-rank test (OLP allogeneic mice vs ligature-removal allogeneic mice, n = 10 per group). (E) Relative abundance of oral microbiota (family level) in the allogeneic control, OLP, and ligature-removal mice on day 21 after HCT are shown (n = 4-5 per group). (F) PCoA by AMOVA of oral microbiota family composition of each mouse on day 21 after HCT is shown (n = 4-5 per group). (G) α-Diversity (Shannon index) of oral microbiota in the control, OLP, and ligature-removal groups on day 21 after HCT is shown (n = 4-5 per group, ∗P < .05; and ∗∗P < .01 determined using the Mann-Whitney U test). Data represent means ± SDs. (H) Total microbial burden per ligature in control, OLP, and ligature-removal group on day 21 after allo-HCT (BALB/c recipients from B10.D2 donor grafts) as determined by qPCR is shown. Data are mean ± SD (n = 4-5 per group, ∗P < .05; and ∗∗P < .01, estimated by Mann-Whitney U test). (I) Percentage CEJ-ABC lengths (relative to day 0) of untransplanted OLP mice on the day of ligature placement (day −14), on the day oral antibiotic therapy was started, on day 7 of oral antibiotics, on day 14 of oral antibiotics, and on day 21 of oral antibiotics are shown. Oral antibiotic ointment consisted of a combination of VCM, MINO, CLDM, metronidazole, and ciprofloxacin. Vehicle control mice received petroleum jelly (antibiotics treatment group vs vehicle group, each time point, n = 4 per group, ∗P < .05 determined using the Mann-Whitney U test). Data represent means ± SDs. (J-K) Representative cGVHD skin scores and OS of BALB/c recipients of B10.D2 donor grafts treated with or without oral antibiotic ointment from day 0 to day 35 after HCT are shown. Statistical significance of cGVHD skin scores were analyzed using a Wilcoxon matched-pairs signed-rank test. Data represent means ± SEs (OLP allogeneic mice without antibiotics vs OLP allogeneic mice with antibiotics, n = 5 per group). OS statistical significance was determined using the log-rank test (OLP allogeneic mice without antibiotics vs OLP allogeneic mice with antibiotics, n = 5 per group). (L) The relative abundance of oral microbiota (family level) in control mice, OLP mice treated with the antibiotic, and OLP mice not treated with antibiotics on day 21 after allo-HCT is shown (n = 3-5 per group). (M) PCoA by AMOVA of oral microbiota family composition of control mice, OLP mice treated with antibiotics, and OLP mice not treated with antibiotics on day 21 after allo-HCT is shown (n = 3-5 per group). (N) α-Diversity (Shannon index) of oral microbiota in control mice, OLP mice treated with antibiotics, and OLP mice not treated with antibiotics on day 21 after allo-HCT is shown (n = 4-5 per group, ∗P < .05; and ∗∗P < .01 determined using the Mann-Whitney U test). Data represent means ± SD. (O) Bacterial load per ligature in control mice, OLP mice treated with antibiotics, and OLP mice not treated with antibiotics on day 21 after allo-HCT (BALB/c recipients from B10.D2 donor grafts) measured by qPCR is shown. Data are mean ± SD (n = 3-5 per group, ∗P < .05; and ∗∗P < .01, estimated by Mann-Whitney U test). (P) DCs from the cervical LNs were isolated from BALB/c mice that had ligatures in place for 14 days before analysis; that had ligatures in place for 28 days before analysis and were treated with an oral antibiotic combination (VCM, CLDM, and MINO) 14 days before analysis; or that had ligatures placed 28 days before analysis but were removed 14 days before analysis. The DCs from each of these groups were used to stimulate T cells isolated from the spleens of C57BL/6 mice in MLRs for 48 hours. CD3, CD4, and CD8 T-cell proliferation are depicted as the percent that divided at least once determined by CellTrace violet dilution. Data represent means ± SDs (n = 4 per group, ∗P < .05; and ∗∗P < .01 determined using the Mann-Whitney U test). Panels C, J, and K show representative data of 3 independent experiments, and panel P shows representative data of 2 independent experiments.

Comment in

Similar articles

Cited by

References

    1. Jenq RR, van den Brink MRM. Allogeneic haematopoietic stem cell transplantation: individualized stem cell and immune therapy of cancer. Nat Rev Cancer. 2010;10(3):213–221. - PubMed
    1. Wingard JR, Majhail NS, Brazauskas R, et al. Long-term survival and late deaths after allogeneic hematopoietic cell transplantation. J Clin Oncol. 2011;29(16):2230–2239. - PMC - PubMed
    1. Arai S, Arora M, Wang T, et al. Increasing incidence of chronic graft-versus-host disease in allogeneic transplantation: a report from the Center for International Blood and Marrow Transplant Research. Biol Blood Marrow Transplant. 2015;21(2):266–274. - PMC - PubMed
    1. Jagasia MH, Greinix HT, Arora M, et al. National Institutes of Health consensus development project on criteria for clinical trials in chronic graft-versus-host disease: I. the 2014 Diagnosis and Staging Working Group report. Biol Blood Marrow Transplant. 2015;21(3):389–401.e1. - PMC - PubMed
    1. Anderson BE, McNiff JM, Jain D, Blazar BR, Shlomchik WD, Shlomchik MJ. Distinct roles for donor- and host-derived antigen-presenting cells and costimulatory molecules in murine chronic graft-versus-host disease: requirements depend on target organ. Blood. 2005;105(5):2227–2234. - PubMed

MeSH terms